“Something Miraculous Happened over 26 Billion Years Ago[1]. We all are living with or studying its wonder, its order, and its consequences.”
Chapter 13
Regolith of Taurus–Littrow: Ejecta Zones, Source Craters,
Ages and Implications
 A part of a DTM constructed from four Apollo 17 nadir metric mapping photos from rev. 14 and four from rev. 15 of the Taurus-Littrow environs (north is up). The valley extends from the upper middle towards the lower right. The main features are the small Family Mountain at the valley entrance at left; the Lee-Lincoln Scarp crossing the valley from the South to the North Massifs; the avalanche from the northeast facing slope of the South Massif (horseshoe crab shaped mountain in center); the Crater Cluster in the valley center north of Bear Mountain; the Sculptured Hills mostly in shadow to the right of the North Massif; and also the East Massif casting a large shadow at the right end of the valley. (Total DTM triangulated from NASA photos AS17-M-0445 through M-0448 and AS17-M-0594 through M-0597 by the editor (Wells, 2021, Fig. 3.13c)).
Preface
Comparison of the valley of Taurus-Littrow on the Moon with the Grand Canyon of the Colorado on Earth has been irresistible for over half a century. Since I explored this last site of the Apollo lunar landings, I have used this reference repeatedly.
Recently, Basil Tikoff and Thomas Shipley wrote in awe of the Grand Canyon[2]: “Standing on the rim of the canyon, you viscerally experience the name—it feels big in a way that pictures do not capture. The immensity of absence, which is the Grand Canyon, is conveyed across all of the senses. For instance, the soundscape of the rim is not silence; you can hear the wind. Yet the sound quality is unfamiliar; absent are the common echoes from the nearby surfaces. The space of the canyon is so immense that echoes disappear. The Grand Canyon’s ubiquity in geology and popular culture reflects in part, the clarity with which stories of time are written in its space.”
If Tikoff’s and Shipley’s insights about the Grand Canyon were applied to Taurus-Littrow on the Moon, it might be said: “Standing on the floor of the valley of Taurus-Littrow, your brain must assimilate what it knows about size without references to the familiar and without sound other than the life-preserving movement of oxygen in the fragile envelope around you. Brilliant massif walls, illuminated by a morning Sun, silhouetted in reverse against a blacker than black sky, rising above a chasm deeper than the Grand Canyon, and watched over by the seemingly stationary blue and white Earth above the highest of the confining walls. The valley’s geological record of time precedes that of even the magnificent strata of the Grand Canyon, as far into the past as that natural wonder takes us, but its pages of the history of our solar system are far more subtle , but nonetheless reflect the order imposed by Creation.”
The presence of an experienced field geologist as Lunar Module Pilot on Apollo 17’s mission to explore the valley of Taurus-Littrow, as well as over 53 years of reports on analytical studies from the returned samples and geophysical data, provide a unique opportunity for integrated scientific synthesis. Large scale reviews of the vast stores of observational, photographic, petrographic and analytical data for the areas of Apollo exploration have not occurred over the 40 to 50 years since these data were published, documented in “gray” unpublished volumes and abstracts, or burned in to explorers’ memories.
Beginning in the 1950s, funding for lunar science has almost entirely been the purview of the National Aeronautics and Space Administration (NASA) and the National Science Foundation (NSF), with earlier contributions by the Geological Survey and various academic institutions. The understandable tendency of scientists to focus on narrow, definable questions as well as on the equally narrow interests and results-oriented biases of federal agencies, however, almost never have encouraged proposals to undertake broad integration and correlation of the full range of the resulting vast reservoir of available information. Small exceptions to this existing paradigm of closely bounded research efforts have been NASA’s funding of early “consortium” studies of specific mission sample suites and the recent Apollo Next Generation Sample Analysis (ANGSA) program. The latter, however, still largely concentrated on one Apollo 17 drive tube core sample.
Over the last 15 years or so, the author has attempted the synthesis of the observations, imagery and samples related specifically to his Apollo 17 exploration of the valley of Taurus-Littrow. Such research is a dynamic and, of course, a continuous process. As the project progressed, new insights required sequential revisions of previous approaches to portions of the synthesis that, in turn, required alternative approaches to be considered. Eventually, an internally consistent picture of the geology and history of the Taurus-Littrow valley emerged. The iterative nature of the synthesis of many data sets results in early sections of this work referring to later sections so that the reader is aware of the details that led to various integrated findings that supplanted earlier, more tentative results.
The ~50 km long Taurus-Littrow, fault-bounded valley radially penetrates the outer ring of uplifted and augmented massifs that encircle the 740 km diameter, Serenitatis Basin. Taurus-Littrow’s varied, 1600 to 2200 m high valley walls of impact melt and fragmental breccias constitute ejecta from the Crisium, Serenetatis, and Imbrium basin-forming events. Lithoclastic ash, basaltic lava, pyroclastic ash, and subsequent impact-derived debris that partially fill the valley and covered earlier features provide insights into a variety of eruptive, impact and mass wasting activity. The first of such activity closely followed deposition of ejecta from the Imbrium Basin and additionally provide insights into the nature and origin of materials in the lunar interior.
The synthesis of these data has been greatly influenced by early studies that relate to the upper-most 938 million years of a 3.8 billion year accumulation of regolith ejecta that comprise the 294 cm, Apollo 17 deep drill core. Isotopic and maturation data from the core and other samples indicate that the average energy of the solar wind increased about 514 million years ago and then increased again about 200 million years ago, this latter increase by over a factor of ~3.4. A spectrum of impacts, avalanches, debris flows, boulder shadowing, and thrust faults that occurred subsequent to valley volcanism add additional perspectives into recent lunar and solar history and provide samples from which values for the rates of aging of exposed debris (regolith) have been derived. These rates of aging, in turn, allow estimates for the ages of 10 regolith ejecta source craters located throughout the valley.
There is great and unique value of a far-ranging synthesis of data related to each Apollo landing site in increasing understanding of the geological history of specific sites as well as the internal, solar and other dynamic factors that recorded that history.
Harrison H. Schmitt
Apollo 17 Lunar Module Pilot and Field Geologist
Major Findings:
-
-
- The Apollo 17, 294 cm long, deep drill core sample of Taurus-Littrow regolith (70001/9; see Fig. 13.1a↓, Fig. 13.1b↓, Fig. 13.5↓ for location) is comprised of 11 strata or zones of regolith ejecta derived from ten 400-800 m diameter source craters and one 1400 m source crater, the ages of which span 938 million years of lunar history and represent the upper portion of ~11 m of regolith ejecta deposited on ilmenite basalt, the youngest eruption of which was at ~3.795 Ga.
- Growth of exposure-related maturity indices (∆Is/FeO), in the core’s regolith ejecta zones, due to the reduction of structural Fe++ to Feº, is the result of (1) alpha+beta particles from the decay of uranium and thorium (∆Is/FeO / Myr = 0.58 per ppm U+Th); and (2) surface exposure to solar protons (∆Is/FeO / Myr = 0.11 for young regolith and 0.032 for old regolith).
- Exposure ages and deposition ages for the deep drill core’s regolith ejecta zones can be calculated from half-cm logging of a zone’s ∆Is/FeO divided by the zone’s total ∆Is/FeO / Myr.
- Half-cm logging of the deep drill core, comparison of core zone cosmic ray exposure ages with ∆Is/FeO-based exposure ages, and Is/FeO relationships at Shorty and Van Serg Craters show that impact shock partially resets the “Is” component of maturity indices, ranging from a few percent for small impacts that average one every ~5.8 Myr near the core to over 90% for zone source craters that average one every ~95 Myr.
- Relationships between the core’s regolith ejecta zones’ ∆Is/FeO and δ15N‰, and ancient regolith δ15N‰ values <210‰ show: (1) a sharp change in δ15N‰ from ≤210‰ to about –118‰ at ~512 Myr ago; (2) a lunar δ15N‰ accretionary value of ~+80‰; and (3) a factor of ∼3.4 increase in solar wind energy at ~199 Myr ago, with the increase in solar 15N production at ~514 Myr, within probable error limits, being related to warming associated with the Cambrian Explosion of oceanic life on Earth at ~538 Myr.
- The absence of Is/FeO values >2 in glassy pyroclastic ash in core 74001/2, particularly values that would result from alpha+beta particles, and the attenuation of Is/FeO growth in deep drill core zones as a function of ash content, indicates that a very small separation of Fe++ from uranium and thorium and from access by solar protons prevents Feº formation.
- Positive values for δ15N‰ (+13‰) in buried pyroclastic ash of core 74001/2, versus a current solar wind value of ~118‰ indicate a chondritic lower mantle source for the ash magma and volatiles and suggest a lunar origin by accretion and capture rather than from a giant impact on the Earth.
- The young and old light mantle avalanche deposits are two of at least seven mass wasting deposits from the slopes of the Taurus-Littrow massifs and have Is/FeO-based exposure ages, respectively, somewhere between 27-32 Myr and 10-15 Myr and deposition ages, respectively, somewhere between of 27-32 Myr and 37-47 Myr with a deposition age of ~4 Myr for the ancient light mantle.
- Mass wasting activity from the slopes of the South and North Massifs and from a peak in the Sculptured Hills is likely the consequence of repeated thrust faults along the Lee-Lincoln Fault caused by continued contraction of the gradually cooling Moon.
- Comparison of North and South Massif regolith samples from the valley of Taurus-Littrow indicate that volatile-rich, lithoclastic volcanic eruptions preceded those that produced the ~3.795 Ga mare basalts.
- Symplectitic partial coronas in troctolite 76535 between plagioclase and olivine consisting of retrograde symplectitic textures made up of Cr-spinel intergrown with clineoproxene next to plagioclase and with orthopyroxene next to olivine have replaced prograde Cr-rich garnet and indicate this sample (and crushed dunite 72415) originated below ~400 km in the partially differentiated magma ocean as a result of overturn triggered by the Procellarum basin-forming impact at ~4.35 Ga that also resulted in the partial melting of the warm upper mantle to produce Mg-suite plutons.
- The synthesis of data from Taurus-Littrow indicates that the Imbrium Basin forming impact occurred between 3.850 and 3.795 Ga.
- The addition of water to the early impact-generated regoliths of Earth and Mars would create smectic clay mineral species (phyllosilicates) whose adaptive silicate sheet crystal structures and compositions could serve as templates for the organization and stabilization of complex, pre-biotic and biotic organic molecules.
-
1.0 Introduction
Any discussion of the science of the lunar regolith must acknowledge the foundational observations and interpretations made by Gene Shoemaker (Shoemaker, 1965; Shoemaker et al., 1967), based on his early studies and on the Surveyor III television observations of its landing site in Mare Cognitum. Shoemaker’s insights were followed by the seminal work of Larry Taylor that advanced understanding of the lunar regolith sampled by the Apollo astronauts. Taylor’s and his associates’ vast contributions to deciphering the character and formation of lunar regolith are without peer (e.g., Taylor, 1988; Carrier et al., 1991; Pieters, Taylor and Noble, 2000?; Taylor et al., 2001a, 2001b; Pieters et al., 2010).
Contributing to the studies by Taylor and others, the Apollo 17 mission to the valley of Taurus-Littrow (Schmitt and Cernan, 1972a; Schmitt, 1973, 2021a; Wolfe et al., 1981; Meyer, 2012) provided a uniquely broad and diverse suite of regolith samples and the massif and volcanic components contained within them. Review, integration and synthesis of the geologic context of this sample suite and published analytical research continue to give special insights into the processes of regolith formation as well as indirect clues related to other important issues of lunar geology and solar and Earth history. Of particular importance to the development of various regolith-related hypotheses have been the maturity indexes (Is/FeO) conceived of and measured by Richard Morris (1978, 1979, 1989); the nitrogen isotopic measurements by Robert Clayton, Mark Thiemens, and Richard Becker (1975, 1977, 1980); and John Ketterige (1991); cosmic ray exposure ages by Peter Eberhardt (1974) and Eugster (1977, 1979, 1981, 1985); uranium and thorium analyses by Lee Silver (1974); and, of course, the wonderful Lunar Sample Compendium of Charles Meyer (2012). These pioneers were all assisted by innumerable colleagues of the Apollo lunar science generation.
The Lunar Source Book (https://www.nasa.gov/history/alsj/) and the Lunar Sample Compendium (https://curator.jsc.nasa.gov/lunar/lsc/index.cfm) produced by Grant Heiken, David Vaniman, and Bevan French (1991) and Charles Meyer (2012), respectively, and the Professional Papers on the geology of individual missions published by the Geological Survey are invaluable sources of compiled data and references from a nearly infinite number of sources. Most recently, the Apollo Next Generation Sample Analysis (ANGSA) program has added significant data for integration into studies of avalanche deposits (Shearer et al., 2022, 2024) and Thermo-luminescence of shadowed samples (Shelke and Sears, 2022; Sears et al., 2024).
The analytical data are bolstered by the petrographic observations of Grant Heiken and David McKay (1974), Dave Vaniman and Jim Papike (1979), Jeffrey Taylor and his colleagues (1979), and John Nagel (1979), along with the author’s field observations during the Apollo 17 mission (Schmitt, 2023a, Chapters 10-12; 2024a,b,c). Equally valuable to this synthesis is Eric Jones’s Apollo 17 Apollo Lunar Surface Journal with its crew annotated transcripts and referenced Hasselblad camera images (https://history. nasa.gov/alsj/a17/a17.html) and Ed Wolfe and his colleagues’ integration of early Apollo 17 geological interpretations with sample locations and other data.
1.1 General Nature of Lunar Regolith
Particles that make up the Taurus-Littrow regolith (Shoemaker, 1965, 1967; Heiken and McKay, 1974; Pieters et al., 2010) consist of varying proportions of mineral and rock fragments, regolith breccia fragments, volcanic ash beads and shards, and abundant impact generated, vesicular glassy agglutinates containing some or all these other particles. The mineral and rock fragments and bulk compositions of given regolith areas tend to reflect mixtures of regolith developed on near-by bedrock units. Other than spherical beads of volcanic ash and some transported impact glass, almost all particles are irregular in shape with vesicular glassy agglutinates having largely fractal outlines. Particle sizes range from hand-specimen size and larger to less than a micron with up to fifty percent by weight being less than about 70 microns, and they generally show an approximate bell-shaped size-frequency histogram (Graf, 1993), although variations in histograms shape and peak sizes are very useful in some interpretations. Observationally (Schmitt, 2023a, Chapters 10-12; 2024a,b,c), rock fragments >2 cm in diameter tend to be <5% of the total surface area of inter crater areas (Schmitt, 1972, 2023a, 2024a,b,c; Meyer, 2012, sample 70001/9; Hasselblad images).
Broadly distributed, ancient silicate-dominated surface regolith on Earth and apparently on Mars, likely played a role in the origin of complex organic molecules and their organization into replicating life forms (Schmitt, 2015). Once stable and relatively cool planetary crusts had differentiated from an accretionary magma ocean and stabilized in an impact-dominated and water-rich environment, clay minerals (phyllosilicates), particularly of the smectite group, would have been the dominant mineral species at the Earth’s surface. The characteristic of smectitic clays to incorporate many elements and molecules into their hydrous sheet-like crystal structure offered the potential of organizing organic bases and essential elements into increasingly complex forms.
High-energy solar wind ions and micro-meteors impacting the Moon apparently erode plasmas from exposed particle surfaces that re-deposit on local mineral and glass surfaces (Taylor, 1988; Taylor et al., 1994; Burgess and Stroud, 2018; Cymes et al., 2022a; Cymes et al, 2022b; Li, 2022). Protons (H+) in the average solar wind have energies of a few Mev and abundances of about (6 ions/cm3. Protons from solar flares and CMEs, however, arrive at the Moon with Gev energies and abundances of 100s of ions/cm3 (Reames, 2017; Oldensald, 2004) and may dominate the plasma-forming process. The resulting re-deposition of plasma material from this so-called “sputtering” process, probably with some contribution from micro-meteor impact plasmas, produces a nearly ubiquitous but discontinuous, ~50 µ thick patina of alumino-silicate glass patina on regolith particles and rock surfaces. The glass present in the pits formed by micro-meteor impacts on rock surfaces suggests a contribution of impact plasmas to these patinas.
Alpha and beta particles from internal uranium and thorium decay, with minor contribution from solar proton radiation, reduces Fe++ to Feº (npºFe) (Morris et al, 1975; Taylor, 1988). Impact gardening gradually exposes new regolith particles to this surface-specific process and mixes previously exposed particles throughout the zone. The titanium-bearing mineral ilmenite, FeTiO3, appears to be the preferred host for this concentration of nano-phase iron (Cameron, 1990; Taylor et al., 1993). Solar wind volatiles may be concentrated in 5-50 µ diameter vesicles as well as being present in crystal defects and cracks (see Taylor, 1988; Taylor et al., 2005; Burgess and Stroud, 2018; Cymes et al., 2022a; Cymes et al, 2022b; Ao, 2022).
Nano-phase iron production occurs throughout a regolith zone due to ionizing alpha particles, and probably by associated beta radiation, that comes from internal uranium and thorium decay. This source of nano-phase iron has been neglected in past maturation studies; however, Bower et al.’s (2016) analysis of pleochroic halos around uranium- and thorium-bearing zircons in biotite found that radiation from uranium and thorium decay also converts structural Fe++ in biotite to Feº. Alpha+beta radiation, therefore, must be taken into account in the interpretation of variations in regolith maturation, as uranium and thorium exist in amounts of 1-4 ppm in Taurus-Littrow regolith samples. Extremely fine fragments of minerals and glass containing both elements have been broadly disseminated during long-term impact gardening of lunar regolith. Additionally, earlier in lunar history, the concentrations of these continuously decaying elements was significantly greater than today.
2.0 Error Limits Related to Taurus-Littrow Data Synthesis
Much of the following synthesis of over 55 years of data on the Taurus-Littrow regolith involves the integration of different types of measurements (maturity indices, radio-isotopic and cosmic ray ages, petrographic and chemical contents, etc.) each of which have varying estimates of analytical error limits, if any are reported. Accumulated error limits resulting from various calculations, therefore, can grow to numbers that suggest very large uncertainties. On the other hand, the synthesis itself includes various direct and indirect tests on the reasonableness of the results of calculations, as well as, in some cases, confirmation of those results by independent approaches or by their compatibility with clear constraints imposed by the overall geology of the area, or of the Moon, or of the history of the Earth and Solar System. As a consequence, when available, and unless otherwise noted, the error limits on original published data are quoted, but the accumulated hypothetical error limits inherent in various calculations generally are not considered except in terms of the reasonableness of the results.
In this context, the underlying, measurable parameter for initially evaluating the formational history of the lunar regolith consists of the Is/FeO maturity index for returned regolith samples developed and measured by Richard Morris (1976, 1978, 1979, 1989). This objective, maturity data consists of measuring the intensity of the ferromagnetic resonance (Is) of a sample and then normalizing it for comparison with other samples by dividing by each sample’s FeO content. The author of this current narrative originally considered the Is of a sample basically to reflect the amount of nano-phase iron (np°Fe) produced by solar wind proton reduction of regolith Fe++ (Pieters et al., 2000) in proportion to the samples FeO content. It was eventually realized that alpha+beta particle radiation from the decay of uranium and thorium contributes to the formation of np°Fe (Bower et al., 2016).
Morris (1978) states that the precision of the Is measurement used in the Is/FeO determinations is ±5%. As the error limits of FeO determinations used by Morris (usually from R. Warner, unpublished) are not available, measured Is/FeO values used throughout this paper will be assumed to be accurate to be within 5%, that is, Is/FeO = 20 would be ± 1 and Is/FeO = 80 would be ± 4. This assumption implies that inaccuracies in analytical determination of values for FeO are included in the 5% stated by Morris and, nonetheless, would be small enough not to affect the inherent value of Is/FeO as a synthesis tool. On the other hand, consistency in the results of the following synthesis suggest that the precision of Morris’s combined Is and FeO measurements is significantly better than ±5%, possibly about ±2% or even better.
3.0 Apollo 17 Deep Drill Core
3.1 Introduction
The Apollo 17, ~3 m deep drill core (70001/9) (Baldwin, 1973; Meyer, 2012) constitutes the most complete vertical sample of the lunar regolith obtained to date (Meyer, 2012; Heiken, et al., 1991). The deep drill core was obtained during the deployment of the Apollo 17 Apollo Lunar Science Experiment Package (ALSEP) at a location about 180 m west of the landing point of the Lunar Module, Challenger (Figs. 13.1a,b). Synthesis of published analytical data provides new insights into the formational, depositional and exposure history of regolith sampled by this core. Of particular importance are the investigations of maturity indices (Morris, et al., 1979); petrographic characteristics (Vaniman and Papike, 1977; Vaniman et al., 1979; Taylor, et. al., 1979; Heiken, et. al., 1991); bulk compositions (Laul, et al., 1978, 1979, 1981), volatile element concentrations (Laul, and Papike, 1980), nitrogen isotopic measurements (Thiemans and Clayton, 1980), cosmic ray exposure age determinations (Eberhardt, et al., 1974), and uranium and thorium concentrations (Silver, 1974; Laul, et al., 1978, 1979, 1981; compilations by Meyer, 2012).
 Fig. 13.1a. Apollo 17 landing site with the remaining Challenger Lunar Module descent stage located at right; the Apollo Lunar Surface Experiments Package (ALSEP) deployment site; and the deep drill core (DDC; white arrow) site located at left outlined by the light colored box. The ~50 m diameter Rudolph Crater is at top left (LROC image).
 Fig. 13.1b. Enlargement of Fig. 13.1a to show the detail of the ALSEP experiments and the deep drill site locations. Thin parallel tracks were made by the LRV. The heavier, darker tracks were made mostly by my footprints. (LROC image).
The in situ inter-crater regolith sampled by the Apollo 17 deep drill core is made up of eleven definable zones of regolith ejecta from 400-800 m diameter craters and one 1400 m diameter crater within about 6 km of the core site (Schmitt (2019, 2021, 2023a)). Such zones superficially resemble each other, but they show significant differences in detailed maturity (Morris et al., 1979), lithology and mineralogy (Taylor et al. (1979)), and bulk chemical compositions (Laul et al. (1978, 1979, 1981); Meyer (2012); Silver (1974)). These differences, in turn, reflect the compositions and, in part, the pre-excavation maturities and cosmic ray exposure ages (Eberhardt et al. (1974)) of the source regoliths.
The 11 distinct regolith ejecta zones comprise the ~294 cm of material in the deep drill core and record, directly or indirectly, a significant portion of the cratering, regolith maturation, and volcanic history of Taurus-Littrow. These zones also contribute to understanding the distribution of geological units and sequence of impact cratering events that created a corresponding 14 potential source craters, 400-1400 m in diameter, that lie within about 6 km of the core site. The maturity of these regolith ejecta zones due to space weathering and internal alpha+beta particle radiation, as well as associated cosmic ray exposure age data, further allow the approximate dating of these large impact events (§6.0). Certain aspects of the history of the solar wind are also recorded in the core.
Much of the following synthesis relies on analyses and observations of portions of the Apollo 17 deep drill core conducted by many researchers; however, the exact length of the returned core, and thus the precise depth of analyses are not absolutely certain within a few centimeters. For example, Morris et al.’s (1979) maturity index data measured at half-cm intervals are available from –1.30 to 285.85 cm (Morris, pers. comm.), while Silver’s (1974) uranium, thorium and lead analyses and Eberhardt et al.’s (1974) cosmic ray exposure ages are reported up to 290 cm, and Meyer’s (2012) compilation of element analyses goes to 294 cm. To complicate matters further, Meyer (2012) states that when the core was opened, there was a “10-12 cm void” at the base of the upper pair of returned drill stems, that is, where core sample 70008 is now defined. This “void” possibly relates to Astronaut Cernan’s statement, made while the core was still in the ground, that the top, stabilizing “plug” for that section ultimately moved about two-thirds of the length of the compacting rammer. This operation compressed the less compact upper portion of cored regolith. A 10-12 cm thickness of low-density regolith at the surface of inter-crater areas is consistent with direct observations during Apollo 17 EVAs.
Top core section, 70009, is listed in Mitchell et al. (1973) as having a length of 25 ± 2 cm, about 15 cm less than the 40 cm of a full section. As the rammer was about 50 cm long, Cernan’s statement probably meant that “two-thirds” of the rammer was still showing outside the core section for his statement to match Mitchell et al.’s information. In light of the above, and, as Mitchell et al. measured the total “drill stem depth” (not core length) at 305 ± 1 cm with 95-97% recovery, the total length of “core” will be assumed here to be ~294 cm, a length which also matches the Meyer report. Morris (pers. comm.; Morris et al., 2022) records 284.65 cm as the depth of the last Is/FeO measurement given in Morris et al. (1979), but also says that the first measurement was at a depth of “minus 1.30 cm.” These figures suggest that there is ~7 cm of core at the bottom for which Is/FeO data was not obtained.
The following probably contributed to the “10-12 cm void” reported by Meyer:
-
- It is certain that the loosely consolidated upper 10-15 cm of the regolith compacted upon insertion and “ramming” of a plug on top of the core in the first drill stem section before extraction of the drill stem extraction from the regolith.
- During handling and transport to the Lunar Receiving Laboratory in Houston, the core in the first of two drill stem as sections, as well as the top plug, slid away (upward) from the bottom cap.
As will be detailed below (§5), the chemical composition of three samples from the upper 20 cm of the compacted core (Laul et al., 1978) and the composition of nearby control sample 70181 are almost identical, indicating that the control sample gives a good representation of the elemental and mineralogical makeup of the top portion of the core.
3.2 Deep Drill Core Maturity Indices and Regolith Ejecta Zones
Morris et al. (1979) have reported, graphically, the maturity indices (Is/FeO) for nearly the full length of the Apollo 17 deep drill core (Fig. 13.1c). These Is/FeO values reflect the degree of reduction of Fe++ to Feo by internal alpha+beta and surface solar proton particle radiation. They have been derived from the ferro-magnetic response of nano-phase iron (npoFe) particles in regolith samples, normalized to reflect the varying FeO content of the measured regolith samples. Morris et al.’s data plotted in Fig. 13.1c, with a representative example of the raw, detailed, half-cm resolution data set (Morris, pers. comm.) in Fig. 13.1d, indicates the existence of zones of regolith with significantly different degrees of exposure to the internal and external radiation as well as having distinct petrographic characteristics after comparison with other data. This conclusion is supported less precisely in Fig. 13.2 by agglutinate content (Taylor et al., 1979) and “cosmic ray track maturity” (Goswami and Lai, 1979). Of particular importance, however, are the variations in Is/FeO measured as a function of depth that provide data on relative age based on superposition.
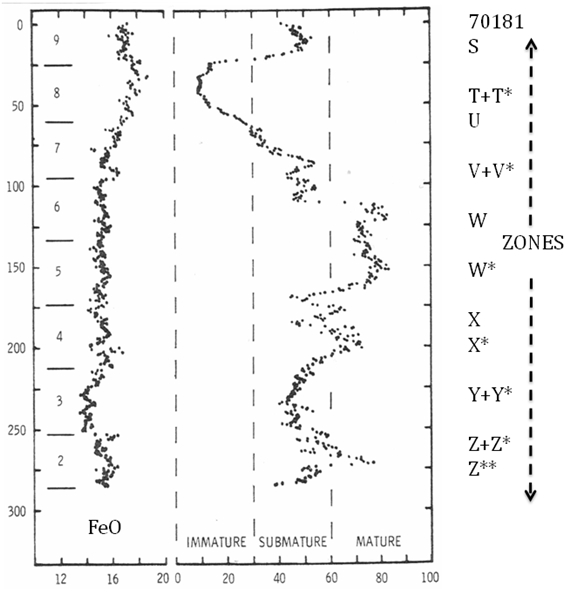 Fig. 13.1c. Plot of Is/FeO maturity indices and FeO content in the Apollo 17 deep drill core (Morris et al., 1979) with a rough indication of the identified regolith ejecta zones shown in the column on the right.
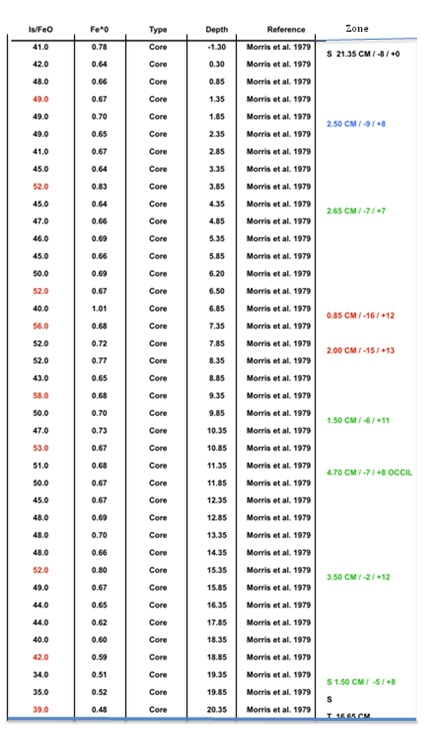 Fig. 13.1d. Representative portion of the half-cm resolution, raw data set (Morris, pers. comm.) related to the deep drill core’s Is/FeO values graphically represented in Fig. 13.1c. Column 6 indicates zone decreases and increases of Is/FeO noted during logging of this data set.
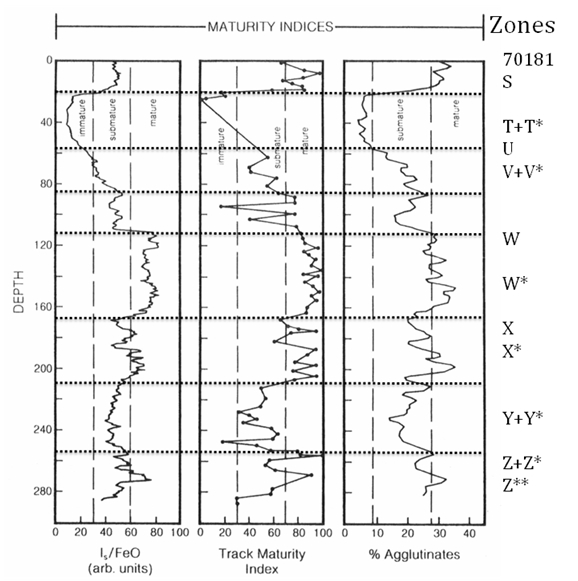 Fig. 13.2. Data on the maturity of the Apollo 17 deep drill core comparing Is/FeO maturity indices, left column (Morris et al., 1979); cosmic ray track density, center column (Goswani and Lai, 1979); and agglutinate content, right column (Taylor et al., 1979). Figure is after Heiken et al., (1972). Approximate regolith ejecta zones S-Z** are largely based on maturity data shown in Fig. 13.1c as verified by logging of half-cm raw data (Fig. 13.1d).
Table 13.1a provides the depth intervals for defined regolith ejecta zones (Column 1) and that are used in the subsequent synthesis of Taurus-Littrow geological, petrographical and analytical data. “Is” is a measure of ferromagnetic resonance and thus of the content of nano-phase iron produced through reduction of Fe++, that is, by (1) solar wind weathering, largely by energetic solar protons (Pieters et al. (2000)), and (2) internal alpha+beta particle radiation (Schmitt (2022)). Micro- and macro-meteor impacts are contributing factors as they continuously garden and mix exposed regolith ejecta as well as produce complementary agglutinates. Sorting out the quantitative effects and implications of these factors is a significant focus of this synthesis.
In Table 13.1a and in subsequent discussions, Is/FeOm and ∆Is/FeO refer to the estimated deposition value of Is/FeO of source regolith, as suggested by the half-cm logging, and the post-deposition accumulation of Is/FeO, respectively. As will be discussed below, the actual pre-deposition total Is/FeO of an integrated source regolith is not given by the value of Is/FeOm in the table, as there is strong evidence that the shock and/or heat of impact partially resets the ferromagnetic component of the near-impact nano-phase iron on which the “Is” component of Is/FeO is based. The extent to which impact reset has affected the logged, estimated Is/FeOm given in Column 3 of Table 13.1a will be examined in §8.0.
With respect to zone S, it appears that the significantly higher velocity regolith ejecta from the large MOCR Crater (§3.4) that constitutes zone S resulted in more mixing with the previously deposited zone T+T* than at other zone boundaries. This mixing zone is about 4 cm thick (22.35 to 18.35 cm) and includes an increase in ∆Is/FeO of ~47 points that is not the consequence of maturation after zone S deposition. The logged post-deposition ∆Is/FeO of zone S is 46, confirmed by the reported ∆Is/FeO = 47 of control sample 70181 (Morris, et al. 1978).
[In the course of this synthesis, the definitions of the various zones have varied. Initially, those definitions were based purely on broad changes in Is/FeO shown in Fig. 13.1d, however, correlations with various other associated data, the half-cm logging of Morris’s detailed data, and improved understanding of source regoliths indicated the need for improvements in these zone definitions. This process first suggested several subzones and then, in some cases, indicated recombination into the original set. This final process is reflected in zones labeled T+T*, V+V*, Y+Y* and Z+Z* in various tables and figures. Subzones W*, X* and Z** proved to be coherent stratigraphic units in their own right, but the asterisk (*) designations have been retained for them.]
Table 13.1a footnotes:

Close examination of the plotted points in Fig. 13.1c shows that the saw tooth patterns present along the length of the core have Is/FeO minima that are roughly constant for various sections of the core. The existence of these minima is best shown in the core sections between 115 and 170 cm. These locally constant minima are probably close to the original deposition maturity index (Is/FeOm). The precise deposition Is/FeOm values are uncertain within about ± 5 in most cases.
In defining stratigraphic zones based on Is/FeO values in the deep drill core, a large, sharp decease or increase in background Is/FeOm is interpreted as the boundary between zone depositions. These defined boundaries are generally supported by petrographic and compositional data as will be discussed in §5. The sum of the positive magnitudes of the small saw tooth spikes, showing the total increase in Is/FeO over Is/FeOm throughout a given zone (∆Is/FeO), is a measure of the post-deposition maturation of the zone before burial by a younger zone.
Table 13.1a gives the regolith ejecta zones identified by examination of Fig. 13.1c, as refined by subsequent analysis that resolved a number of inconsistencies with other data. After preliminary definition, the indicated depths of zones were determined within half a centimeter with reference to the raw Is/FeO data provided by Richard Morris (pers. comm.).
Table 13.1b compares the zone definitions in Table 13.1a with “unit” classifications given by Nagle and Waltz (1979), Vaniman et al. (1979), and Taylor et al. (1979). Although these latter three stratigraphic classifications and their associated descriptions do not line up exactly with the detail in Table 13.1a, they are generally consistent relative to evidence of maturity and source regolith characterization. Nagle and Waltz’s boundaries between zones S and T+T*, V+V* and W, W* X and X* in their sketch of the deep drill core are particularly consistent with the divisions in Table 13.1a Some relevant comparison data have been highlighted in bold.
Table 13.1b footnotes:

3.2.1 Agglutinate Formation in Relation to Is/FeO Maturity Index
Vesicular “agglutinates” composed of mineral and rock particles in a glass matrix accumulate over time at the surface of lunar regolith. These agglutinates are the result of local impact melting and mixing. Their abundance is a rough measure of the relative exposure of a given regolith unit to the geologically steady impact of macro- and micro-meteors. The pattern of abundance of agglutinates (Taylor et al., 1979) in the deep drill core are shown in Fig. 13.3a.
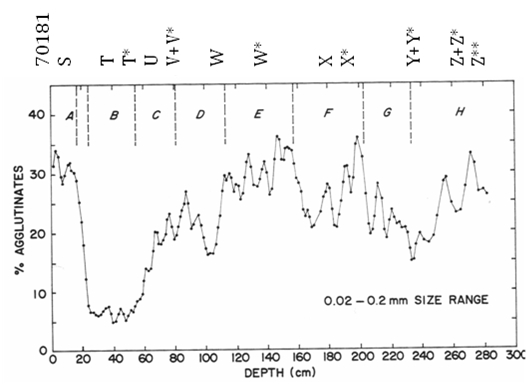 Fig. 13.3a. Graph of percentage variations in agglutinates as measured by modal analysis of 171 thin sections from the deep drill core (Taylor et al., 1979).
As deep drill core values of total Is/FeO (Morris et al., 1979) and total modal-% agglutinates (Taylor et al., 1979) rise with age, a correlation between these two parameters would be expected. Fig. 13.3b gives a visual comparison of this relationship. The indicated graphical relationships zone by zone are given in Table 13.2a with reference to total Is/FeO from Table 13.1a, maximum modal-% agglutinate peak; and the ratio of these two parameters. The ratio of total Is/FeO to maximum agglutinates averages 4.95 ± ~1.7 (lowest and highest ratios not included), verifying the close and constant relationship between nanophase iron production and agglutinate formation.
It would be expected that this relationship would carry over to the ratio between ∆Is/FeO and ∆Agglutinate. Values of ∆Agglutinate shown in Column 4 of Table 13.2b were determined by summing the measured increases with decreasing depth for each zone shown in Fig. 13.3a. Dividing ∆Is/FeO values by ∆Agglutinate values (Table 13.2b) gives a significantly higher ∆Is/FeO to ∆Agglutinate ratio (average of 7.49) than the 4.95 average for total Is/FeO to maximum agglutinate. This discrepancy is likely due to the low resolution of measurements of changes in modal-% of agglutinates, that is, some increases were missed. This conclusion is supported by the fact that the ratios for total Is/FeO to total Agglutinate are generally less than those for ∆Is/FeO to ∆Agglutinate. From personal experience, microscopic “point counting” to determine modal-% of particles is an art of judgment more than of science.
 Fig. 13.3b. Comparison of total Is/FeO (Morris et al., 1979) and modal-% agglutinates (Taylor et al., 1979). Red dash lines indicate the zone widths in Table 13.1a.

3.3 Regolith Transport after Large Impacts in Lunar Gravity and Vacuum
Impacts have dominated the evolution of the Moon’s surface for much of its history (Wilhelms, 1987) from primordial accretion, to the creation of the magma ocean, to the creation of the mega-regolith that now constitutes the lunar crust, to the excavation of the large basins, to the evolution of today’s surface regolith since the formation of a region’s last large impact basin. As craters on the floor of the valley of Taurus-Littrow are, at least in large part, underlain by ilmenite basalt, regolith ejecta zones identified in the deep drill core have their origins in ejecta from impact craters formed since regolith began to form and accumulate on mare basalt erupted about 3.82 Ga (39-40Ar, Schaeffer et al. (1977)).
[Further consideration of the potential closure temperatures for the various isotopic systems suggests that the actual age of the youngest lavas would be close to the 39-40Ar age of rapidly cooled, fine-grained samples. One such sample, 70215, has been dated (using old 40K decay constants) by the 39-40Ar method at 3.82 ± 0.05 Ga. (Schaeffer et al., 1977). In this chapter, this date will be used as representative of the most recent age of the ilmenite basalt lava eruption.
As a means to further tighten the chronology of eruptive activity in Taurus-Littrow, it would be useful to precisely date by 39-40Ar methods other rapidly cooled ilmenite basalt samples from the Apollo 17 collection (e. g., 70075, 71537, 74235, 78586, and 78587). A close examination of un-numbered basalt fragments in the rake samples from Stations 1, 2, 6, and 8 also may include very fine-grained, rapidly cooled ilmenite basalts suitable for dating.
The recently reported revision of the 40K decay constant (Renee et al., 2010); Noumenko-Dezes et al. (2018)); Carter et al. (2020)) would lower previously reported 39-40Ar dates by about 0.025 Ga (Schmitt et al., 2017). However, in order to incorporate as many previously dated samples in this synthesis on a consistent basis, revisions based on the new constant will not be made.]
The regolith zones from the Taurus-Littrow valley floor that are represented in the deep drill core 70001/9 are distinctive because of the presence of detectable regolith contributions from five diverse geologic units related to the massifs surrounding the valley and volcanic ash deposits that contrast with the low SiO2 and low U+Th ilmenite basalt regolith. Those major units are the orange+black low SiO2 volcanic ash, Very Low Titanium (VLT) and high SiO2 volcanic ash, Sculptured Hills Mg-rich suite regolith, North Massif medium SiO2 and U+Th impact breccias, and South Massif high SiO2 and high U+Th impact breccias (§5.0). If new insights are to be gained about the source areas of these regolith zones, the geological challenge is to tie specific regolith zones to specific craters in the Taurus-Littrow valley.
An LROC image-based temporal study of new lunar craters in regolith (Speyerer et al., 2016), indicated that regolith at the sites of recent impacts has been ejected many crater diameters from the impact points and deposited continuously along their trajectory. In contrast, examination of ejecta from fresh craters in lunar basalt of comparable size to the 744 m diameter Camelot Crater (Schmitt et al., 2017) indicates that, much as on Earth, ejected bedrock, extends only about a crater diameter from the crater rim. Thus, it is very probable that significant amounts of regolith reached the deep drill core location after being ejected within a few micro-seconds of the instant of impact at the sites of large craters in the valley of Taurus-Littrow.
Support for this conclusion also is found in Oberbeck’s (1975) experiments on “hypervelocity impacts against a quartz sand layer resting on an ‘indurated’ quartz sand substrate.” Based on the Oberbeck’s and Speyerer et al.’s observations, and the numerous regolith zones identified in the Apollo 17 deep drill core, the following inferences about the impacts that created the 400 m diameter and larger craters in Taurus-Littrow valley appear to be in order:
-
- The geotechnical differences are profound between surface regolith and underlying blocky and solid bedrock, and result in a sharp discontinuity in reactions to impact shock and resulting excavation.
- At the instant of most impacts and during the subsequent few micro-seconds, the transfer of kinetic energy into overlying regolith creates a dense sheath of particles that are accelerated into an inverted, ~45º, continuously expanding, “conical wedge” (Fig 13.4a) (see also Oberbeck, 1975, Fig. 24). (Less common, low angle oblique impacts appear to bias the shape of the sheath in the direction of impactor flight.)
 Fig. 13.4a. Schematic cross-section of a laterally expanding, inverted, conical wedge of ejected regolith formed micro-seconds before a reflected shock wave fully excavates a lunar impact crater.
-
- The initial conical wedge containing ejected regolith will have its unit mass and velocity of contained particles decreasing away from their source as a function of the radially outwardly decreasing kinetic energy released by the impact and the original density and effective depth of regolith in the impact area.
- A proportionally large amount of regolith near the immediate impact point will be accelerated to the highest velocities in the conical wedge. Initial regolith particle velocities, however, are rapidly reduced as the lateral shock wave encounters more and more regolith mass until expansion of the initially flat, nearly cylindrical crater in the regolith ceases to expand due to the lateral resistance of the material encountered.
- As lateral kinetic shock energy dissipates and the transient flat crater diameter increases, more and more mass of regolith is exposed to a lateral shock wave of less and less energy per unit volume.
- Both the radial explosive energy and the ejected mass per cylindrical unit of volume decreases to zero as the energetically maximum possible flat crater diameter is reached.
- The distribution of total ejecta mass and average particle velocity within a unit volume of the conical wedge would be a function of the level of decreasing shock energy at various distances from the point of impact within the forming crater.
- As a consequence of the above, in the lunar gravity and vacuum environment, the expanding, inverted conical wedge of regolith ejecta curves (“blooms”) into a radially irregular 360º, parabolic ballistic arch ( Fig. 13.4b).
- Within the ballistic arch, small differences in particle velocities and trajectories and the evolution of solar wind volatiles through agitation, produce ballistically turbulent mixing of the original regolith strata, creating an at least partially integrated chemical composition (§5.0).
- Deposition of progressively lower velocity regolith ejecta moving outward within the ballistic wedge and parabolic arch would begin at the lowest energy tail of the wedge as it moves across the surrounding surface, away from the rim of the newly formed flat crater. The highest velocity ejecta, of course, would be the last to be deposited down range and would land farthest from the impact point.
 Fig. 13.4b. Schematic cross-section of a laterally expanding, inverted conical wedge that gravitationally transitions, in ultra-high vacuum, into a parabolic arch containing the largest proportion of ejected regolith.
-
- As the hemispherical shock wave of potential and kinetic energy, equal to “mgh and 1/2mv2,” respectively, delivered at the impact point moves downward into broken and then coherent bedrock that underlies the excavated regolith, a reflected shock excavates the main volume of the final crater and deposits that material around the crater rim to a distance of approximately one crater diameter. This relatively late arriving bedrock-related material falls on the earliest, lowest velocity portion of regolith ejecta.
These considerations suggest that the initial and progressively radial but nearly instantaneous release of kinetic energy is the primary factor in the ejection of regolith at the impact site, with remaining kinetic energy and the release of potential energy being the primary factors in subsequent excavation of the crater as a whole.
3.4 Source Craters for Regolith Ejecta in Deep Drill Core
The temporal study of recent lunar meteor impacts (Speyerer et al., 2016), based on comparative examination of LROC images, show that regolith is ejected long distances from the point of impact. In that context, there exist 10, 400-800 m diameter, definable impact craters (Fig. 13.5; Table 13.3a) in the Taurus-Littrow exploration area, plus 8 more that make up the Crater Cluster in the south central valley area and one 1451 m diameter crater east of the exploration area. At least some of the initial regolith ejecta from craters in this size range would have reached the deep drill core site and be possible sources for the regolith ejecta in the identified stratigraphic zones in the core.
 Fig. 13.5. Valley of Taurus Littrow exploration area showing the location of named craters and exploration stations (yellow). The 70009/1 deep drill core site next to the ALSEP deployment area is marked by the yellow X adjacent to “Core”, right of Camelot Crater. (NASA LROC)
The relative geomorphic ages of major potential source craters can be determined by visual comparisons of differences in crater morphology (Melosh, 1977) and in the size-frequencies and distribution patterns of boulders on crater rims and interior walls. The relative ages of crater formation given in Table 13.3a reflect: (1) direct observations (indicated by red entries); (2) surface photography obtained during Apollo 17 EVAs (Chapters 10-12); and (3) diameter to depth ratios measured on QuickMap LROC images. As this report’s synthesis progressed, it became clear that slope mass wasting and nearby crater ejecta affecting some older craters required the use of some geological adjustment of estimated relative ages.

A close study of the large craters in Taurus-Littrow indicates significant variability. The 1451 m diameter MOCR Crater is an exception to other craters in the valley in its much larger size and youngest relative age, as well as being located 6.3 km east of the deep drill core site. Another exception to other craters are four of the major craters in the Crater Cluster (Steno, Emory, Sputnik and Faust as green entries in Table 13.3a) in that they are elliptical in shape rather than circular. Each long axis of these four craters is oriented at a bearing of ~320° ± 5°. This comparable orientation of spatially and apparently temporally related elliptical craters suggests a nearly simultaneous oblique impact of a closely aggregated group of objects. A fifth elliptical crater, Hess, also in the Crater Cluster, is distinct from the other four in its long to short axis ratio and long axis bearing. Finally, two relatively young, circular craters in the Crater Cluster, Sherlock and Powell, may have formed simultaneously.
Using this combination of visual characteristics and diameter to depth ratios, both of which are subject to significant judgment, Column 1 of Table 13.3a contains source crater assignments to each zone as a function of increasing depth in the deep drill core. Although a comparison of these assignments with the petrographic data in Tables 13.1a and 13.1b and compositional modeling in §5 support the sequence indicated, the following caveats are in order:
-
-
-
- “Crater Cluster” in Table 13.3a, and subsequently in Table 13.4, is the name given to a grouping of 8 large craters and many associated small craters and a generally lumpy surface (Wolfe et al., 1981; QuickMap). Close examination of the relative ages of the large craters (Table 13.3a), however, indicates that Steno, Emory. Sputnik and Faust were formed by simultaneous, oblique impacts. These four craters are distinct from other craters in the Cluster in being elliptical with a consistent bearing of 320° ± 5° of the long axes.
- Post-impact shape distortions of Mackin, Henry, Sputnik, Lara, WC and SWP Craters make diameter to depth ratio determinations subject to significant judgment as to placement of the best diameter line in QuickMap. On the other hand, compositional correlations with deep drill core zones (see §5.0, Tables 13.6aa to 13.6kk) reinforce the judgments listed in Table 13.3a).
- The abundance of basaltic lithic clasts throughout the core (Table 13.1a, Column 7) further emphasizes the general absence of massif melt-breccia fragments that resemble boulders at Station 2, 6 and 7 at the base of the massifs and as rocks in avalanches from the South Massif.
- Lara Crater (~675 m in diameter) is not included in Table 13.3a since it is probably too far from the drill site (6.0 km) to contribute significant basaltic regolith ejecta. Lara Crater will be discussed separately, below.
-
-
Craters in the same size and relative age range as those on the valley floor are difficult to define on the North and South Massifs and in the Sculptured Hills; however, analysis of those elevated craters nearest the valley rim show that their distances from the deep drill core site would limit significant quantities of their ejecta from reaching the core site. Clear petrographic and compositional evidence of ejecta contributions from impacts directly on the massifs, is absent from the deep drill core, with the possible exception of zone V+V*, and will be discussed in §5.0.
Table 13.3b gives a summary evaluation of the apparent source craters for deep drill core zones by comparison of (1) evidence for relative ages in relation to the superposition of regolith zones in core (Table 13.1a); (2) petrographic evidence relative to general geology in source crater area (Tables 13.1a and 13.1b); and (3) thickness of zones relative to distance from rim to core site (Fig. 13.8, below).

3.4.1 Lara Crater as Possible Source Crater
Although Lara Crater’s rim is farther from the deep drill core site than other similarly sized craters (~6.0 km), (Fig. 13.6a), it is of the right diameter (~675 ± 30 m) to be considered as a possible source of one of the core’s relatively thin regolith zones. On the other hand, in addition to its distance from the core site being much greater than 2.6 km (see Fig. 13.8), determination of Lara’s relative age is made more difficult by being partially covered by the light mantle avalanche deposits discussed in §17. Lara also has been distorted, tilted, and moved ~500 m eastward by movement on the Lee-Lincoln thrust fault (Schmitt et al., 2017). These factors make an estimate of its relative age and its diameter to depth ratio problematic and the faulting transport increases its original rim distance from the drill site to ~6.5 km.
Lara’s current diameter to depth ratio is ~11.4 ± 1 (845/74, using N-S diameter). On the other hand, boulders observed on Lara’s walls, and scattered elsewhere nearby, that project through the light mantle deposit (Chapter 11), suggest a relative age comparable to or younger than Horatio (diameter to depth ratio = 9.95). For Lara to match that ratio for Horatio (Fig. 13.6b), the fill on its floor would need to be ~8 m thick to give an 82 m original depth. This is a reasonable thickness for such fill relative to comparable estimates for the combined thickness of two light mantle avalanche deposits that have over-ridden Lara (§17.2). In addition to an initial deposition of young and old light mantles, there was some backflow of young light mantle avalanche material into the crater (not included in the current depth estimates).
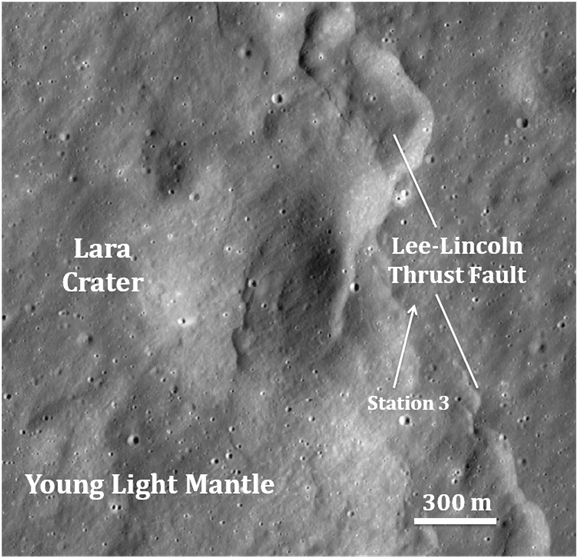 Fig. 13.6a. Lara Crater. (LROC Quick Map image).
 Fig. 13. 6b. Horatio and Camelot Craters (LROC Quick Map image).
3.4.2 Possible Source Craters on the Massifs
Craters >400 m diameter present on the tops of the North and South Massifs have diameter to depth ratios similar to those on the valley floor; however, such craters are too far away for their parabolic arches to reach the core site. The closest crest of the North Massif, for example, is 6.5 km from the drill site (QuickMap). Fig. 13.7 indicates that a 45º intersection of the leading portion of a crest crater’s parabolic arch with a point level with the crest would be ~2.6 km from the hypothetical crater rim. Although the massif crest is ~1.6 km above the valley floor, this extra ejecta flight time still would be insufficient to reach the drill site lying 6.5 km from the crest even if its flight maintained an optimum 45º trajectory as illustrated graphically in Fig. 13.7.
 Fig. 13.7. Graphical analysis of the possibility of a >400 m diameter crater at the crest of the North Massif (1.6 km higher than the valley floor) contributing regolith ejecta to the deep drill core site lying 6.5 km from the crater rim.
Fig 13.7 shows the parabolic arch from the crest of the North Massif, with the optimum 45º launch-angle replicated as the impact angle. An 1.6 km altitude advantage would miss reaching the core site by ~2.3 km if a 45º impact angle for an 1.6 km altitude were maintained, which, of course, is greater than gravitational physics would allow.
Craters on the slopes of the North Massif that might have contributed significant regolith ejecta to the core have not been identified nor is there petrographic evidence that this occurred (Taylor et al., 1979) beyond the contributions of down-slope mass wasting (§5.0, zones U, V+V*, W and Y+Y*). It would appear that southwestward moving regolith ejecta from those craters visible on the top of North Massif largely impacted the southwestern facing slope of the Massif. This would have contributed to the mass wasting from that slope (such as noted for WC Crater), but not significantly to the regolith accumulating on the valley floor. (The base of the slope is >4.5 km horizontally from >400 m diameter massif craters nearest the crest (QuickMap measurements)).
The same arguments related to the North Massif would apply to craters on the even more distant South Massif. Petrographic and compositional characteristics of zones U (Steno Crater, etc.), W (Hess Crater) and Y (Makin Crater) (§5), however, indicate that their regolith ejecta include material from one or more South Massif slope avalanches (§17.0).
3.4.3 Reach of Each Source Crater’s Regolith Ejecta
The regolith ejecta sheath hypothesis postulates that a hypervelocity impact creates a conical ejecta wedge that evolves into a 360º parabolic arch, with ejecta deposition beginning at the tail of the wedge as it leaves the rim of the now-formed crater. This hypothesis implies that the distribution of mass in the wedge-arch combination at any given time and distance of deposition can be projected onto a roughly circular plane centered at the source crater. The thickness of regolith ejecta deposits forming at the moving tail of the wedge and arch at any given distance from the crater rim would be a function of the initial velocity and mass distribution of ejecta within the wedge-arch and the rate of decrease in its density as outward expansion continued. If, as hypothesized here, regolith ejecta from various 400-800 m diameter craters make up the regolith zones in the deep drill core (except that of zone S), the thickness of those zones should vary systematically with distance from their source crater rim.
From these relationships, it may be possible to empirically determine the approximate distance at which maximum deposition thickness of each source crater’s regolith wedge-arch occurs. Table 13.4a gives the following data:
-
-
-
-
- Thicknesses of the regolith ejecta zones in the deep drill core,
- Potential source crater diameter,
- Distance from the core to the rim of potential source craters (rim chosen because that is where deposition begins).
- Estimated excavated regolith volume from the potential source crater from Table 13.17, §8.0.
-
-
-
The volume of ejected regolith was initially thought to be that of an approximate cylinder with a thickness of all the regolith present above bedrock, with an assumption that regolith depth averaged ~10 m. Considerations in §8.0, however, indicated that the actual depth of ejected regolith could be estimated in relation to cosmic ray exposure ages reported for the deep drill core zones as compared to the accumulated exposure age per meter in the deep drill core (37.5 Myr per m). The reader is referred to that Section for these estimates.
Table 13.4a footnotes:
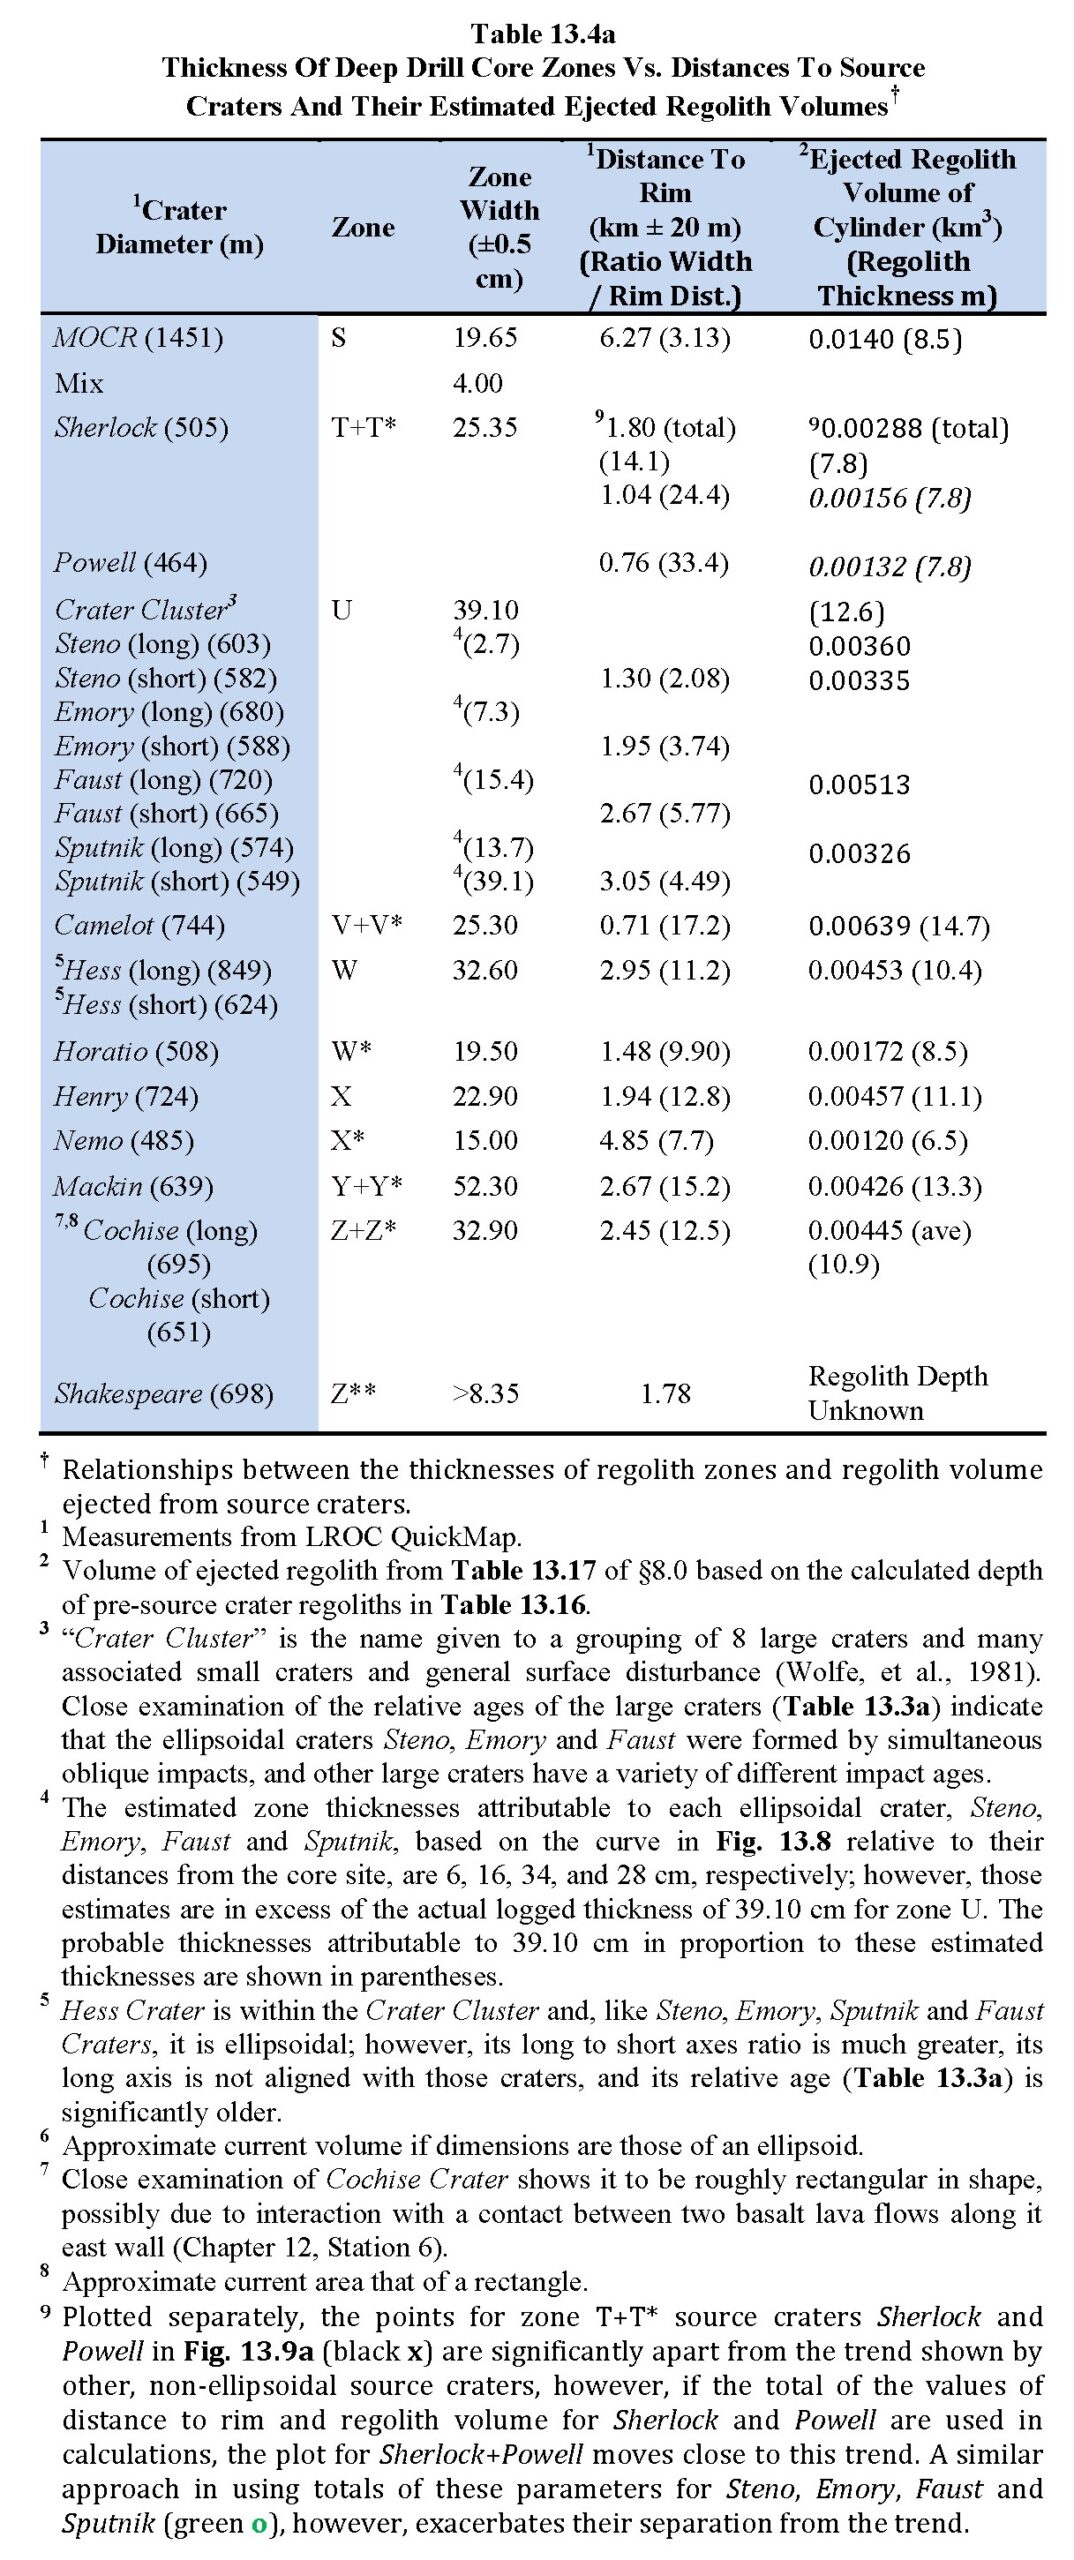
For target materials of the same density, total excavated volume is representative of the total impact energy delivered to the crater site, both kinetic and potential. In attempting to relate deep drill core zone thickness to the release of impact energy, zone thickness (width) is plotted against distance from source crater rims to the core site gives relationships as shown in Fig. 13.8. The plot suggests that maximum deposition occurs at a distance of about 2.6 km from the source crater rim. In Fig. 13.8, there also is a strong hint of two different non-linear distributions of thickness as a function of distance, approximated by dashed line segments. One trend (red) appears to relate to source craters closer than 2.6 km with large zone thicknesses. The other trend (black) relates to source craters closer than 2.6 km but with relatively small thicknesses. The statistical support for these differences is not great, however.
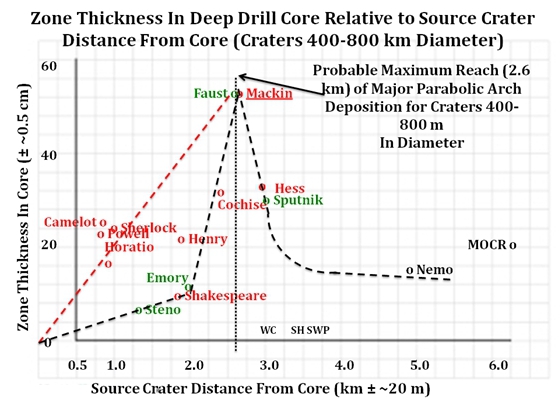 Fig. 13.8. Relationship between the thicknesses of zones of regolith ejecta deposited at the deep drill core site and the distance to the rim of probable source craters. The “distance from core” points for simultaneously formed elliptical craters in the Crater Cluster (Steno, Emory, Faust and Sputnik) are shown in green with their positions a projection from their crater distances to the black dashed curve (see text).
Relationships comparable to those in Fig. 13.8 would be expected if the 360° sheath of ejected regolith follows a parabolic trajectory from which deposition of increasingly energetic particles occurs continuously at the trailing end of the sheath but with the greatest concentration of particles being from the portion of the parabola with the greatest total energy.
As their ellipsoidal shapes, long axis orientations, and diameter/depth ratios indicate that craters Steno, Emory, Faust and Sputnik (green points in Fig. 13.8) formed simultaneously, their contributed thicknesses to the 39.10 cm of zone U would vary relative to their distances from the core site. Projecting source crater rim distance to the dashed trends in Fig. 13.8, the total thickness such a projection predicts for zone U would be, respectively, 6+16+34+28 cm = 84 cm. It is hard to see how the dashed curves could be moved downward enough to significantly lower these estimates, as the curves are based on objective measurements of zone thickness and crater rim distance. It is more likely that interaction of the simultaneously formed ejecta sheaths resulted in less regolith mass reaching the core site than otherwise would be predicted from the trends in Fig. 13.8. Alternatively, an asymmetric concentration of ejected regolith from an oblique impact may have resulted in lesser deposition at the core site. Weighing the excessive predictive thicknesses for Steno, Emory, Faust and Sputnik, however, against an actual zone U thickness of 39.10 cm gives approximately 2.7, 7.3, 15.4 and 13.7 cm, respectively, as the four predicted contributions to zone U’s logged thickness.
Fig. 13.9a is a graphical plot of zone width normalized to distance from its source crater rim (km) vs. estimated ejected regolith volume (Table 13.4a). Some observations related to Fig. 13.9a are as follows:
-
-
- The points plotted for most craters appear to define a trend (red) indicating that zone thickness has a relationship to source regolith ejected volume.
- The intersection of the red trend at the zone thickness-rim distance ratio axis may indicate that as ejected volume approaches zero that ratio approaches a value of ~6. This would imply that 0.1 m away from the rim of a small volume crater the ejecta thickness would be ~0.6 cm, giving some perspective on the nature of the micro-meteor near-surface regolith gardening process.
- The improved correlation of zone T+T*’s source craters, Sherlock and Powell, with the red trend through the use of the total rim distance and total regolith volume lends support for the hypothesis that Sherlock and Powell were simultaneous impacts.
- The close grouping of green points representing the 4 four source craters for zone U would be expected for simultaneous impacts clustered together in one area with corresponding interference between ejecta sheaths.
- The clustering of the green points representing the four source craters for zone U well below the red trend line suggests that the thickness of zone U of 39.10 cm is not the maximum hypothetical zone thickness that could have resulted from those four impacts, and and further suggests ejecta sheath interferences or, alternatively, asymmetric deposition with thicker regolith being deposited further downrange.
-
 Fig. 13.9a. Plot of deep drill core zone thickness normalized for source crater rim distance against ejected regolith volume based on source regolith thickness calculated in §8.0.
Fig. 13.9b is a graphical plot of zone width / km vs. estimated initial crater volume (Table 13.4b), a rough surrogate for total energy of the impactor. The ejected total volume calculation assumes that the initial excavated volume was that of a half sphere with its depth equal to the crater radius. In the case of the ellipsoid craters, the initial depth was assumed to be the same as half the short axis. These first approximations of radius and depth are greater to some limited degree than the current radius and depth, of course, as crater diameters increase and crater depths decrease with age.
Table 13.4b footnotes:

 Fig. 13.9b. Relationship between deep drill core zone thickness (width / km) and the estimated initial source crater volume (Table 13.4b), assuming that the radius of the half sphere, or short axis in the case of ellipsoidal craters, approximates the source crater’s initial depth.
Fig. 13.9b indicates the following:
-
-
- As in the case of the plot for regolith volume ( 13.4a), the points plotted for craters (red o), other than the ellipsoidal source craters for zone U (green o), most craters appear to define a trend (red) indicating that zone thickness has a relationship to ejected volume.
- Also, as in the case of the plot for regolith volume ( 13.4a), the intersection of the red trend at the zone thickness-rim distance ratio axis may indicate that as ejected volume approaches zero that ratio approaches a value of ~6.
- The improved correlation of zone T+T*’s source craters, Sherlock and Powell, with the red trend through the use of the total rim distance and total volume lends (Table 13.4b) support for the hypothesis that Sherlock and Powell were simultaneous impacts.
- As in 13.9a, the close grouping of green points representing the 4 four source craters for zone U would be expected for simultaneous impacts clustered together in one area with corresponding interference between ejecta sheaths.
- The clustering of the green points representing the four source craters for zone U well below the red trend line, as in 13.9a, suggests that the thickness of zone U of 39.10 cm is not the maximum hypothetical zone thickness that could have resulted from those four impacts, and further suggests ejecta sheath interferences or, alternatively, asymmetric deposition with thicker regolith being deposited further downrange.
- The relatively close association of source crater points along a similar trend line in both 13.9a and Fig. 13.9b gives strong support for the correlations of source craters with deep drill core regolith ejecta zones (Table 13.3a).
-
In Fig. 13.8 and Figs. 13.9a and 13.9b, points for MOCR Crater are, of course, obvious outliers because of that much larger crater’s greater formational energy than those in the 400-800 m range.
There are many possibilities for error in the correlation of deep drill zones with specific source craters; however, support for the assignments comes from the close correlations shown in Fig. 13.9a and Fig. 13.9b, helping to confirm the support found in petrographic and compositional details, discussed in §5.0. The plots in these figures and in Fig. 13.8 indicate that the primary controls on zone thickness are distance from the source crater, combined with the source crater’s total formational energy and the thickness of regolith at the pre-source crater impact location. The distinct plots for regolith volume (Fig. 13.9a) versus crater volume (Fig. 13.9b) further support the separation of kinetic energy and potential energy in the physics of impact excavation. This separation also sets limits on the extrapolation of data from explosions craters to impact craters, constringing explosions to be equivalent to the release of potential energy but not the release of initial kinetic energy.
3.4.4 Summary
In summary, if the parabolic arch hypothesis for a 360° ejecta sheath from any given source crater is correct, Fig. 13.8 suggests that the probable limit of significant deposition from such arches would be about 2.6 km from the rim of that crater. Further, there is a strong implication in the data as plotted in Fig. 13.8 that, for craters in the 400-800 m diameter range and up to about 2.6 km from the deep drill core site, the thicknesses of the regolith ejecta zones are primarily functions of the kinetic energy of the source crater impactor as well as the portion of the parabolic arch that finally hits the surface. In that scenario, the thick regolith ejecta zones for Cochise (zone Z+Z*), Hess (zone W), Mackin (zone Y+Y*), and possibly Faust may represent deposition of regolith ejecta contained in densely concentrated portions of its parabolic arches, that is, the velocity and volume of regolith ejected is greatest just after initial impact and, possibly counter-intuitively, less dependent on the total kinetic+potential energy finally released.
Other factors besides kinetic energy and distance potentially come into play with any given impact. These factors include actual thickness and density of source regolith and angle of impact; however, these may have been a positive or negative factor at Taurus-Littrow only for the four related elliptical craters in the Crater Cluster as well as Mackin and Hess that impacted regolith thickened by one or more South Massif avalanches.
Another way of viewing the plots in Fig. 13.8 is that regolith ejecta mass is largely concentrated in the leading volume of the conical wedge and the parabolic arch as they form, and this mass is deposited near the end of the arch’s ballistic trajectory. It appears that 2.6 km constitutes the lunar ballistic limit for the largest volumes of regolith ejected from craters in the 400-800 m diameter size range. The steep drop in delivered regolith thickness documented for Hess Crater (zone W) in Fig. 13.8 supports this conclusion, although a small volume of high velocity ejecta from near the exact point of impact almost certainly goes much greater distances and additional small volumes of lower velocity ejecta are spread between the source crater rim and ~2.6 km from that rim. Clearly, more data from deep drill cores at other locations, selected to maximize the number of potential source craters, are needed before this apparent ballistic limit can be more precisely defined as a function of source crater size and its distance to a deposition site. The ballistic limit for large terrestrial impacts might be determined by consideration of tektite strewn fields, and then used to identify candidate source craters not yet identified.
4.0 Process Sequence That Forms Inter-Crater Regolith
4.1 Introduction
Fig. 13.1c and the log of detailed maturity data from the Apollo 17 deep drill core in half-cm steps from which Fig. 13.1c was derived (Morris et al., 1979; pers. comm.) indicate that major impact events that result in regolith ejecta deposition broadly surrounding the resulting crater are the primary initial contributors to the three-dimensional structure and composition of inter-crater regolith at Taurus-Littrow and other lunar locations. Once deposited as a regolith zone, impact gardening and external and internal radiation act as agents of continuous maturation until the zone is buried by new regolith ejecta.
The maturity parameter Is/FeO, developed by Morris (1976), is based on the ferromagnetic response of nano-phase iron particles (np°Fe) produced by the alpha+beta and proton reduction of increasing amounts of structural Fe++ to Fe°. Dissolved Fe++ in volcanic glass and glass-rich agglutinates is protected from both alpha+beta and proton radiation as a consequence of the dissemination of those ions and their shielding from radiation by surrounding glass.
Throughout regolith that is continuously gardened by impacts, alpha+beta particle radiation of Fe++-bearing minerals produces a steadily increasing contribution to the value for Is/FeO within 20-30 µ of disseminated uranium and thorium radiation sources (Schmitt, 2022; §6.3.2). Once gardening ceases after burial, however, this form of maturation rapidly dies off as local Fe++ ions are consumed. At the surface, solar proton radiation also increases Is/FeO values on exposed crystalline particles (§6.3.3). This exposed surface material is gradually incorporated into deeper units through the impact gardening process.
Close to points of macro- and micro-meteor impacts, nano-phase iron particles have their ferromagnetic properties disturbed by shock and/or heat so that local Is/FeO values are partially reset to lower values (§4.2). These partial resets do not appear to extend beyond the reach of actual regolith excavation and crater wall deformation, based on evidence of such resets in (1) ancient light gray regolith at the rim of Shorty Crater (74240, 74260); (2) regolith breccia sample 79115 and regolith breccias from other Apollo missions; and (3) a sample (73131) from the wall of a small fresh impact crater in mature light mantle regolith discussed further below in §17.0. The extent of “Is” reset by large source craters will be further examined later in §6.4.2.
The general sequence of inter-crater regolith formation, such as that surrounding the Apollo 17 deep drill core, has been illuminated in this synthesis by detailed logging of the Is/FeO profile in the deep drill core (every half-centimeter) and by logical consideration of the constant micro- and small macro-meteor rain of gardening impacts. That sequence of inter-crater regolith development at the deep drill core site was as follows:
-
-
-
-
- Regolith ejecta from 10 large, 400-800 m diameter source craters, and one ~1400 m diameter source crater (MOCR), are deposited as layers up to 50 cm thick that sequentially cover hundreds of square meters around the core site. A given layer is contiguous with a circumferential blanket of comparable regolith ejecta surrounding its source crater that reaches maximum thickness at a distance of ~2.6 km from the rim of the crater (Fig. 13.8). Bedrock-related ejecta is confined to an irregular blanket comprised largely of brecciated bedrock that extends an average of about one crater diameter from the rim of the source crater.
- It appears that the initial kinetic energy of the impactor creates the far-reaching sheath of regolith ejecta, whereas, its potential energy is largely responsible for excavation of bedrock and overlying rubble and deposited within about one crater diameter from the crater rim.
- Prior to regolith ejecta deposition, small differences in the velocity and trajectories of individual particles, along with volatiles released due to agitation, create ballistic and volatile turbulence within the parabolic regolith ejecta sheath that emanates from a source crater.
- Turbulence partially integrates Is/FeO values, cosmic ray exposure ages, and compositional parameters of the finest fractions (>70 wt-%; Graf, 1993) of pre-existing regolith zones.
- Micro- and small macro-meteor impacts with an exponential size-frequency distribution increasing toward smaller sizes (Shoemaker et al. (1967); Graf, 1993) begin to modify and garden newly deposited regolith ejecta.
- Regolith at and near the point of small impacts is subjected to partial resets of their Is/FeO values due to local intense shock or heat or both.
- Nearby small impacts capable of depositing regolith at the core site but still are the most distant from the site contribute the most significant Is/FeO reset values, as that most distal regolith has received the greatest shock and energy input from impact. The amount of detectable individual resets varies from ~2% to ~20% for mature regolith, up to ~30% for immature regolith (§4.2) , and to over 90% for regolith subject to large impacts(§§6.4.2, 11.2).
- Complementarily, ejected regolith that has the Is/FeO value of the local regolith may or may not be apparent in the raw data.
- As small impacts garden the continually reforming regolith surface, radiation from solar protons on exposed surfaces and U+Th alpha+beta radiation throughout the bulk regolith continue to reduce structural Fe++ to nano-phase iron (np°Fe), thus increase post-reset Is/FeO. In varying time spans, this maturation counters, partially counters, or exceeds the effect of impact-related resets, but continues to give an increasing measure of the increase in Is/FeO (∆Is/FeO) with surface exposure.
- The work of Burgess and Stroud (2018) on solar proton radiation effects on surfaces of exposed ilmenite, chromite, and glass particles confirm solar proton maturation; however, that research did not include consideration of the formation of nano-phase iron related to alpha particle radiation reported by Bower et al. (2016) in terrestrial biotite.
- The rising Is/FeO values produced by nano-phase iron production appears in Morris’s raw data (pers. comm.) from the deep drill core as gradual increases in Is/FeO values over 1-3 cm that peak at a point where a rapid decrease in those values occurs due to a reset. This process forms the repeated Is/FeO saw tooth peaks, cliffs and valleys that are so apparent in Fig. 13.1c, particularly in deep drill core zones S, V and W.
- Surprisingly, Is/FeO decreases and increases in extended saw tooth patterns are roughly equal in most regolith ejecta zones. Exceptions to this pattern provide information on temporal variations in the impact environment affecting the regolith (see discussion of zone U in §5.0).
- Each original regolith ejecta zone is ultimately gardened by craters with diameters up to ~5 times (Pike, 1974) the thickness of a given zone, until another source crater impact delivers a new regolith ejecta zone of a distinct initial Is/FeO (Is/FeOm) that buries the earlier zone.
- Given enough time, an impact that penetrates the entire regolith ejecta zone may reach into the top of the immediately underlying regolith ejecta zone with that zone’s regolith being integrated into the zone that buried it. An anomalous pattern at a contact with an earlier regolith ejecta zone would indicate that gardening had crossed into that underlying zone, but no such anomaly has been noted in the deep drill core core raw data.
- Lack of a pronounced saw tooth pattern in a relatively thick zone, e.g, zone U (~40 cm thick), would show that the general process outlined above was interrupted by another temporary process. In the case of zone U, a period of small macro- and micro-meteor impacts of higher energy than normal may have resulted in the steady, reset-driven decline in Is/FeO values for that zone (see Fig. 13.1c).
- Regolith ejecta from 10 large, 400-800 m diameter source craters, and one ~1400 m diameter source crater (MOCR), are deposited as layers up to 50 cm thick that sequentially cover hundreds of square meters around the core site. A given layer is contiguous with a circumferential blanket of comparable regolith ejecta surrounding its source crater that reaches maximum thickness at a distance of ~2.6 km from the rim of the crater (Fig. 13.8). Bedrock-related ejecta is confined to an irregular blanket comprised largely of brecciated bedrock that extends an average of about one crater diameter from the rim of the source crater.
-
-
-
4.2 Impact Shock Partial Resets of Is/FeO Values
In the course of this synthesis, as noted above, several lines of evidence came to light indicating that very locally, impact shock, and potentially heat, partially resets the ferromagnetic basis for the determination of the “Is” component of Is/FeO values developed by Morris (1976). The evidence for this phenomenon is as follows:
-
-
- The Is/FeO values of 5 and 5.1 for light gray regolith samples 74241 and 74261, respectively, obtained at the rim of Shorty Crater, are inconsistent (§11.2) with the cosmic ray exposure ages reported for 74241 that range from 150 to 320 Myr (Table 13.5) with large error limit.
- A sample of the regolith, 73231, taken from the wall of a small, very fresh impact crater on the young light mantle has an Is/FeO = 16 that is inconsistent with Is/FeOs = 88 for skim sample 74121 as well as Is/FeOm = 48 for bottom trench sample 73141 from ~15 cm depth (§17.4).
- Deep drill core zone deposition Is/FeOs (Is/FeOm) are up to 93% lower than they were in the pre-source crater regolith, as indicated by cosmic ray exposure ages on those regoliths (§8.0, Table 13.16).
- The Is/FeOs of impact-lithified regolith breccia samples from Apollo 15 and 16 (Table 13.6) are consistently much lower than bulk regolith samples from those missions (McKay et al., 1986, 1989).
- The probable role that impact heating, in addition to shock, plays in resetting Is/FeO to low and very low values relative to bulk regolith is indicated by Apollo regolith breccia samples (Morris in McKay et al., 1986, 1989; Morris, 1976) that have petrographic and/or image evidence (Meyer, 2012) of adhering impact glass or a glass matrix (Table 13.6).
-
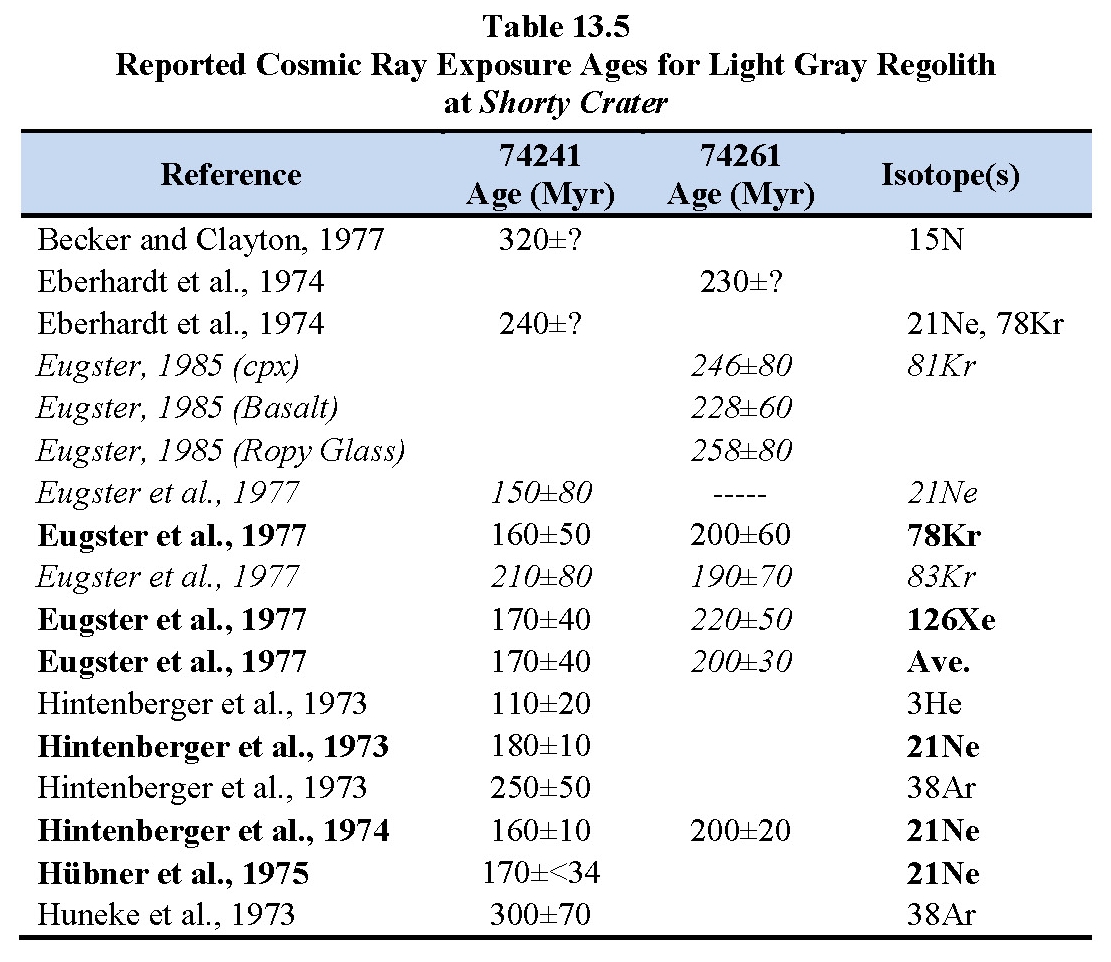

The effects of partial resetting of Is/FeO values by impacts are superposed at the half-cm scale on the overall maturity of regolith ejecta zones of the deep drill core shown in Figs. 13.1c and 13.1d. These effects, and the subsequent increases in Is/FeO, create the saw tooth patterns in Fig. 13.1c. These patterns are reflected in the raw data (Morris, pers. comm.) from which Fig. 13.1c was created. The general pattern, identified in half-cm logging, is one of a sharp decrease of about 2-10 Is/FeO points followed by multiple increases in Is/FeO values in the overlying 1-3 cm. The increase in Is/FeO may or may not exceed the amount of the reset. This pattern is interpreted here as the result of gardening ejecta from nearby small impacts that contain resets being spread over the core’s location. This exposed reset regolith then continues normal proton and alpha+beta particle maturation until the arrival of the next spray of reset ejecta.
4.3 Summary of Detailed Is/FeO Log of Apollo 17 Deep Drill Core
Morris et al. (1979) recorded the maturity index, Is/FeO, for every half-cm of the Apollo 17 Deep Drill Core, summarizing their findings with the graph shown in Fig. 13.1c. An example of the author’s detailed log of the raw data (Morris, pers. comm.) underpinning Fig. 13.1c‘s graphical representation is shown in Fig. 13.1d. The half-cm log reveals a systematic sequence of sharp resets of Is/FeO values in less than the measurement thickness of half a centimeter, followed by more gradual increases in those values over ~0.5-3 cm along the core. A summary of the Is/FeO log is given in Table 13.7. The major findings illustrated by Table 13.7 and other data can be summarized as follows:
- Due to frequent resets and recoveries, the integrated original Is/FeOm of a regolith ejecta zone after deposition (Column 3) can only be approximated, probably ± 5 Is/FeO points, by consideration of Is/FeO values near the base of a given zone.
- Is/FeO resets per centimeter (Column 6) is roughly constant at 0.510 ± ~1 except for zones T+T* and V+V* (italics in Table 13.7).
- Zone T+T* probably is anomalous due to their very low initial Is/FeOm values of ~10, thus limiting the amount of individual resets that can be resolved by the Is/FeO technique at a half-cm interval. This issue is addressed further below.
- Zone V+V* probably is anomalous due to its small data set (4 resets over 11.8 cm).
- The apparent 8 point Is/FeO reset at the top of zone S does not appear to be the introduction of a new regolith ejecta deposit. This portion of the core also has been disturbed by compaction. Unlike the sharpness of other zone boundaries, the upper 4 Is/FeO data points are spread across 2.65 cm.
- The bulk chemistry for the control sample 70181 for the deep drill core shows no significant differences from the bulk chemistry of core sample 70009 at 1, 9 or 20 cm depths (§5.2, Table 13.8a, below).
- The difference in U+Th content of the control sample 70181 (1.380 ppm; Silver (1974)) for the deep drill core and 70009 at 1.18 ppm at ~1 cm depth appears to be only in the uranium measurement, as the thorium amounts of 0.95 ppm at 1 cm and 0.94 ppm at 20 cm (Meyer (2012)) are close to the 1.049 ppm Th measured for 70181 by Silver.
- Total decrease in Is/FeO resets for the core (1227) exceeds total maturation increase (1138) by only 89 points (7.3%), suggesting a rough balance between the effect of resets and that of nano-phase iron production after zone deposition. Why, other than coincidence, such a rough balance would exist over about one billion years of core accumulation (§6.0) is not obvious, particularly as the total ∆Is/FeO varies greatly between zones.
- Other data discussed below indicate that overall regolith maturity in the long term is more a function of alpha+beta particle flux than solar proton flux (§6.0). Although mixed downward by impact gardening over time, the effect of proton maturation initially only affects particles exposed at a post-reset surface rather than continuously throughout the entire zone.
- Zone U is the major intra-zone exception to the reset-∆Is/FeO balance, as it shows a continuous decline in Is/FeO in Fig. 13.1c as well as in the half-cm log spite of a relatively normal value for resets per centimeter of 0.455. These data suggest that reset impacts affecting zone U were of abnormally high kinetic energy, possibly due to the periodic passage of the Moon through the tail of a long period comet (Long period comet terrestrial impact velocities are as high as 67 km/sec (Hughes and Williams, 2000) while asteroids impact velocities are around 17 km/sec (Koeberl and Sharpton, 2024). Lunar impact velocities would be less, of course, however the relative difference would remain significant.)
Table 13.7 footnotes:

Within this general background, there are rare anomalous patterns, as follows:
-
-
-
- Steady decrease in Is/FeO over >2 measurement intervals (Maybe there were multiple ejecta depositions with relatively little time in between or there was core penetration of a buried crater wall or ejecta blanket).
- Steady increase in ∆Is/FeO over >2 measurement intervals (Maybe a period with no ejecta deposition).
- Oscillation between (1) and (2), i.e., from steady decrease in Is/FeO over >2 measurement intervals to steady increase in ∆Is/FeO over >2 measurement intervals (Maybe that impact activity was inside the resolution of the data).
- Sharp decrease in Is/FeO that is greater than normal pattern (Maybe that ejecta in core is from point of impact where reset of Is/FeO is greatest).
- Sharp increase in ∆Is/FeO that is greater than normal pattern (Maybe that ejecta is mature regolith where reset of Is/FeO is least and is from a significant distance away from point of impact).
- No decrease in Is/FeO over >2 measurement intervals (Maybe there were no nearby impacts).
- No increase in ∆Is/FeO or decrease in Is/FeO over >2 measurement intervals (Maybe that deposited regolith has same Is/FeO as preceding redeposit).
- A few apparent impact resets extended upward for up to six, half cm intervals These extended resets may represent where the core penetrated the sloping wall of a small gardening impact crater. In these few instances, the core interval is overturned and records that the level of reset increased downwards in the parent crater, as would be expected relative to the three-dimensional distribution of levels of shock in the final crater wall, that is, shock was greatest at the base of the crater wall.
-
Zone U constitutes an exception to the general pattern of a sharp decrease in Is/FeO and a variable increase ∆Is/FeO before another sharp decrease. For zone U, the increase that follows a reset is usually less than the preceding reset decrease, resulting in a continuous decrease in zone U’s total maturity index (Fig. 13.1c). As zone U’s frequency of resetting impacts as a function of depth appears consistent with most other zones (Table 13.6, Column 6), this zonal-wide change in pattern suggests that the average energy of resetting impacts increased at the time of the deposition of zone U regolith ejecta, with the increase in impact energy dying out within the overlying zone T+T*. As discussed previously, the source of zone U regolith ejecta appears to be four hemispherical craters (Steno. Emory, Faust and Sputnik) in the Crater Cluster, and these craters may be the result of a cometary aggregate’s impacts. The zone U pattern may be the consequent of periodic passage through a cometary tail of debris. The discussion for zone U in §5.0 examines the compositional evidence for such a possibility.
5.0 Petrography and Composition of Deep Drill Core Regolith Zones
5.1 Introduction
Tables 13.1a and 13.1b include summaries of the variations in stratigraphic parameters for the Apollo 17 deep drill core zones initially defined by an estimation of significant positive or negative changes in Is/FeOm minima from Fig. 13.1c and then verified both in the raw Is/FeO data supplied by Morris (pers. comm.) and by correlation with other variables. Differences in detailed petrography of each of the identified deep drill core regolith zones (Table 13.1a, Column 6) generally correspond with the definition of zones based on Is/FeO data. Of particular usefulness in correlating petrography with maturity indices has been the work of Taylor et al. (1979) whose summary graphs are reproduced in Figs. 13.3a, 13.10a and 13.10b. Numerous chemical analyses for specific depths reported by Laul et al., (1974, 1978; 1981) and by Meyer (2012) provide additional stratigraphic data that support the indicated definition of deep drill core zones and the identification of their source craters and the geological context of the latter’s local regolith.
 Fig. 13.10a. Graph of percentage variations in basalt lithic clasts as measured by modal analysis (microscope point counting of particle types) of 171 thin sections from the deep drill core (Taylor et al., 1979). See also Fig. 13.3a for agglutinate variations and Fig. 13.10b for black (+orange) glass (volcanic ash) variations.
 Fig. 13.10b. Graph of percentage variations in black (+orange) glass (volcanic ash) as measured by modal analysis of 171 thin sections from the deep drill core (Taylor et al., 1979). See also Fig. 13.3a for agglutinate variations and Fig. 13.10a for mare basalt clast variations..
5.2 Compositional Modeling of Source Regolith for Deep Drill Core Regolith Ejecta Zones
Laul et al.’s (1978, 1979, 1981) regolith ejecta zone analyses are a remarkable resource in understanding the nature and derivation of the deep drill core’s regolith ejecta zones. In modeling their data to verify likely zone source craters, the mix of various regolith sample chemical components employed are: (1) Station 1 high TiO2 and low U+Th regolith (71501) derived largely from ilmenite basalt (Rhodes et al., 1974); (2) South Massif high SiO2 and U+Th and low TiO2 regolith (73121) (Laul et al., 1981); (3) North Massif moderate SiO2 and low U+Th, and TiO regolith (76501); and (4) Sculptured Hills moderate SiO2, U+Th and TiO2 regolith (78501) and (78421) (Rhodes et al., 1974). In addition, it was found that an added 5-30% of orange+black ash (74220) (Rhodes et al., 1974) and/or VLT (very low titanium) ash bead from 70007 (Vaniman and Papike, 1977) compositions to several of the modeling mixes was required to approach a reasonable match with Laul et al.’s zone analyses. Uranium and thorium analyses of model components are largely those of Silver (1974) or Laul et al. (1978, 1979, 1981) and Meyer (2012) and including Eldridge et al. (1974) for 71501. In most cases, iterative modeling of mixes of these sample compositions came within 0.5 wt % of Laul et al.’s zone analyses or their average. Exceptions are noted in the zone specific discussions.
As indicated in the mixing proportions given in many modeling tables of this section, there is a strong suggestion that significant orange+black ash (74220) as well as a VLT ash (bead in 70007) (compositionally similar to VLT scoria 78526) are present in most regolith zones; however, it is not clear why their compositional contributions are not contained within the other component regoliths unless, due to their very fine grain size, they were not included in Laul et al.’s analyses of the 20-90 µ (nm) size fractions. Ash might be expected to be lost from the <20 µ size fraction where the 20-90 µ is taken to represent bulk composition (see Graf, 1973). On the other hand, there is otherwise no significant difference between the reported 20-90 µ and bulk compositions (Laul et al., 1978; 1979; 1980a), suggesting that the 20-90 µ fraction and bulk compositions are nearly the same. Indeed, the addition of VLT ash to the models appears to be necessary even when only a bulk analysis is reported.
The answer to this puzzle may be that loss of very fine ash in the course of curation and/or sample preparation for analysis, that included sieving, did not affect the accuracy of the analyses. Laul et al. (1978), for example, estimate that “material loss in sieving operations was typically 10%, largely from the <20 µm fraction.” As ash like 74220 and 74001/2 erupted on the Moon is concentrated in the small size fractions (Graf, 1993), this reported material loss may indicate that the actual ash content of the regolith ejecta zones as well as the ash content of the samples contributing to the models are higher than that required by the composition models.
1. Zone S: –1.30 – 19.35 cm (19.65 cm) (MOCR Crater): The major element composition (Table 13.8a) reported for the deep drill control sample 70181 from the top 0-5 cm of the nearby surface (Rhodes et al., 1974) closely matches that for this zone at its intervals of 0.6-1.1, 9.1-9.6 and 20.1-20.6 cm (Laul et al., 1978). Further, the graphs in Figs. 13.2, 13.3a and 13.11 show increases in agglutinates and track maturity and decreases in lithic basaltic clasts, respectively, at about 10 cm depth (Taylor et al., 1979). These changes suggest a significant addition of regolith ejecta from a larger than average nearby impact.
MOCR Crater is 1451 m in diameter and lies in the central portion of the eastern region of the floor of the valley of Taurus-Littrow, its near rim about 6.3 km from the core site. It is the largest as well as the youngest large impact crater on the floor of the valley (Table 13.3a). As it is the youngest large crater and zone S is the youngest regolith ejecta zone, MOCR is its most likely source crater. MOCR Crater was formed by an impact many times more energetic than other source craters (as indicated by total excavated volume (Table 13.4b), so its parabolic arch of ejected regolith would have reached significantly beyond the 2.6 km estimated in Fig. 13.8 for 400-800 m diameter source craters. Just the kinetic energy present to eject the mass of thick regolith from MOCR Crater (0.01 km3; Table 13.4a) was ~10 times more than that of other source crater impacts (Table 13.4a). The formational energy of MOCR Crater places it in a much higher energy level than other source craters in Taurus-Littrow.
Relative to the composition of zone S (Table 13.8a), the South Massif and North Massif regolith samples 73121 and 76501, respectively, clearly do not indicate compositional similarities with many of the oxide components in zone S; however, the mix of 50% 71501 ilmenite basalt regolith, 30% 78501 Sculptured Hills regolith, and 20% 74220 orange+black ash (Table 13.8aa) matches the average of three analyses and of control sample 70181 within a half a percentage point. This match is consistent with MOCR Crater’s location ~2.6 km south of the base of Sculptured Hills (Fig. 13.5, QuickMap) where older source craters for MOCR pre-impact regolith are located. These correlations of bulk chemistry allow zone S to be a surrogate for the general, inter-crater regolith of the eastern Taurus-Littrow valley floor and support the interpretation that MOCR Crater, 6.3 km from the core site, is the source of zone S’s regolith ejecta.
[As a side note, the lack of a need to include VLT ash in the model for zone S, suggests that the pyroclastic fissures identified by Schmitt et al. (2017) in the Sculptured Hills to the north of MOCR Crater, are vents for orange+black ash. If true, this possibility would support the conclusion that orange+black ash eruptions largely came from fractures outside the valley floor which had been sealed off by lava eruptions just prior to the initiation of pyroclastic activity.]


[Note: The 4 cm long, deep drill core interval between 18.35 and 22.35 has been interpreted here as a thicker than normal zone of mixing due to the high energy of the impacting regolith ejecta coming from the 1451 m diameter MOCR Crater.]
2. Zone T+T* 22.35-47.05 cm (25.70 cm) (Sherlock and Powell Craters): The very low maturity (Morris et al., 1979) (Fig. 13.1c), very low agglutinate (<10%) (Fig. 13.3a), and high basalt fragment and orange+black ash content (Taylor et al., 1979) (see Figs. 13.2 and 13.11) uniquely distinguish zone T+T* from all other zones in the deep drill core and add strong support for the approach used in this synthesis to define other zones in the deep drill core. Table 13.8b gives the reported chemical composition in comparison with the rake sample 71501 from Station 1 on the ejecta blanket of Steno Crater within the Crater Cluster area. Nothing in Table 13.8b stands out that would negate correlation with the Crater Cluster regolith, post-Steno, –Emory, –Faust, and –Sputnik impacts, although some mixing between zones T+T* and U may have reduced the zone’s TiO2 content at its base. On the other hand, the analysis of the 90-20 µ size fraction may have missed some portion of the very fine TiO2-rich orange+black ash present in regolith 71501 that may have comprised the black layer observed in situ at Station 1 (Chapter 10; also in Schmitt, 2024a).
 Fig. 13.11. 16-25 cm portion of the deep drill core (70001/9) showing contrast in large fragment size-frequency between zone S and zone T (NASA photo from Meyer (2012)).
Table 13.8bb shows that the mix of 75% 71501, 15% 74220 ash, and 10% 70007 VLT ash comes to within half a percentage point of matching the average of three analyses for zone T+T*. Although the U+Th values in the two zones vary between about 0.9 and 1.4 ppm, probably due to poor mixing of U+Th host minerals, the compositional, maturity and petrographic characteristics overall strongly suggest that the source area for their regolith ejecta is from the post-Steno-Emory-Faust-Sputnik area of the Crater Cluster and, specifically, from regolith developed on ilmenite basalt regolith, mixed with significant South Massif regolith, ejected from Steno Crater. Evidence for the presence of pre-Steno, South Massif avalanche material in rake sample 71501 is in the uranium and thorium concentrations (0.23 and 0.75 ppm, respectively) versus their concentrations in ilmenite basalt rock samples from the bedrock rubble at the rim of the near-by ~10 m diameter crater (Station 1, Chapter 10). U and Th contents in basalt samples 71055 and 71136 are 0.132 and 0.32 ppm (Brunfelt et al., 1974) and 0.22 and 0.46, ppm (Eldridge et al., 1974), respectively. As compared to U+Th = 3.45 ppm in young light mantle sample 72121. These lower bedrock values indicate 10-20% South Massif regolith in 71501.

The circular Sherlock and Powell Craters, respectively, both appear similar to each other as well as younger in diameter to depth ratios (Table 13.3a) than the elliptical craters of the Crater Cluster. Both craters are potential source craters for zone T+T*. As there is no other zone in the deep drill core that resembles T+T*, it is likely that Sherlock and Powell Craters formed simultaneously. This zone also may include small contributions from South Massif avalanche regolith (see zone U discussion, below); however, the rake sample 71501, as well as large rock fragments in regolith developed on the Steno Crater ejecta blanket, appears to be largely derived from an ilmenite basalt parent (Schmitt, 2014b).
The chemical composition of deep drill core zone T+T*’s sample 70008 (at 28 cm), is distinct (Laul et al., 1978) from all other zones in the core and in many elements distinct from the ranges of analyses of 10084, the representative regolith sample from Apollo 11 high TiO2 basalt (Meyer, 2012). The comparisons are as follows, with 10084 contents given in brackets ([ ]):
a. FeO is ~3 wt % higher (~18% vs. ~15%). [14.4-16 wt%]
b. Sc at 72.1 ppm is highest. [55-60 ppm]
c. Co at 22.3 ppm is lowest. [18-34 ppm]
d. Ni at 60 ppm is lowest. [200-250 ppm]
e. Ga at 5.2 ppm is lowest. [4-5 ppm]
f. Tb at 2.2 ppm is highest. [2.5-3.0 ppm]
g. Dy at 12. 6 ppm is highest. [17-21 ppm]
h. Yb at 8.21 ppm is highest. [10-11 ppm]
i. Lu at 1.16 ppm is highest. [1.4-1.7 ppm]
j. Hf at 6.5 ppm almost the highest. [9-11 ppm]
k. Ta at 1.44 ppm is highest. [1.2-1.4 ppm]
l. Th at 0.766 ppm (26 cm) is lowest (Silver, 1974). [1.6-1.9 ppm]
m. U at 0.233 ppm (26 cm) is lowest (Silver, 1974). [0.41-0.5 ppm]
These trace element data tend to indicate that zone T+T+ represents as close to an unmodified, ilmenite basalt regolith as is present in the Taurus-Littrow sample suite. In turn, zone T+T* regolith therefore would provide a close representation of the partial melt produced by reheating the ilmenite basalt’s source region in the upper mantle, presumably a region that has not been affected by the hypothesized, impact induced overturn of the upper mantle beneath the Procellarum basin (§26.0). Distinct contrasts with the ilmenite basalt regolith 10084 are present in lower FeO (but TiO2 is lower as well), Sc, Ni, Hf, Th and U, suggesting different mantle source regions for basalts erupted at the two locations.
3. Zone U 47.05-86.15 cm (39.10 cm) (Steno, Emory, Faust and Sputnik Craters: As previously noted in §4.3, zone U’s Is/FeO pattern is anomalous relative to other deep drill core zones, From its deposition on zone V+V* to final burial by zone T+T*, it shows a continuous, drawn-out decline in Is/FeO. Table 13.8c gives the major element composition of zone U that appears to match what can be inferred about the pre-Steno-Emory-Faust-Sputnik regolith. This correlation is re-enforced by a Th content of 1.095 ppm and an U+Th content of 1.414 ppm that suggests a mix of some non-basaltic material with ilmenite basalt regolith (71501). Sculptured Hills-type regolith ejecta (78501) from older potential sources craters (WC, SWP, Cochise, Shakespeare Craters,) would have reached the area. In addition, as discussed below relative to zone W, there is the possibility that mass wasting avalanche deposits from the slope of the South Massif once covered the area, similar to the light mantle avalanche deposits (§17.0).

Table 13.8c includes a comparison of zone U’s reported bulk compositions with that of rake samples of ilmenite basalt 71501, Sculptured Hills 78501, and South Massif 73121. For Sculptured Hills regolith 78501, with 1.337 ppm Th, to raise Th in 71501 from 0.75 ppm to 1.095 would require the mix in zone U to be ~81% Sculpture Hills regolith. This percentage is highly unlikely, as it would distort the major element contents of zone U well beyond what is reported. On the other hand, only 15% of South Massif regolith 73121 with Th = 2.52 ppm needs to be mixed to 60% 71501 to give Th = 1.18 and match zone U’s Th = ~1.095 ppm. This percentage, along with 10% VLT ash bead from 70007 (Vaniman and Papike (1977)) and 15% orange+black ash 74220 also gives appropriate adjustments to 71501 major oxide contents to match zone U’s (Column 6 in Table 13.8cc). The match is within half a percentage point except for FeO; however, Laul et al.’s (1978) FeO value for 46.8-47.3 cm depth (FeO = 19.0%) is from the top of zone U and may be mixed with the base of zone T* regolith (FeO =19.0%). Samples from zone U also are reported (as containing 20-24 modal-% orange+black ash (Taylor et al., 1974) and an estimated ~2 modal-%, yellow-green VLT(?) ash (Vanniman et al., 1979). (Note that significant amounts of either ash would have particle sizes less than 20 µ and some may have been lost before analysis.).

It would appear that a South Massif avalanche deposit covered the pre-Crater Cluster area and became mixed with ilmenite basalt regolith to become the regolith ejecta now found in zone U as well as zones W and T+T*, as discussed below with source craters in the Crater Cluster area. As zone U, with its unusual Is/FeO pattern, may be related to regolith ejected from an area in which elliptical craters Steno, Emory, Faust and Sputnik had formed, one hypothesis suggested above is that these apparently simultaneous oblique impacts relate to impacts of a disaggregated, long-period comet. The elliptical shape and consistent northwest (320° ± 5°) orientation of the long axes of the four craters also distinguishes these four craters from other, circular Taurus-Littrow source craters, with the exception of the older, elliptical Hess Crater. Long-period comets also generally have a significant tail of related but much smaller objects. The high kinetic energy, cometary remnants in this tail would have been periodically encountered by the Moon in its orbit around the Sun, increasing the reset effects of small impacts recorded in zone U until the comet’s tail dissipated soon after zone T* was deposited. This possibility may be supported by the pattern in Fig. 13.3b showing a decreasing modal-% of agglutinates with decreasing depth. Even at high velocities, the low-density cometary impactors may destroy fragile glassy agglutinates at a higher rate than they create them.
Remotely sensed data compiled in Quickmap shows the following contrasts between the area of the Crater Cluster, including Steno, Emory, Faust and Sputnik Craters, and its surroundings:
1. Clementine color indication is significantly lighter than surrounding basaltic regolith suggesting mixing with South Massif regolith or possible modification of the parent ilmenite basalt regolith.
2. OMAT is brighter (less mature) than the close surroundings, although this is consistent with Station 1 Is/FeO indications of low Is/FeO values (35) for rake sample 71501 (Morris, 1978) which are, in turn, consistent with even lower values for regolith ejecta in zone T+T* derived from the post-impact regolith around Steno, Emory, Faust and Sputnik Craters in the Crater Cluster area.
3. Diviner H-Parameter is similar to the Taurus-Littrow massifs, suggesting different thermo-physical properties than the area’s close surroundings, consistent with images and samples obtained at and near Station 1 that show significant concentrations of rocks and boulders. Also, in the later discussion of zone W, synthesis of U+Th and Th contents suggest that 60-68% of regolith ejecta from W’s source crater, Hess, consists of light mantle-like regolith from the South Massif. Hess Crater is 2.7 km from the core site, near the optimum regolith ejecta distance of 2.6 km (Fig. 13.8). On the other hand, Hess is only about 2.2 km from the base of the South Massif, in contrast to the 6.5 km separation of Station 1 sample 71501 from that base, with the Steno, Emory, Faust and Sputnik group in between. A Th content comparison of zone W (Th = 1.535 ppm) with South Massif derived light mantle sample 73121 (Th = 3.45 ppm) in Table 13.8ff, a ratio of 0.49, when compared against an estimated 10.4 m pre-Hess regolith depth (Table 13.15, §8.8) suggests that ~5 m of a light mantle-like deposit could have been included in a thick portion of in situ regolith at Hess Crater’s location, roughly consistent with the estimated >3 m thicknesses of the young light mantle (§17.2) at 2.2 km from the base of the South Massif.
4. UVVIS image is brighter than the close surroundings, indicating greater iron abundance than for those for close surroundings, consistent with the elevated FeO content shown in Fig. 13.1c for zone T+T* whose regolith ejecta is interpreted as coming largely from ilmenite basalt regolith developed on bedrock ejecta blankets, whereas, surrounding areas have regolith that is less pristine.
End of Upload 05
Start Upload 06
4. Zone V+V*: 86.15-111.45 cm (25.30 cm) (Camelot Crater): Initially, this 25.30 cm section of the core appeared in Fig. 13.1c to be two zones of 11.80 and 13.50 cm. Laul et al.’s (1979) compositional analyses of the two potential zones, however, show very little distinction between them. The two initial zones, therefore, have been combined.
The wall rock boulders observed and sampled at Station 5 (Schmitt et al., 2017) initially suggested that the Camelot impact primarily excavated ilmenite basalt; however, in contrast with overlying zones U, T+T*, and S, the relatively low FeO and TiO2 (15.3% and 5.7%) and relatively high SiO2 (42.3%) of both zone V+V* analyses reported by Laul et al. (1979) indicate a contribution from another, non-basaltic source. The compositions of several regolith samples in comparison to analyses from zone V+V* are shown in Table 13.8d. The possibility of significant Sculptured Hills-like regolith being included in zone V+V* is suggested by the thorium (1.090 ppm) and uranium (0.341 ppm) contents that are significantly higher than measured in ilmenite basalt regolith samples such as zone T+T* (0.766 ppm Th and 0.233 ppm U).

Station 5 data from the Apollo 17 Traverse Gravity Experiment indicate relatively low-density bedrock below the Camelot Crater area (Talwani et al., 1973). This, along with the existence of hills (kapukas) of Sculptured Hills-like material elsewhere on the valley floor (Bear and Family Mountains), suggest that the composition of zone V+V* regolith ejecta might be consistent with pre-Camelot regolith having been developed in part on Sculptured Hills-like bedrock with only a thin basalt cover in this general area, now represented by Camelot’s rim boulders. Table 13.8dd indicates that a mix of 44% ilmenite basalt regolith 71501 and 30% Sculptured Hills regolith 78501, and 26% VLT ash (70007 bead) appears to reach a reasonable fit with the Laul et al. average for zone V+V*. Although not a perfect match with zone V+V*’s major element composition, all values for the mix fall within 0.5 percentage point. Using VLT scoria sample 78526 from the Sculptured Hills (col. 6 in Table 13.8dd) rather than the 70007 bead from the core would change the match slightly, particularly in SiO2 (higher) and MgO (lower).

[Schmitt (2014a) notes that there may have been a similar surface or near-surface exposure of Sculptured Hills-type regolith in the vicinity of Shorty Crater. The light gray regolith that overlies the orange+black ash deposit exposed at the rim of that crater, largely is comprised of non-basaltic regolith represented by samples 74240 and 74260 that also resemble Sculptured Hills regolith 78501.]
The high model abundance of VLT ash given in Table 13.8dd is at odds with Vaniman and Papike’s (1977) report that thin-section analysis of the core at the equivalent depths for zone V+V* has about 5% VLT ash as well as about 18% orange+black ash (Taylor et al., 1979). That amount of orange+black ash would result in an imbalance in both SiO2 and TiO2 relative to the Laul et al. (1979) average.
Known potential sources for pyroclastic VLT and orange+black ashes are areas in the Sculptured Hills (Schmitt et al., 2017) and near Shorty Crater (Schmitt, 2014a; §10.0), respectively. In addition, a pyroclastic fissure has been identified on the flank of the North Massif (Schmitt et al., 2017) that is also a potential source of either ash type; although remote sensing data for the apparent debris flow from this fissure, relative to the composition of orange+black ash, suggest there was a buildup of a now collapsed, lower titanium and higher silica ash cone on the slope above the debris flow (Petro and Schmitt, 2018). As Camelot Crater is within 2 km of the areas of both Shorty Crater and the North Massif fissure, the fissure is a likely source for ash in zone V+V*.
At a thickness of 25.30 cm, the correlation of zone V+V*’s regolith ejecta with Camelot Crater raises a question relative to §3.4.3’s quantitative verification of a close relationship of regolith ejecta thickness with source crater distance from the core site. This zone V+V* thickness makes it anomalous relative to most other zones; however, at a location that is slightly less than a crater diameter from Camelot (0.700 vs. 0.744 km, respectively), late stage, low energy regolith ejecta from just inside the current crater rim probably contributed to the thickness of the zone. This possibility is supported by the much higher percentage (62%) (Taylor et. al., 1979) of basaltic lithic clasts in the upper portion of zone V+V* than is present (32%) in the lower portion (Fig. 13.10a).
5. Zone W: 111.45-144.05 cm (32.60 cm) (Hess Crater): As discussed above relative to zone U, zone W’s apparent source crater, Hess Crater, resembles Steno, Emory, Faust and Sputnik Craters in having an elliptical shape; however, Hess has a long to short axis ratio of ~1.36 versus 1.03-1.16 for the other four craters. In addition, Hess Crater’s diameter to depth ratio indicates its relative age is significantly greater than those for Steno, etc. (Table 13.3a), the lack of a timing association between Hess Crater and Steno, etc. craters is further indicated by the orientation of its long axis at ~345° versus ~315-325°, respectively, for Steno, etc. Hess Crater, therefore, is an older, low angle impact feature, but probably formed by an asteroidal impactor.
The relatively high U+Th content (1.985 ppm) of zone W (Silver, 1974) suggests that the very mature regolith ejected by Hess Crater near the South Massif had accumulated significant South Massif regolith ejecta like 73121 (U+Th = 3.995 ppm). Comparison of rake sample 71501 (U+Th = 0.98, Th = 0.70 ppm) from Station 1 (near Steno) and 72501 from Station 2 on the South Massif suggests that ~30% of zone W is derived from the South Massif (Table 13.8e, Column 6) as compared to 58% from ilmenite basalt regolith and 12% from VLT ash (70007 bead).

Although the combination of oxide equivalent analyses in Column 6 in Table 13.8e correlates with that for zone W’s one analysis (Laul et al., 1979) within somewhat more than the desired 0.5 percentage point, the indicated combination nonetheless supports the probability that regolith ejecta from Hess Crater included material from a light mantle-like avalanche deposit from the South Massif (§17.0). Zone W has significantly more mature regolith than any of the deep drill core zones (Fig. 13.1c) with an Is/FeOm, averaging about 75. This fact probably indicates that the pre-Crater Cluster avalanche consisted of South Massif slope regolith that was more mature than that which formed the young light mantle deposit (Is/FeOm = 48). It may be that the accumulation of more mature regolith prior to the pre-Hess Crater avalanche indicates the relative age of the first movement on the Lee-Lincoln thrust fault. Later sections of this synthesis will estimate absolute ages for zone and mass wasting depositions.
End upload 06
Start upload 076. Zone W*: 144.05-163.55 cm (19.50 cm) (Horatio Crater): Zone W* appears to be regolith ejecta from Horatio Crater, based on relative age comparisons, the drill site’s distance from Horatio’s rim vs. zone W*’s thickness (Fig. 13.8), and its intermediate SiO2, TiO2 and Th contents (Table 13.8f). The center of Horatio lies about 700 m from the center of Camelot Crater for which the compositional modeling for zone V+V*(Table 13.8ee) indicates that the Camelot impact was into regolith containing both ilmenite basalt debris (71501) and Sculptured Hills-like regolith (78501). A better compositional fit for zone W*, however, comes from comparing zone W* with a mix (Table 13.8ff) of 53% ilmenite basalt regolith (71501) and 37% North Massif (76501) regolith with 10% VLT ash (70007 bead). This match suggests that the Horatio Crater impact encountered ilmenite basalt regolith mixed with a North Massif avalanche deposit.


Horatio Crater also lies about 4 km from, and roughly orthogonal, to the base of the North Massif and where a pyroclastic fissure is located (Schmitt et al., 2017; Petro and Schmitt, 2018). Horatio is also in line with the head of a debris flow below that fissure that may be the remains of an unstable pyroclastic cone. The slope of the North Massif opposite Horatio Crater is 26°-27° (from LROC QuickMap), that is, about the same as the slope of the South Massif from which the light mantle avalanches originated (Schmitt et al., 2017; §17.0). The initiation of the fissure eruption on the side of the North Massif may have triggered an avalanche similar to the South Massif’s light mantle. The suggested >4 km run-out of such an avalanche would be comparable to that of the young and old light mantle avalanches from the South Massif (§17.0) and result in ~3 m of North Massif regolith being deposited on pre-Horatio ilmenite basalt regolith. This would appear to be a more likely source of North Massif regolith in zone W*.
7. Zone X: 163.55-188.45 cm (24.90 cm) (Henry Crater): The SiO2 and TiO2 contents reported by Laul et al. (1979) for zone X (Table 13.8g), when compared with ilmenite basalt 71501, North Massif 76501, and Sculptured Hills 78421 regoliths, suggest a mix of all three such components. Zone X’s apparent source crater, Henry, is located on the valley floor near the base of the North Massif just west of Wessex Cleft where pre-Henry regolith ejecta could accumulate from all three of these geologic units. Table 13.8gg shows the average zone X composition compared with a mix of 60% ilmenite basalt regolith; 20% Sculptured Hills regolith; 15% North Massif regolith; and 5 % VLT ash.


8. Zone X* 185.45 -200.45 cm (15.00 cm) (Nemo Crater): The SiO2 and TiO2 contents reported for zone X* (Table 13.8h), when compared with ilmenite basalt 71501 and South Massif 73121 regoliths, suggest an approximately equal mix with about 20% orange+black ash added (Table 13.8hh). This mix is also suggested both by the high proportion of basalt fragments in the lithic clast portion of the zone and by the location of Nemo Crater about 2 km northeast of the base of the South Massif, well within range of avalanches (§17.0). The proximity to the South Massif avalanches may explain the higher thickness of regolith ejecta (Fig. 13.8) than expected for a source crater located at 4.65 km from the core site.


End of upload 07
Start of upload 089. Zone Y+Y*: 200.45-252.75 cm (52.30 cm) (Mackin Crater): The 52.30 cm thickness of zone Y+Y* regolith ejecta suggests that its source crater is located near the 2.6 km range of maximum deposition after impact (Fig. 13.8). The relatively high SiO2 and U+Th contents indicate that significant South Massif-related regolith ejecta is contained in zone Y+Y*, with the intermediate TiO2 values also showing that significant ilmenite basalt regolith also is present. Only Mackin and Hess Craters meet these constraints; however, as previously noted in the discussion of zone W, the elliptical Hess Crater (~849 x 624 m) is the younger crater, its ejecta overlying the ejecta blanket of Mackin Crater (QuickMap; also Fig. 13.5), and is interpreted as being the source crater for zone W.

Four analyses of zone Y+Y* regolith ejecta and the various regolith sample compositions that might relate to these compositions are given in Table 13.8i. The average of the zone Y+Y* analyses and compositions of ilmenite basalt regolith 71501, South Massif regolith 73121, and the VLT bead from 70007 are compared in Table 13.8ii. Mixing these three samples in 50/35/15 proportions, respectively, comes within a half a percentage point of matching the average composition for zone Y+Y*. As with the similar match of these analyses with that of zone W, the presence of a few meters thick avalanche deposit from the South Massif in the pre-Mackin regolith is indicated.[As discussed in §17.0, rake sample 72501 does not appear to reflect the U and Th composition of the slope of the South Massif prior to the young light mantle avalanche as indicated by young light mantle trench samples 73121 and 73221. These two samples indicate that U+Th at that earlier time equals ~3.45 ppm, Th = ~2.52 ppm, and U = 0.938, using a Th/U ratio equal to 3.70 (see Silver, 1974, mis-labeled sample 72331). Enrichment of 72501 in U+Th has taken place since the young light mantle deposition (§17.10).
In addition, using the model percentages in Table 13.8ii, below, and equating the U+Th value for 70007 to the Y+Y* average U+Th in Column 2 of Table 13.8ii, the calculated U+Th and Th values for 70007 are estimated to be 3.47 and 2.53 ppm, respectively.]

Initially, zone Y+Y* was divided into two zones of 39.50 and 12.80 cm thicknesses, respectively, on the basis of ~1 wt% differences in the SiO2, MgO, TiO2 FeO and U+Th contents (Table 13.8i, Column 5). In various subsequent zone comparisons of various parameters, however, the graphical plots for Y* fell significantly outside the ranges of other zones. Combining the two zones brought zone Y+Y* into the trends represented by the other 10 zones. The differences in the compositions may indicate turbulent mixing in the regolith ejecta parabola was incomplete for this particularly thick zone. A suggestion of overturn of the source regolith and incomplete mixing also can be seen in the increase of SiO2, MgO and U+Th and decrease in TiO2 and FeO with depth (Table 13.8i), as would be expected with impact overturn of ilmenite basalt regolith overlain by avalanche regolith from the South Massif. Arguing against this hypothesis is the apparent decrease in Al2O3 with depth. (See further discussion of South Massif avalanches in §17.0).
10. Zone Z+Z*: 252.75-274.65 cm (32.90 cm) (Cochise Crater): Initially, zones Z and Z* also were considered as separate regolith ejecta deposits based on major variations in Is/FeO values in their combined portion of the deep drill core. Further investigation, discussed previously (§4.0), indicates that such variations can be better explained by significant impact induced resets of Is/FeO values and their subsequent variable increases due to maturation by continued U+Th alpha+beta and solar wind proton particle radiation. Further, the curves in Fig. 13.8 suggest that Cochise Crater at a distance of 2.45 km from the core site should have deposited more than 21.90 cm of regolith ejecta. Combining the previously indicated thicknesses of zones Z and Z* (21.90+11.00 cm = 32.90 cm) makes Cochise as a source crater consistent with the thickness vs. source crater distance curve shown in Fig. 13.8.
The location of Cochise Crater just on the valley side of the contact between ilmenite basalt and the Sculpured Hills suggests that regolith from both sources should be abundant in zone Z+Z* (Table 13.8j). A first modeling, using the Station 8 rake sample 78501, resulted in about 70% of Z+Z* being Sculptured Hills regolith with only about 10% of ilmenite basalt regolith 71501. This match was not consistent with the geological location of Cochise. A much more geologically supportable match to within half a percentage point of the average zone Z+Z* analyses (Table 13.8jj), with the exception of MgO, comes from 45% Sculptured Hills trench regolith (78241), 40% ilmenite basalt regolith (71501), 10% orange+black ash (74220), and 5% VLT ash (70007 bead).
The composition of 78421 is closely matched by that of 78220 obtained from beneath a large boulder higher up the slope of the Sculptured Hills from Station 8. The MgO and TiO2 discrepancies in this model may be the result of excess norite and ilmenite fragments in the analyzed regolith ejecta of zone Z+Z* relative to the very mature (Is/FeO = 92) Sculptured Hills regolith component, 78421. It is also plausible that the pre-Cochise impact regolith includes the remains of a Sculptured Hills avalanche deposit from the nearby slopes that was enriched in norite similar to 78235. Granular debris flows from a Sculptured Hills peak are present to the east.


11. Zone Z**: 285.65-294+ cm (8.35+ cm) (Shakespeare Crater): Although reported Is/FeO values are not available below 285.65 cm in the deep drill core, Zone Z** is distinguished from zone Z+Z* primarily on the basis of a significantly lower original Is/FeOm (~40 vs. ~50). Only the top 8.35 cm of zone Z** is present at the bottom of the core; however, Fig. 13.8 indicates that for source crater Shakespeare, at a distance of 1.4 km from the core site, the total thickness of zone Z** would be close to 8 cm.
The composition of zone Z**’s regolith ejecta (Table 13.8k) closely resembles that of the average for zone Z+Z* (Table 13.8j). Shakespeare Crater appears to be zone Z**’s source crater and, as Shakespeare lies only ~2 km west of Cochise Crater this similarity would be expected, particularly if the pre-impact regolith included material from a Sculptured Hills avalanche. Table 13.8kk shows a reasonable match with the zone Z** average composition by 55% 78421 (Sculptured Hills trench), 35% 71501 (Station 1 rake sample), and 10% 74220 (Shorty Crater ash).


End of upload 08
Start of upload 09
6.0 ∆Is/FeO-Based Ages of Source Crater Impacts and Zone Deposition
6.1 Introduction
The preceding stratigraphic synthesis of data related to the Apollo 17 deep drill core indicates that impacts resulting in 400-800 m diameter craters, and larger, have transported large quantities of regolith many crater diameters from their impact points to the inter-crater deep drill core site. This process has created a stratified, inter-crater accumulation of material representative of many previous such accumulations elsewhere in the valley. Each mass of regolith ejecta has been largely homogenized during transport, due to ballistic and internal volatile turbulence (§3.0) before being deposited as integrated new strata or zones that now comprise the inter-crater regolith sampled by the core.
The mixing of the pre-impact, also stratified regolith ejecta, results in each new ejecta deposit’s composition and cosmic ray exposure values being essentially uniform throughout the newly deposited zone. As discussed in §§ 3.0 and 4.0 the homogenization largely may have been confined to the fine size fractions of the ejected regolith; however, the size-frequency analyses reported in Graf (1993) show that about 75-80% of the mass of regolith ejecta zones is in the less than 150 µ fractions.
As discussed previously in §3.0, there exist 14, clearly definable, 400-800 m diameter craters in the Taurus-Littrow area, and one 1400 m diameter crater, whose ejected regolith could potentially reach the inter-crater location of the deep drill core (Figs. 13.1a,b; Fig. 13.5). Based on relative age, composition and thickness of their ejecta, 11 of these potential source craters have been identified with reasonable certainty as being associated with the 11 specifically defined zones in the core. After deposition, the regolith ejecta zones were each exposed at the lunar surface for long periods of time as indicated by the accumulation of significant evidence of total post-deposition maturation (Figs. 13.1c, 13.2, 13.3a,b).
If the post-deposition exposure ages of each regolith ejecta zone in the deep drill core can be calculated, their cumulative totals will date each of the 10 complete zones and their correlated impacts, as well as the total time of accumulation of material in the core down to 2.85 m. Comparison of the time for core deposition with the age of the youngest ilmenite basalt eruption (3.82 Ga) will provide an estimate of the total depth of local regolith. Cosmic ray exposure ages (Eberhardt et al., 1974) obtained from samples along the length of the core and on control sample 70180, however, cannot be used to estimate the post-deposition exposure ages of regolith ejecta zones as these cosmic ray data would include pre-source crater exposure.
6.2 Nitrogen Isotopic Ratios in the Deep Drill Core
6.2.1 Introduction
Early in this synthesis of Apollo 17 data from Taurus-Littrow, an initial review of nitrogen isotopic data for the deep drill core (Thiemens and Clayton, 1980), relative to reported maturity indices (Morris et al., 1979) indicated that the maturation energy of solar wind protons increased before the deposition and exposure of regolith ejecta zones S and T (Schmitt, 2019b). Further consideration of this relationship has emphasized the importance of this increase in solar wind energy in employing ∆Is/FeO values to estimate the deposition and exposure ages of deep drill core regolith ejecta zones.
In the 1960s, E. M. Shoemaker (pers. comm.) hypothesized that development of the lunar regolith over time has recorded the history of the Sun. The inclusion of core tubes on Apollo missions beginning with Apollo 11 (Apollo Field Geology Experiment with Shoemaker, G. A. Swann, and W. R. Muehlberger as Principle Investigators) was motivated, in large part, by this hypothesis. It is now clear that some of the Sun’s history is written in the systematics of isotopes delivered to the Moon by the solar wind. Beginning in the early 1970s, measurements of isotopic ratios began to provide insights into a variety of solar wind questions.
Only after Apollo 11 returned lunar samples was it confirmed that the concentrations of solar wind volatiles retained in the lunar regolith, particularly hydrogen, nitrogen and helium, constituted large potential resources for use in space and, in the case of the light isotope of helium, 3He, a resource with many potential applications on Earth (Wittenberg et al., 1986; Schmitt, 2006).
6.2.2 Detailed Relationships Between ∆Is/FeO and δ15N‰ in the Deep Drill Core
Nitrogen constitutes one of the most abundant solar wind volatiles in lunar regolith (>200 ppm) (Heiken et al., 1991). To study nitrogen’s isotopic variability in the lunar regolith, Thiemens and Clayton (1980) measured δ15N‰ values at points within 8 of the 11 defined regolith zones in the deep drill core (Table 13.9, Column 5). Plotting these δ15N‰ values against the zone’s ∆Is/FeO (Fig. 13.12a) shows a direct and tightly controlled isotopic mixing trend that correlates δ15N‰ with ∆Is/FeO values in the 5 oldest zones (W* to Z+Z*). Along this mixing trend, δ15N‰ decreases with increasing ∆Is/FeO along a slope of about –0.77‰ per ∆Is/FeO, indicating that mixing fractionation loss of 14N vs. 15N due to maturation was taking place relative to a solar wind reservoir of very negative δ15N‰ values. (Fig. 13.12b shows the Is/FeO-based deposition ages (Table 13.15) of zones plotted in Fig. 13.12a that will be derived in §§ 6.4 and 7.3.) This mixing trend extrapolates back to zero ∆Is/FeO at δ15N‰ = +80‰ (15N-rich); however, the extrapolation of this trend to higher values of ∆Is/FeO indicates that solar wind δ15N‰ at the time of zone deposition through maturation of the plotted zones was <<–170‰ and, as discussed below in §13.4, probably <–200‰ (very 15N-poor).

Although the local regoliths ejected by their source crater impacts would have already begun equilibration with the extant, highly negative δ15N‰ solar wind, additional exposure to fractionation subsequent to deposition at the deep drill core site continued to drive their individual δ15N‰ numbers toward increasingly higher values.
[The δ15N‰ = +80‰ at zero ∆Is/FeO in Fig. 13.12a probably indicates that the lunar magma ocean from which the crustal units represented in Taurus-Littrow were derived had a similarly high positive δ15N‰ value. That value probably is a combination of an inherited accretionary value and thermal fractionation during the active lifetime of the magma ocean.]
 Fig. 13.12a. Plot of δ15N‰ vs. ∆Is/FeO at the point of analysis in deep drill core that shows older zones W to Z+Z* have a fractionation trend from negative to positive (δ15N‰ / (∆Is/FeO) = –0.77‰). An increase in solar production of 14N is shown by a trend line (green) from zone W to –118‰ that also includes zones U, V+V*.and T+T*.
 Fig. 13.12b. Previous Fig. 13.12a with added zone deposition ages from Table 13.15, §7.3.
End of Upload 09
Start of Upload 10
The positions of zones V+V*, U, and possibly T+T* in Fig. 13.10a, when combined with the youngest of the five oldest zones (W), suggest a major change in the solar wind’s δ15N‰ toward higher values after zone W* deposition at ~0.514 Ga and prior to zone W’s deposition at ~0.394 Ga. At ∆Is/FeO = 0, Fig. 13.10b shows that a W-V+V*-U-T+T* trend line (green) suggests a value for δ15N‰ of about –118‰ for the post-zone W solar wind and implies that 15N content had increased. (Fig. 13.10b shows the Is/FeO-based deposition ages (Table 13.15) of zones plotted in Fig. 13.10a that will be derived in §§ 6.4 and 7.3.).
The indicated increase in the solar wind’s δ15N‰ after ~0.514 Ga, that is, an increase in 15N production, may have been associated with an increase in energy production in the Sun that, in turn, may have been the major contributor to warming associated with the Earth’s Cambrian Explosion of ocean life initiated about 0.538 Ga (Whittington, 1985; Gould, 1989; Maloof et al., 2010). The difference of ~26 Myr is probably within the error limits in this synthesis of deposition ages for deep drill core regolith ejecta zones. In fact, the start of the Cambrian Explosion at 0.538 Ga may provide a calibration point for the deposition ages given in Table 13.15, that is, zone W* may have been deposited prior to 0.538 Ga rather than about 0.514 Ga.
The question remains as to whether the two phenomena recorded on the Moon and the Earth actually are physically related. It also would be of important to know if the physics of solar evolution is consistent with changes indicated by lunar nitrogen isotopic variations.
6.2.3 Second Change in the Energy of the Solar Wind Late in Lunar History
When the available δ15N‰ / ∆Is/FeO values of surface regolith samples (red points in Fig. 13.13) are plotted, the general elongate area in which they fall incorporates deep drill zones S and T+T* to give a isotope fractionation trend line consistent with a current solar wind δ15N‰ value of about –118‰. This red fractionation trend has a slope of negative to positive δ15N‰ trend of about +3.00‰ / ∆Is/FeO.
 Fig. 13.13. Fig. 13.12a (black circles, o) with surface sample δ15N‰ vs. Is/FeO data plotted (red circles, o) that correlate with younger zones S and T+T* to show a fractionation trend that intersects δ15N‰ at about –118‰ at zero ∆Is/FeO. This fractionation trend has a slope of from negative to positive δ15N‰ of about +3.00‰ / ∆Is/FeO.
The additional surface regolith samples, their data sources, and δ15N‰ values plotted in Fig. 13.13 are as follows (Is/FeO values from Morris, 1978):
1. 70011 (Becker and Clayton, 1977; Norris et al., 1983; Petrowski et al., 1974)
♦ Is/FeO = 54; δ15N‰ = +27
2. 71501 (Petrowski et al., 1974; Frick, et al., 1988)
♦ MI = 35; δ15N‰ = +25.4 (Ave. of +26.0 and +24.7)
3. 72501 (Norris et al., 1983)
♦ Is/FeO = 81; δ15N‰ = +63
4. 72701 (Petrowski et al., 1974)
♦ Is/FeO = 61; δ15N‰ = +0
5. 73121 (Becker, 1980)
♦ Is/FeO = 78; δ15N‰ = +9
6. 75061 (Becker and Clayton, 1975; Norris, et al., 1983; Petrowski, et al., 1974)
♦ Is/FeO = 33; δ15N‰ = +33.4
7. 75081 (Norris et al., 1983; Becker, 1980;)
♦ Is/FeO = 40; δ15N‰ = +45
8. 76240 (Norris et al., 1983)
♦ Is/FeO = 56; δ15N‰ = +34
9. 76501 (Becker and Clayton, 1975)
♦ Is/FeO = 51; δ15N‰ = +29.2
10. 78501 (Becker and Clayton, 1975)
♦ Is/FeO = 36; δ15N‰ = -6.1
(Underlined data source is that chosen for δ15N‰ values based on the present author’s judgment where more than one such source is available.)
[The close correlation of the surface sample trend with zones S and T indicate that Morris’s (1978) reported Is/FeO values are very close to their true ∆Is/FeO values. The scatter in the surface sample plots in part is due to variations in the amount of geologically recent partial resets of Is/FeO by nearby small impacts, as well as the extensive resets of Is/FeO at deposition by the source crater impacts (see §8.]
Sometime after the deposition of zone U (~0.197 Ga), the energy of the solar wind increased again, but with no change in its embedded δ15N‰ value, so that a new isotope fractionation trend of δ15N‰ vs. ∆Is/FeO (red trend) was established. This new trend includes data from zones S and T as well as all analyzed regolith surface samples. It is likely that any terrestrial effect of this increase in solar wind energy began prior to 0.096 Ga, the deposition age of zone T+T*. If the change in slope between the red and green δ15N‰ vs. ∆Is/FeO trends in Fig. 13.13 is used as a measure of the change in solar wind maturation energy, the increase was by a factor of ~3.4 (3.00 / 0.88). As internal alpha+beta particle maturation effects would be nearly constant during this period, this increase in maturation energy would be related to the solar wind.
The correlations discussed in this section may be the first confirmation that the lunar regolith records the history of the Sun, as predicted by E. M. Shoemaker in the early 1960s (pers. comm.).
The close match of the measured δ15N‰ and ∆Is/FeO values to the black, green and red trend lines for regolith ejecta zones in Fig. 13.13 indicates highly efficient, post-ejection, isotopically proportional loss of solar wind nitrogen in the regolith ejecta sheaths. Otherwise, a significantly greater scatter of the plotted points would be expected. This process of isotopic fractionation by volatilization may be attributed in part to ballistic and volatile turbulence in impact ejecta sheaths discussed in §3.3 as well as to continuous gardening during zone exposure.
6.3 Solar Proton and Uranium+Thorium Alpha+Beta Decay Particles Contributions to ∆Is/FeO / Myr
6.3.1 Introduction
Through most of the six decades since lunar regolith was first closely examined by Surveyor III’s camera and trenching tool (Shoemaker et al., 1967), the main agents of its development and maturation over time were considered to be macro- and micro-meteor impacts and solar wind proton radiation. The development of a means to quantitatively measure a maturity index, or Is/FeO (Morris et al., 1975; Morris, 1976), the abundance of impact produced agglutinitic glass in Apollo 11 regolith samples (Duke et al., 1970; McKay et al. 1970), and the discovery of glassy patinas on regolith grains that contained nano-phase iron particles (Taylor, 1988) were initially consistent with these ideas.
The synthesis of Apollo 17 data presented here has added several amendments to this paradigm, particularly with respect to (1) the formation of nano-phase iron by alpha+beta particle radiation from uranium and thorium decay, (2) the importance of micro- and small macro-impacts in continuously commutating and mixing regolith ejecta zones during their long periods of exposure at the surface, and (3) the resistance to increases in Is/FeO values (maturation) arising from the presence of volcanic glass and oxide minerals, particularly ilmenite. The effects of volcanic glass and oxide minderals will be discussed in §7.0.
[The extremely high temperatures generated at the impact points of micro-meteors in a hydrogen-rich, reducing environment may or may not be a significant factor by themselves in the creation of nano-phase iron and increases in Is/FeO values. No evidence of this happening has been discovered during this synthesis, however, as said in forensic investigations, “the absence of evidence does not mean the absence of guilt.” An investigation of the impact glass in and around micro-meteor craters on rock surfaces (”zap pits’) could confirm this assumption. On the other hand, there is strong evidence that impacts partially reset those values (§4.2).
Micro-meteor impacts, however, are very important in the formation of glassy agglutinates and in partial resetting of Is/FeO values discussed in §§ 3.2.1 and 4.0, respectively. As documented in §4.0, the shock and/or heat generated at the point of impact partially resets the “Is” values in Is/FeO indices. It is conceivable that oxidation of nano-phase iron by oxygen-rich plasmas contributes to Is/FeO resets.
Micro-meteor impact melting may contribute to the development of the glassy patina on most regolith particles, although such impacts also would contribute to the creation of new particle surfaces, initially without patinas. These 50-100 µ thick patinas contain much of the regolith’s nano-phase iron as well as having vesicles that appear to hold solar wind volatiles (Burgess and Stroud, 2018).
Further, micro-meteor impacts are very important in the gradual generation and continued comminution and mixing of regolith (gardening), a process that maintains alpha+beta particle access to Fe++.]
6.3.2 Alpha+Beta-only ∆Is/FeO / Myr
Silver (1974), Laul et al. (1978, 1979, 1980), Meyer (2012) and others have documented the presence of significant quantities of uranium and thorium (1-3.9 ppm). in Apollo 17’s deep drill core regolith zones. Isotopes of 238U, 235U and 232Th emit alpha and beta particles as they undergo radio-isotopic decay. Further, Bower et al. (2015) have shown that alpha+beta radiation from uranium and thorium in zircon inclusions in biotite reduces Fe++ and Fe+++ to Fe°, that is, to nano-phase iron.
Current uranium and thorium contents in the deep drill core zones, plotted against ∆Is/FeO (Fig. 13.14), indicates a linear relationship with increasing U and Th. This confirms that alpha and beta decay particles play a significant roll in regolith maturation.

Fig. 13.14. Relationship between ∆Is/FeO and current uranium (red cricles, o) and thorium (black circles, o) content of deep drill core regolith ejecta zones. The slopes of both these trends will decrease when Th and U values at the mean age of zone exposure is considered.
The continuous, although gradually decreasing, effect of 238U and 232Th alpha decay on nano-phase iron production in surface regolith would be present through most of the history of the Moon. Finally, the energy levels for alpha particles from 238U and 232Th (4.196 MeV and 12 MeV, respectively) are routinely much higher than for protons in the continuous solar wind (0.5-0.3 x 10⁻³ MeV); however, during solar energetic particle (SEP) events, solar wind protons reach energy levels of 10 x 10-3 MeV to ~10 GeV (Reames, 2021).
The relevant half-life and energy constants related alpha+beta decay of uranium and thorium are as follows (Dragoset (NIST), 2001):
♦ 238U half-life = 4.47 Byr with 4.196 MeV alpha+beta particles,
♦ 235U half-life = 2.45 Byr with 4.776 MeV alpha+beta particles;
♦ 232Th half-life = 14 Byr with 12 MeV alpha+beta particles.
The ratio 238U / 235U = ~138 in chondrites (Brenneck et al. 2010), so the dominant source of alpha particles in the regolith ejecta zones is from uranium is 238U. The lunar regolith thorium/uranium ratio is between 3.1 and 3.8 (Silver, 1974), and, even though 232Th has over 3 times the half-life of 238U, the higher energy alpha particles from thorium will be more deeply penetrating than those from 238U. Bower et al. (2015), Nasdale et al. (2006), and others report that alphas from uranium and thorium decay penetrate 30-50 µ into the hydrous silicates studied (biotite, cordierite, chlorite).
Alpha+beta particle penetration is also a function of the density of the target. Although the specific gravity of the regolith is ~1.9 g/cm3 vs. 1.5-3.3 for the minerals studied by Bower et al. and Nasdale et al., the specific gravity of the individual silicate particles in the regolith are comparable to those studied. With the emitters being in vacuum, it is reasonable to consider 30-50 µ to be the penetration range for alpha particles emitted in the regolith. For perspective, 30-50 µ is roughly the thickness of the glassy patinas on regolith particles.
The radiation effects noted in terrestrial silicate minerals surrounding alpha+beta emitters (zircon, monazite, etc.) show discrete color variations as function of distance from the emitter (i.e., pleochoric halos), reflecting the specific differences in particle energies in the two decay chains. In the case of the lunar regolith, however, impact gardening (macro- and micro-meteor mixing) will produce a relatively uniform distribution of these energy variations. These considerations suggest that the concentrations of uranium and thorium (U+Th) can be combined as a proxy for alpha+beta particle induced increases in Is/FeO.
The above discussion and related figures do not take into account the other necessary component of alpha+beta particle maturation, namely the amount of the target Fe++ available within 30-50 µ. Table 13.10 gives the FeO content of the various zones as related to Th content. Normalizing Th content to FeO and plotting against ∆Is/FeO is shown in Fig. 13.15.

End of Upload 10
Start of upload 11
The relatively tight trend for the zones plotted in Fig. 13.15 further indicates that increases in ∆Is/FeO track increases in Th contents of zones, and by inference, track U+Th, as well. Additionally, the intercept of Th/FeO = ~0.035 at ∆Is/FeO equal zero indicates that, at Th/FeO values below ~0.035, Th-related alpha particle contributions to ∆Is/FeO cease. It is not clear why this would be the case, but there are no regolith samples from Taurus-Littrow with reported Th/FeO values lower than 0.035 that would confirm such a conclusion.
 Fig. 13.15. Relationship between current thorium content, normalized to zone FeO content, and alpha+beta-only ΔIs/FeO. (Table 13.10).
A straightforward means of calculating the alpha+beta-only contribution to the total value of ∆Is/FeO/Myr in lunar regolith is provided by samples related to the large boulder of impact melt-breccia investigated at Station 6. This boulder, originally about 18×10×6 m in size (Wolfe et al., 1981), had come from an identified location on the slope of the North Massif. Shaken loose by an impact or seismic event, the boulder had bounced rather than rolled about 1.5 km down the slope, leaving a track of shallow craters until it came to rest at a point where the slope changed from about 26º to about 11º (Lunar QuickMap). At its last impact, the boulder broke into 5 fragments (Figs. 13.16a,b), with Fragment 4 creating a continuous shadow over regolith splashed from the last impact. Cosmic ray exposure ages from the abraded surfaces of the boulder range between 17 and 22 Myr (Crozaz et al., 1974; Turner and Cadogan, 1975; Cadogan and Turner, 1976), with the average being about 19.5 Myr. This average gives a good estimate of the age for the boulder’s arrival at the base of the North Massif.
Given the above considerations, a sample pair from Station 6 also provides a means to estimate a value alpha+beta-only ∆Is/FeO/Myr. This sample pair (Figs. 13.16a,b) is shaded 76240 (Is/FeO = 56, U+Th = 2.801 ppm (Silver, 1974)) and buried 76280 (Is/FeO = 45, U+Th = 1.83 ppm (Meyer, 2012)), both removed from solar proton exposure at ~19.5 Myr. Using the following relationship for alpha+beta-only ∆Is/FeO per ppm U+Th: ∆Is/FeOR (2.80 ppm) (19.5 Myr) – ∆Is/FeOR (1.83 ppm) (19.5 Myr) = 11; (where ∆Is/FeOR is ∆Is/FeO / Myr / ppm U_Th).
And solving for ∆Is/FeOR, gives ∆Is/FeO / Myr / ppm U+Th = 0.58.
Unfortunately, no other pair of buried samples was obtained that independently would verify the above value of ∆Is/FeO / ppm U+Th = 0.58.
 Fig. 13.16a. Plan view of Station 6 boulders and craters, showing location of samples referred to in the text (after Le Mouélic et al., 2024).
 Fig. 13.16b. Plan view sketch of Station 6 boulders, showing boulder fragment designations and location of samples referred to in the text as well as photograph locations (after Wolfe et al., 1981).
6.3.3 Solar Proton-only ∆Is/FeO / Myr
At the initiation of this synthesis of field, photographic and analytical data related to the regolith present in the valley of Taurus-Littrow, it generally had been concluded (Taylor et al., 2001; Peters et al., 2000; Morris, 1978) that, in addition to meteor and cometary impact gardening processes, the major factor in the maturation of lunar regolith was the flux of the solar wind protons (H+) at energies of 1 × 10⁻³ MeV to ~10 GeV for flares and mass ejections (Reames, 2017). Indeed, the existence of npºFe (nano-phase iron) in thin patinas of alumina-silicate glass on regolith particles (Taylor, 1988) appeared to document the solar wind effect.
The samples from Station 6 (Figs. 13.16a,b) also provide a means of calculating the solar proton-only contribution to the total value of ∆Is/FeO / Myr. A 10-point difference between the Is/FeO (Morris, 1978) of the sunlit regolith 76220 (Is/FeO = 66) from the floor of the next to last shallow impact crater caused by the boulder and the Is/FeO of the nearly simultaneously shadowed sample 76240 (Is/FeO = 56), from under Fragement 4 is a measure of the total ∆Is/FeO / Myr. U+Th for sunlit 76220 equals 2.10 ppm (Korotev et al., 1992) and for shadowed sample 76240 equals 2.80 (Silver, 1974). The 19.5 Myr maturation relationship between samples 76240 and sunlit 76220 can be expressed as follows:
(∆Is/FeOA / Myr) (76240 U+Th) (19.5 Myr ) – [(∆Is/FeOA / Myr (76220 U+Th) (19.5 Myr) + (∆Is/FeOP / Myr) (19.5)] = 10
where subscript “A” is for “alpha+beta” and subscript “P” is for “proton” and (∆Is/FeOA / Myr / U+Th) = 0.58 from §6.2, above.
Solving for ∆Is/FeOP / Myr:
0.58 × 2.80 × 19.5 – [0.58 × 2.10 × 19.5 + (∆Is/FeOP / Myr) × 19.5 = 10
31.7 – [23.8 + (∆Is/FeOP / Myr) × 19.5 = 10
– 23.8 – (∆Is/FeOP / Myr) × 19.5 = 10 – 31.7
– ∆Is/FeOP / Myr = 10 – 31.7 + 23.8 /19.5
∆Is/FeOP / Myr = 0.11
Based on the previous analysis (§6.2.3) that the current solar wind nitrogen isotopic fractionation effect is 3.4 times greater than for zones older than zones S and T+T* as well as for samples from the current surface, the solar proton-only ∆Is/FeO / Myr for zones U through Z+Z* would be about 0.032 (0.11 / 3.4).
The indication in Fig. 13.13 of §6.2.3 of a close correlation between greater ∆Is/FeO and greater fractionation of 14N relative to 15N suggests that this is the result of an increase in the total energy of the solar wind. Such an increase likely is due to an increase in proton flux rather than an increase in the energy of the individual protons, as an increased proton flux would produce more interactions with embedded nitrogen. It is concluded here, therefore, that solar proton-only ∆Is/FeO / Myr for zones U through Z+Z* is about 0.032.
[Two other boulders (data from Meyer, 2012) provided potential opportunities to test the above solar proton only value of ∆Is/FeO/Myr = 0.11, namely, Boulder 3 at Station 2 and the norite boulder at Station 8. Samples from beneath both these boulders were obtained (72441 and 72461 from Boulder 3 at Station 2 and 78221 from the norite boulder at Station 8). Pairing of ∆Is/FeO values of these covered samples with those of local sunlit regolith is possible, however, post-arrival cosmic ray exposure ages for neither boulder are available. A cosmic ray exposure age for Boulder 3 at Station 2 (72414 or 72435) has not been reported and that reported for the norite in the boulder at Station 8 (78235) is 292 ± 14 Myr is not compatible with an ∆Is/FeO = 12 for the covered vs. sunlit sample pairing (78221 vs. 78231). The 292 ± 14 Myr exposure age for the impact glass-covered norite boulder must reflect exposure on the Sculptured Hills prior to its arrival near Station 8. An exposure age for the impact glass covering the norite would be useful in this regard.
Pairing covered samples 72441 and 72461 (having similar U+Th contents near 3.8 ppm) with an average Is/FeO = 69.5 with sunlit rake sample 72501 (Is/FeO = 81) gives a ∆Is/FeO = 11.5. With a combined ∆Is/FeO/Myr = 2.31 (ΔIs/FeO/Myr/ppm = 0.58 × 3.8 ppm = 2.20 + 0.11), the exposure age (roll age) of Boulder 3 at Station 2 would be ~5 Myr (11.5/2.31). A similar comparison between buried 78221 and sunlit 78421 (∆Is/FeO = 1 / 1.04 + 0.11) suggests that the norite boulder arrived at Station 8 less than one million years ago.]
Buried sample 76280 (Is/FeO = 45, U+Th = 1.83 ppm) and sunlit sample 76030 (Is/FeO = 64, U+Th = 1.83 ppm) obtained at Station 6 (Figs. 13.16a,b) provide a possible check on this calculation of solar proton-only and alpha+beta-only ∆Is/FeO/Myr = 0.11 and 0.58/ppm, respectively. There is a 19-point difference (64 – 45) in the Is/FeO values between the two samples. The combined ∆Is/FeO / Myr = 1.17 (0.58 × 1.83 + 0.11) and that value times 19.5 Myr gives a predicted ∆Is/FeO = 22.8 vs. the measured 19. This is a fairly good check on the two calculated ∆Is/FeO/Myr values, particularly when it is recognized that sunlit 76030 was taken from the surface of an open, ~11º slope where continued down-slope mass-wasting would have lowered its current Is/FeO with the introduction of younger regolith. Other slope samples that were not affected by the boulder’s arrival, indeed, have Is/FeO values less than the 64 for 76030, i.e., the Is/FeO for rake sample 76501 is 58 and the lowest value in core 76001 is 60.
6.3.4 Regolith Particle Patinas Possible Role in Attenuation of Proton-only ∆Is/FeO
The identification of 50-100 µ thick, low Fe++, alumino-silicate glass patinas on regolith particles (Taylor, 1988; Taylor, et al., 2001; Taylor and Schmitt, 2005; Burgess and Shroud, 2018: Cymes et al., 2022; and Li et al., 2022), containing nano-phase iron partiles and vesicles, but no structural Fe++, raised the possibility that solar proton maturation of regolith would be attenuated as the concentration of patina-covered particles increased. It is anticipated, however, that a steady state impact gardening environment in the regolith would prevent the development of this patina from completely coating most particles.
End of Upload 11
Start of Upload 126.4 ∆Is/FeO Derived Exposure and Deposition Ages for Deep Drill Core Zones
6.4.1 Introduction
A major objective of this synthesis of data related to the geology of Taurus-Littrow is the determination of the exposure ages and, by summation, the deposition ages of the regolith ejecta zones in the deep drill core. This, in turn, would date the impacts that formed their 400-1400 m diameter source craters and would allow a graphical correlation between source craters diameter to depth ratios (a measure of relative age) and their total, post-impact exposure, i.e., formation ages.
Many craters less than 400 m in diameter would have contributed ejecta to the deep drill core; however, close examination of the raw Is/FeO data reported in §4 and in Table 13.1a indicate that the larger craters are the primary sources of regolith ejecta deposited in inter-crater areas. The focus here, therefore, will be on identified source craters 400-800 m in diameter as well as the ~1451 m diameter, MOCR Crater.
The two preceding sections (§§6.3.2 and 6.2.4, respectively) used Apollo 17 pairs of samples to make ∆Is/FeO / Myr estimates for (1) alpha+beta-only ∆Is/FeO / Myr = 0.58 / ppm U+Th for all zones and (2) solar proton-only ∆Is/FeO / Myr = 0.11 for zones S and T and ∆Is/FeO / Myr = 0.032 for zones U through Z+Z*. Table 13.11 combines these ∆Is/FeO / Myr values, ∆Is/FeO values from Table 13.1a, current U+Th contents, and a linear extrapolation of U+Th contents at each zone’s mean age of exposure to calculate estimates of zone exposure ages. The impact ages for each zone’s source crater (zone’s deposition age) are provided by the summation of preceding exposure ages. In making the age estimates given in Column 7 of Table 13.11, an initial iterative step was made using current U+Th contents in order to calculate a preliminary exposure “age” for each zone (Column 5). This preliminary “age” was then used to obtain a better estimate the mean age of exposure for each zone. This latter estimate, in turn, was used to calculate estimates of mean U+Th values that account for uranium and thorium alpha+beta decay and that then were used to improve the estimate of total ∆Is/FeO / Myr.

[Note: To preserve the methodology for developing Table 13.11, conclusions related to it can be found after Table 13.15, §7.3. This has been done in order to account for small additions to exposure ages given in Table 13.15, totaling ~61 Myr for 10 zones, necessary to compensate for ∆Is/FeO attenuation of nano-phase iron production (decreased measured ∆Is/FeO values) due to the presence of pyroclastic glass and ilmenite+oxides in deep drill core zones.]
Another issue related to alpha+beta reduction of Fe++ as a contributor to ∆Is/FeO is the question of how long does that contribution continue after a given zone is buried. Once new regolith ejecta buries a previously deposited zone, effects of solar wind proton radiation and small meteor impact mixing (gardening) ceases; however, the maturation effects of alpha+beta particle radiation from disseminated uranium and thorium would continue until all Fe++ within ~30-50 µ of alpha+beta particle sources has been converted to Fe° (nano-phase iron). Once gardening ceased and static conditions prevailed due to burial of each deep drill core zone, except surface zone S, the rate of Is/FeO increase would decline both due to shielding from solar protons and progressive conversion of nearby Fe++ to Fe° by alpha+beta particles. The question is “How significant is this post-burial maturation?”
4.5 MeV alpha particles from 238U have limited penetrating range, measured as <12 µ in silicate glass (Harvard, 2022). 12 MeV alpha particles from 232Th will penetrate somewhat further. Nonetheless, some finite increase in ∆Is/FeO values will occur after burial, as it is likely that some Fe++ is within reach of the radiation. The absence of unusually high values of ∆Is/FeO for the deeper (older) portions of the deep drill core in Table 13.1a shows that the effects of alpha+beta particle radiation ceases relatively soon once a regolith ejecta zone is buried.
Additionally, in the half-centimeter logging of deep drill core Is/FeO data provided by Morris (pers. comm.), the average increase in Is/FeO in buried zones’ top half-cm is 4.8 ± ~4 points. (This average does not include an increase of 18 points in a half-cm at the top of zone X that is apparently due to mixing with a more mature base of zone W*.) After applying each buried zone’s alpha+beta-only ∆Is/FeO / Myr (Table 13.11, Column 4) to each increase, the average increase in exposure age would be 5.2 ± ~4 Myr. As there are other unknowns, such as depositional mixing, related to this top half-cm, this low possible effect of post-burial maturation is close to the estimated error limit of ~4% and is not considered to be significant.
As a further test of this conclusion, Table 13.12 shows estimates of a hypothetical post-burial increase in ∆Is/FeO, using the value of 0.58 for ∆Is/FeO / Myr / ppm U+Th derived above (5 times greater than that for proton-only ∆Is/FeO / Myr). The hypothetical added ∆Is/FeO values in Column 6 are increasingly unrealistically high as compared to the measured ∆Is/FeO in Column 2, indicating that post-burial maturation ceases significantly below the hypothetically added ∆Is/FeO = 13 for zone T+T*. This addition would be ~0.27 per cm (13 / 47 cm) for the zone. Within zone T+T*, there are 14 cm with a constant Is/FeO = ~10, whereas if alpha+beta maturation had continued at 0.27 per cm, it would be expected to see an additional increase of almost 4 Is/FeO points over that 14 cm core length and this is not present in the half-cm logged data. Post-burial alpha+beta particle ∆Is/FeOA effects would show a steady increase throughout that part of the zone of which there is no sign, unless it were coincidentally included in the previously discussed balance between impact resets and ∆Is/FeO increases (§3). Possibly even more illustrative is the fact that zone U’s Is/FeO steady stepwise decrease from 53 to 12 (see Fig. 13.1c), while the hypothetical ∆Is/FeO post-burial increase would be 39 in Table 13.12.

The above approach to using sample derived ∆Is/FeO / Myr to estimate zone exposure ages seems logical; however, as a test of the exposure ages, they can be compared with the cosmic ray exposure ages determined by Eberhardt et al. (1974) for zones in the deep drill core. Before doing so, several detailed issues may need to be resolved before this ultimate goal can be reached. These issues include:
- How accurate is the core cosmic ray exposure data?
- How can the cosmic ray exposure of source crater pre-impact regolith be separated from that experienced post-deposition?
- How can ∆Is/FeO / Myr comparisons be made for zones W* and X* for which no cosmic ray exposure age is reported?
6.4.2 Evaluation of Deep Drill Core Cosmic Ray Exposure Ages
The determination in §6.2 that nitrogen isotopes in the deep drill core have been fractionated as a function of zone total maturity raised the possibility than noble gas isotopic fractionation might affect reported cosmic ray exposure age calculations. Further, as cosmic rays penetrate up to 40 ± 5 cm below the surface of the regolith (see Eugster et al., 1981), depending on regolith density, a modest correction for some exposure age data will be required. Both these potential adjustments are examined below.
6.4.3 Potential Fractionation of Light Isotopes of Noble Gas Spallation Products During Regolith Maturation
Cosmic ray induced spallation affects the concentrations of noble gas isotopes of helium, neon, argon, krypton and xenon, produced from spallation of barium (Ba), rubidium (Rb) strontium (Sr), yttrium (Y), and zircon (Zr) parent isotopes (David and Leya, 2019). Indigenous sources of 4He and Ar isotopes, however, exist in the regolith, complicating their use in exposure age determinations. 4He is a component of the solar wind and also is produced as alpha particles through decay of uranium and thorium. Further, some 39Ar comes from the decay of 40K. Given these facts, the spallation production of isotopes of neon, krypton and xenon are generally selected for exposure age dating.
A full discussion of these issues is beyond the scope of this Chapter, and the reader is referred to the review paper of David and Leya for additional information. Eugster et al. (1969) and Eberhardt et al. (1970) discuss the methodology for using noble gas spallation isotopes for exposure age dating in meteorites and lunar samples. Unfortunately, with the exception of Sr, analyses of the parent elements in the deep drill core 70001/9 are not available.
Eberhardt et al. (1974) reported cosmic ray isotopic ratios and exposure ages at specific depths of measurement for 9 of the 11 regolith ejecta zones in the deep drill core, if their age for 70181 is considered a surrogate for zone S, as discussed previously in §5.0. Only zones W* and X* have no corresponding cosmic ray age data.
A plot of the ratios 126Xe/132Xe (black points) and 124Xe/132Xe (red points) (Eberhardt et al., 1974) versus the Sr values (Meyer, 2012) given in Fig. 13.17a shows a possible linear correlation; but this possibility is very dependent on data from zone V+V*. Further, if Eberhardt et al.’s values for 126Xe / 132Xe are plotted against the Sr values given by Laul et al. (1978, 1979, 1980) (Fig. 13.17b), a possible trend is produced that appears opposite to that using Meyer’s Sr values. Clearly, this is an area of synthesis in need of deeper research and more extensive and precise compositional data.
 Fig. 13.17a. Deep drill core correlation of 126Xe / 132Xe (black o) and of 124Xe / 132Xe (red x) (Eberhardt et al. (1974) with Sr concentration from (Meyer, 2012).
 Fig. 13.17b. Deep drill core correlation of 126Xe/132Xe (Eberhardt et al. (1974) with Sr concentration from Meyer (2012) (black o from Fig. 13.12a(a??, or 13.14??) and from Laul et al. (1982, 1979, 1980) (red x).
End of Upload 12
Start of Upload 13
A plot of 124Xe/132Xe versus total Is/FeO in Fig. 13.17c further indicates that 132Xe increases with maturity, but the 124Xe/132Xe ratio remains constant. Similar relationships are apparent relative to 20Ne/22Ne v. total Is/FeO in Fig. 13.17d, although the scatter of points for the youngest regolith ejecta zones S and T to the right of the constant ratio line raises the possibility that the 20Ne/22Ne ratio in the solar wind has changed in the last hundred million years (see Table 13.15 for ages). The ratio of 20Ne/22Ne should be useful in determining exposure ages as there is no indication of the loss of 20Ne during maturation, as shown in Fig. 13.17d. (The indication of a constant 20Ne/22Ne ratio in Fig. 13.17d also suggests that the concentration of 25Mg (Caldwell, 2004) is so low that few alpha particle reactions with it occur that would produce 22Ne.)

Fig. 13.17c. Correlation of 132Xe and 124Xe/132Xe (Eberhart et al., 1974) with deep drill core zones total Is/FeO from Table 13.1a. Solar wind derived 132Xe content (black o) increases with Is/FeO (exposure) while cosmic ray spallation produced 126Xe scatters around a roughly constant 124Xe/132Xe ratio (red x) vs. Is/FeO.

Fig. 13.17d. Correlation of 20Ne and 20Ne/22Ne (Eberhardt et al., 1974) with deep drill core zones total Is/FeO from Table 13.1a. Solar wind derived 20Ne content (black o) increases with Is/FeO (exposure) while cosmic ray spallation produced 20Ne/22Ne scatters around a roughly constant ratio (red x) vs. Is/FeO.
78Kr, however, appears to be behaving differently from Xe and Ne isotopes. Fig. 13.17e shows that the ratio of spallation 78Kr versus 86Kr decreases with maturity and its integration with 126Xe/132Xe to get exposure ages, as apparently done by Eberhardt et al. (1974) would need to be evaluated further.
 Fig. 13.17e. Correlation of 86Kr and 78Kr/86Kr (Eberhart et al., 1974) with deep drill core zones total Is/FeO from Table 13.9. Solar wind derived 20Ne content (black o) increases with Is/FeO (exposure) while cosmic ray spallation produced 20Ne / 22Ne scatters around a roughly constant ratio (red x) vs. Is/FeO.
86Kr content increases with total Is/FeO (age) while the 78Kr/86Kr ratio decreases with Is/FeO, scattering around an Is/FeO / 78Kr/86Kr trend of about –6 × 10³. Based on this Is/FeO / 78Kr/86Kr trend, it would take a decrease of about 6 × 10³ in 78Kr/86–Kr to be equivalent to an increase in Is/FeO = 1. In spite of the loss of minor 78Kr indicated by the plots in Fig. 13.17e, the loss of 78Kr with maturation would not have an appreciable effect on cosmic ray exposure ages considered here.
The loss 78Kr during maturation, taken in the context of §6.2’s discussion of 14N loss relative to 15N, indicates that there are questions yet to be answered relative to loss (or gain) of volatile elements by the lunar regolith, especially taking into account the hundreds of millions of years involved in regolith ejecta zone maturation. Some of those issues may relate to affinities of some noble gases to form real or quasi-compounds with other elements exposed on the surfaces of regolith particles. For example, the apparent small 78Kr loss during maturation may relate to the formation and subsequent volatilization of a temporary, pressure stabilized, van der Waals compound, krypton hydride [Kr(H2)4] (Kleppe et al., 2014), possibly formed as a transient phase under the very local high pressures generated by macro- and micro-meteor impact. On the other hand, the absence of loss of 126Xe relative to 132Xe during maturation largely may be a simple consequence of the relatively large relative masses of Xe isotopes.
6.4.4 Depth Corrections for Post-Burial Additions to Apparent Cosmic Ray Exposure Ages
The decrease in the effects of cosmic ray spallation with depth in buried, un-gardened lunar regolith must be considered in the use of reported cosmic ray exposure ages. Eugster et al. (1981) conclude that this effect becomes minor at more than 80 g/cm2 (40 ± 5 cm, depending on density). This relationship is shown in the y = 1/t plot in Fig. 13.18, where “y” equals the effect of a continuous spallation process and “t “equals the thickness of overlying regolith that attenuates that effect.

Fig. 13.18. A y = 1/t plot related to attenuation of cosmic ray effects by overlying regolith, where “y” equals the effect of a continuous spallation process and “t “equals the thickness of overlying regolith.
Multiplying the measured exposure age by the value of “y” from Fig 13.18, for a given overlying thickness, gives the correction necessary for a given value of “t” less than 40 cm (core density = ~2.0; Carrier, 1974). The ages in Column 2 of Table 13.13 are the reported cosmic ray exposure ages and those in Column 5 are corrected for their post-burial depth of exposure as indicated in Column 4.

End of Upload 13
Start of Upload 14
7.0 Ilmenite and Volcanic Ash Attenuation of Nano-Phase Iron Formation During Regolith Maturation
7.1 Introduction
The synthesis provided by Schmitt (2014b) for Taurus-Littrow TiO2 vs. Is/FeO, and the absence of ∆Is/FeO values more than two (Morris et al., 1978) in all but the upper 5 cm of the 5-7 zones pure orange+black ash in core 74002/2, very strongly suggests that both ilmenite and glass-rich ash attenuate the formation of nano-phase iron and corresponding increases in ∆Is/FeO. Regrettably, the author has been unable to fully quantify the indications of these effects in the deep drill core, both of which would bias the ∆Is/FeO-based exposure ages calculated in Table 13.11 to lower than actual values. An attempt to determine this bias detailed below suggests the attenuation might have reduced the estimated 0.879 Ga for the total depositional age of the upper 2.85 m of the deep drill core by as much as 0.61 Ga.
In the following attempt at quantifying the ilmenite (oxide) and pyroclastic glass attenuation, it became clear that pyroclastic glass is the major factor. As drive tube 74001/2 ash contains 0.605 ppm U+Th (Nunes, 1974, with Th/U = 3.25), the Is/FeO data indicate that disseminated Fe++ and alpha+beta particles in glass (or solar protons if ash is exposed at the surface as it appears it has been several times) cannot interact with Fe++ for reduction of Fe++ to Feo.. The ash in the deep drill core 70001/9 consists of (1) orange+black, high TiO2 quenched glass (74220, FeO = 22 wt%); (2) residual clear glass in partially devitrified orange+black glass in which U and Th remain isolated from structural Fe++; (3) yellow/green, VLT glass bead in 70007 (Vaniman et al., 1979), VLT glass bead in 71501 (Zelner et al., 2009), and VLT scoria 78526 (Meyer, 2012); and (4) small amounts of brown/grey glass (origin unknown, but possibly ejected non-agglutinate impact melt). Unfortunately, available data on the volume percent of pyroclastic glass in the 10 complete zones of the deep drill core is not precise (§5.0) enough to make close estimates of its effects on the measured values of ∆Is/FeO.
7.2 Ilmenite Attenuation of Nano-Phase Iron Formation
Schmitt’s comparison of the maturity indices determined by Morris (1978) and corresponding TiO2 contents (Meyer, 2008) in 31 regolith samples from the valley of Taurus-Littrow (Fig. 13.19a) suggested to him that ilmenite (FeTiO3) has the effect of reducing the rate of regolith maturation. The total Is/FeO used in that comparison, however, included the assumption that the logged value of Is/FeOm (Table 13.1a) was the correct pre-deposition value for each zone. In §8.0, where deep drill core cosmic-ray exposure ages are compared with logged Is/FeOm values, it is shown than these values have been reset by 76-96% (Table 13.16) by the impact shock of source crater formation. Not knowing the true value of the total exposure Is/FeO for the surface samples included in the Schmitt (2014b) synthesis invalidates its conclusion that ilmenite attenuates maturation.
 Fig. 13.19a. Plot of maturity indices (Morris, 1978) vs. TiO2 content (Meyer, 2012) of surface regolith samples from the valley of Taurus-Littrow, showing a strong influence of TiO2 content over 7 wt% over the measured amount of maturation (Is/FeO) (Schmitt, 2014b).
On the other hand, the plot of ∆Is/FeO vs. TiO2 for the deep drill core zones in Fig. 13.19b suggests, but does not prove, that Schmitt may have stumbled onto something. The problem in Fig. 13.19b is that the high TiO2 zones S, T+T* and U are also low exposure zones (less than 100 Myr each from Table 13.11) relative to the low TiO2 zones W through Z+Z*. The possible correlation with low exposure age might break down with low exposure zones V+V* and X*, however, these two zones, along with all the zones with higher exposure ages, have less ilmenite. They have reported modal% “opaques” at 2.7% or less versus modal% “opaques” = 3.0-4.0% for zones S, T+T* and U (Vaniman et al., 1979). (“Opaques” in lunar materials would be almost entirely ilmenite (Heiken et al., 1991).
In light of these various hints, it may be justified to assume that ilmenite attenuates maturation at some level, if only due to its high density (4.2 g/cm) relative to other minerals and agglutinate components of the regolith; however, final confirmation of this assumption must await more detailed data and its synthesis.
[As the TiO2 content of pure ilmenite is ~53 wt%, the maximum vol.% of ilmenite in a sample can be estimated by multiplying the measured TiO2 by 1.89, assuming titanium incorporated in other minerals, particularly clinopyroxene, is less than 5.8 wt%. Thus, with a TiO2 = 7.5 wt% (Laul and Papike, 1980) the type regolith sample from Apollo 11, 10084, could contain ~3.2 vol% ilmenite vs. the reported modal% of “opaques” = 1.1 reported by Simon et al. (1981). The same calculation applies to zone S.]

Fig. 13.19b. Plot of TiO2 concentration (Laul et al., 1978, 1979, 1981) (Tables 13.8aa-kk) versus ∆Is/FeO from Table 13.1a for samples of deep drill core zones. Exposure ages from Table 13.11.
7.3 Pyroclastic Ash Attenuation of Nano-Phase Iron Formation and Corrected Deep Drill Core Ages
Is/FeO values are less than 2 below 5 cm in 100% pyroclastic ash sampled by drive tube 74001/2. As this ash contains 0.605 ppm U+Th (Nunes, 1974, with Th/U = 3.25), these data indicate that disseminated Fe++ and alpha+beta particles in glass cannot interact for reduction to Feo. Lack of interaction with solar protons would also be the case for glassy ash exposed at the surface. The ash in this core consists of (1) orange+black, high TiO2 quenched glass (74220, FeO = 22 wt%) and (2) residual clear glass in partially devitrified orange+black glass in which uranium and thorium remain isolated from structural Fe++ in crystallites. Also, other regolith samples and the deep drill core contain yellow/green, VLT glass (70007 VLT bead and 78526 VLT scoria), and small amounts of brown/grey glass (origin unknown, but possibly non-agglutinate impact melt).
The methodology used to estimate the exposure ages in Table 13.11 includes the use of ∆Is/FeO / Myr / U+Th = 0.58 plus the solar proton only ΔIs/FeO / Myr = 0.11 (zones S and T+T*) or 0.032 (zones U to Z+Z*), derived in §6.3. U+Th values are corrected for age-related decay. As per the evidence from drive tube 74001/2, however, alpha+beta radiation from the U+Th contained in the pyroclastic ash was almost fully attenuated relative to any alpha+beta contribution to an increase in ∆Is/FeO. The calculated zone exposure ages in Column 7 of Table 13.11, therefore, are lower than their actual exposures by an amount proportional to the ash content (wt%) in a given zone, that is, actual ∆Is/FeO / Myr values are less than the calculated values of ∆Is/FeO / Myr given in Column 7 of Table 13.11 because of the presence of the effectively inert U+Th in pyroclastic ash.
[The primary, quenched glass in the orange pyroclastic ashes would have uranium, thorium and iron disseminated in solution rather than concentrated in crystals, and it largely would have prevented alpha+beta particles from interacting with Fe++ to produce Fe°. The glass also would limit solar proton access to dissolved Fe++ at grain surfaces. The secondary, residual glass in the black, partially devitrified ashes would be depleted of Fe++ due to mafic crystallite formation; however, incompatible uranium and thorium atoms would remain dispersed in the glass matrix.]
The graphical effect of the attenuation of ΔIs/FeO / Myr as a function of the estimated wt% of pyroclastic ash in each zone is shown in Fig. 13.20, where the §5 modeled ash weight percentages (Tables 13.8aa-kk) are plotted against zone ∆Is/FeO / Myr (Table 13.11). The trend of the plotted modeled data in Fig. 13.20 is “∆Is/FeO / Ash wt% = −0.025”, and that trend is used in Table 13.14 to calculate the excess ΔIs/FeO / Myr resulting from the presence of pyroclastic ash, primarily due to the fact that significant uranium and thorium have been made inert by dissemination in glass in the ash. Estimates of the modeled ash contents (wt%) have been improved in Column 2 of Table 13.14 by their projection to the trend line in Fig. 13.20. The scatter of points around this trend suggests that there is about a ± 5 wt% error in the addition of ash to the compositional models in §5 (Tables 13.8aa-kk).
As in the case of TiO2 (ilmenite) related attenuation, statistics underlying Fig. 13.20 are poor and the scatter of points is significant. This scatter probably relates to inaccuracy in modeling ash content of the various zones; however, a rough trend line of about ∆Is/FeO / Myr Ash % = −0.025 is indicated. Projecting that trend line to zero ∆Is/FeO / Myr indicates that no nano-phase iron would be produced above an ash content >58 wt%. Such a concentration of ash would appear to be sufficient to prevent alpha+beta and solar proton radiation reaching the Fe++ in non-glassy particles.
A comparison of Taylor et al.’s (1979) modal percentages (thin section point counts) of partially devitrified “black glass” (Fig. 13.10b) and Vaniman et al.’s (1979) model percentages “orange/black glass” and “yellow/green glass” do not closely track those estimated in the §5 modeling plotted in Fig. 13.20. Taylor et al.’s modal percentages, however, only represent grain sizes between 0.02 and 0.2 mm (20-200 µ) and do not include about 30% of the ash present in samples, specifically ash particles below 0.02 mm (20 µ) (Graf, 1993). The modeled ash contributions in Tables 13.8aa-kk of §5, on the other hand, reflect bulk compositions that would include the particles below 0.02 mm.
 Fig. 13.20. Variation of ∆Is/FeO / Myr values from Table 13.11, col. 4, relative to compositionally modeled pyroclastic ash contents (black trend line) (§5.0, Tables 13.8aa-kk).
Evaluation of the impact of inert pyroclastic ash on the calculations given in Table 13.11, largely depend on the U+Th content that did not contribute to maturation through alpha+beta decay. The U+Th content of orange+black ash 74220 is reported as 0.874 ppm (Silver, 1974). Unfortunately, specific analyses for uranium and thorium in the 70007 VLT ash bead use in §5 modeling have not been found, nor do such analyses appear to be available of potential VLT surrogates such as green glass scoria 78526 (Meyer, 2012) and the VLT ash bead in 71501 studied by Zellner et al. (2009). A potential surrogate green glass ash from Apollo 15, 15426, has “handpicked” green glass analyses that suggest very low U+Th contents of 0.2-0.3 ppm (Meyer, 2012).
Haggerty et al. (2009), however, report analyses for green ash glasses from regolith breccia 79135 obtained at the rim of Van Serg Crater. They indicate Th content varies from 0.42 to 0.73, ppm, from which they derive U content as 0.11-0.20 ppm, indicating an Th/U ratio of 3.82 to 3.62. As the highest Th value they report is consistent with the hypothesis (§10.6) that Apollo 17 VLT magma was a late differentiate of ilmenite basalt magma (Th = 0.766 ppm for ilmenite basalt-rich zone T+T*; Silver, 1974), the use of Silver’s Th/U ratio of 3.29 may be more appropriate. This would give a U content of 0.13 to 0.23. These results give a VLT U+Th value of 0.55 – 0.96 ppm or a mean of ~0.75 ppm for sample 70007.
End of Upload 14
Start of upload 15

Using the U+Th values for the ash components of the deep drill core zones of 0.87 ppm for 74220 and 0.75 for 70007 bead, Table 13.14, column 6, gives the determination of the excess ∆Is/FeO / Myr for deep drill core zones, based on the combined wt% of orange+black and VLT ashes.
Table 13.15 uses the excess ∆Is/FeO / Myr amounts from Table 13.14 to calculate revised values for zone exposure and deposition ages (column 5) and concludes that the total time that the deep drill core records over 2.85 m and 10 regolith ejecta zones is 0.951 Ga. This represents a deposition rate of ~3.00 m per billion years. Measured against the 3.82 Ga youngest age for the last basalt eruption, this rate indicates that the regolith at the core site is ~11.5 m deep (3.82 Ga. × 3.00 m/Ga).

The lower values of ∆Is/FeO / Myr in Column 3 of Table 13.15, with the exception of zone T+T*, are roughly compatible with the values calculated in Table 13.11, Column 6. The major increase in ∆Is/FeO / Myr that results for zone T+T* (0.85 vs. 0.69) may be the result of several factors, such as:
1. Zone T+T* is the deep drill core’s least mature regolith ejecta zone (Fig. 13.1a) and its relatively high frequency of large fragments and relatively low frequency of fine fragments (Graf, 1993, 70008, 24-8-46.8 cm) suggests that maturation failed to reach a steady state in which sources of alpha+beta radiation were uniformly distributed throughout the zone. This circumstance would reduce the rate of formation of nano-phase iron and the measured value of ∆Is/FeO for the zone.
2. The originally assumed U+Th value for zone T+T* of 0.999 ppm at 26 cm (Silver, 1974) is too low for the entire zone and Silver’s alternative value of 1.459 ppm at 28 cm should be assumed. (See Table 13.1b, column 3, for other indications of U+Th variability in zone T+T*.) This change would increase the alpha+beta only ∆Is/FeO / Myr from 0.58 (Table 13.11, Column 4) to 0.76 (∆Is/FeO / Myr = 0.58 / ppm) and the total ∆Is/FeO / Myr to 0.85 (added proton-only ∆Is/FeO / Myr = 0.09). The second, red plot for T+T* in Fig. 13.20, and related adjustments, indicate the effect of this change in U+Th content.
[Increases in ∆Is/FeO are not resolved in the half-cm logging of the raw Is/FeO data for the deep drill core (Morris, personal comm.) that shows 15 cm (31.05 to 46.05 cm) of Is/FeO measurements equal to ~10 (Fig. 13.1a) in which partial reset decreases and increases in Is/FeO are not resolved. If the average ∆Is/FeO increase of 0.510 / cm for the 284 cm core (Table 13.7) is applied to this 15 cm, the ∆Is/FeO would be about 8, increasing zone T+T* total ∆Is/FeO from the logged 24 (Table 13.1a) to 32. Also, such small, individual increases largely would not be resolvable in the raw, half-cm data.]
[Normalizing to U+Th content in column 4 of Table 13.15 tests the consistency of calculations leading to vales of ∆Is/FeO / Myr. The similar values in this test support the validity of those calculations, as alpha+beta radiation is the dominant factor in creating nano-phase iron and determining ∆Is/FeO values. The difference between normalized values for zones S and T+T* and those of older zones is the result of higher solar proton radiation during exposure of those two zones.]
A deposition age of about 0.951 Ga for 2.85 m calculated in Table 13.15 indicates an approximate regolith ejecta deposition rate of ~3.00 m per Ga. As the regolith has been accumulating since 3.82 Ga with the final eruption of the ilmenite basalt lavas, the depth of regolith at the deep drill core site would be about 11.4 m. The available direct evidence for regolith depth from LROC images (Lunar QuickMap) of impact craters near the core site is as follows:
1. Rudolph Crater, 75 m west northwest of the core site, is ~50 m in diameter and ~8 m deep. Its very flat floor, presumably the relatively coherent current top of underlying basalt bedrock, indicates regolith plus rubble depth there was less than 8 m, but close to the 11 m depth suggested above.
2. An unnamed crater, 140 m north of Rudolph and 270 m northwest from the core site, is ~33 m in diameter and ~2 m deep. Its floor is roughly a point rather than flat, indicating that the regolith depth there was more than 2 m.
It is important to recognize that the original surface of the basalt that partially filled the valley of Taurus-Littrow was very irregular in its topography. This is certainly the case with terrestrial basalt flows and would be accented on the Moon by the 1/6 Earth-gravity field and flow eruption and cooling sequences.
The revised age estimates given in column 7 of Table 13.15 suggest the following tentative conclusions:
1. The deep drill core sampled about one billion years of lunar history, that is, ~0.951 Ga in 2.85 m of regolith ejecta accumulation. This is very roughly consistent with estimates based on independent data of about one billion years for the total core by Curtis and Wasserburg, 1975; Crozaz and Plachy, 1976; Drozd et. al., 1977; Blanford, 1980).
2. The rate of the local inter-crater regolith accumulation is ~3.00 m per Ga (2.85 m / 0.951 Ga).
3. A 39-40Ar age of 3.82 Ga (Schaffer et al., 1977) for a sample of the youngest eruption of ilmenite basalt in Taurus-Littrow indicates that the local inter-crater regolith at the core site is ~11.4 m deep (3.82 Ga × 3.0 m). This is well within the average depth of regolith of <25 m indicated by the results from the Apollo 17 Active Seismic Experiment (Kovach et al., 1973) and the ~20 m depth indicated by the Surface Electrical Properties Experiment (Simons et al., 1973), both of which gathered data west of the core site. Variations in various depth estimates may reflect the effects of a rubble zone on top of a highly fractured and a topographically irregular flow top that biases the geophysical returns toward a thicker apparent regolith.
4. The 58 Myr exposure age of deep drill core zone S is roughly consistent with the interpretation of neutron probe data (Curtis and Wasserburg, 1973) that a late ejecta deposition of material with 50 g/cm2 occurred <50 Myr ago. The equivalent zone S compacted thickness is 20 cm and its in situ thickness is about 35 cm. At a density of ~2 g/cm3 (Carrier et al., 1992) this equates to ~40 to 70 g/cm2, consistent with that from the neutron probe.
5. The 3.4 times increase in solar wind energy prior to zone T+T* deposition appears to have occurred prior to 96 Myr years ago and may have a long-term association with the change in solar wind δ15N‰ to –118‰ after about 514 Myr ago (after zone W*, §6.2.2).
6. A previously suggested age of Camelot of 500 ± 150 Myr (Schmitt et al, 2017), based on estimates of rates of topographic erosion, appears to be too high by about a factor of two. Based on the estimate in Table 13.15, Camelot, as a source crater for zone V+V*, formed at about 284 Myr ago.
7. Regolith ejecta from impact craters older than Cochise and Shakespeare (zones Z+Z* and Z**), such as Snoopy, SWP, SH and WC in Table 13.3a, largely became masked by about 1.0 Ga due to a combination of impact erosion, younger crater ejecta blanket deposition, mass-wasting, and varying thicknesses of the local regolith ejecta cover.
8. Although statistics are very limited, the average exposure age, and thus the average frequency of 400-1400 m crater formation, of the 3 youngest zones, excluding zone U, is ~71 Myr versus that of 5 older zones, excluding zone X*, of ~122 Myr. Zone X* has not been included in the oldest group as having an anomalously young exposure age of 56 Myr.
8.0 Comparison of Deep Drill Core Zone, Is/FeO-based Exposure Ages with Integrated Cosmic Ray Exposure Ages
The presence of defined regolith ejecta zones in the core indicates, by extension, that such stratigraphy exists in inter-crater areas outside the reach of near-source crater ejecta blankets (~one crater diameter). Large impacts initially excavate local regolith, creating the parabolic regolith ejecta arches as discussed in §3.3. Ballistic and volatile turbulence in parabolic arches appears largely to integrate the cosmic ray exposure ages as well as compositions of the all zones making up the pre-impact regolith. The turbulence in the ballistic ejecta sheath likely results from slight differences in the velocities and trajectories of individual particles, augmented by the agitation release of solar wind volatiles that then would be entrained in the regolith ejecta. After each sequential impact capable of forming a 400-1500 m diameter crater, the ballistic integration process is repeated, creating a new regolith ejecta zone that become a part of the regolith stratigraphy in inter-crater areas within about 5 or 6 km of the the source crater impact.
[Turbulence in the parabolic arch does not eliminate all petrographic heterogeneity (see Fig. 13.11; Taylor et al., 1979; Vaniman et al., 1979), suggesting that integrated mixing is confined largely to the finer fractions of the ejected regolith. In this regard, over 75% by mass of the regolith ejecta is made up of particles less than about ~150 µ (Graf, 1993). Agitation released volatiles from surfaces of the fines also probably play a role in the integration of the fines.]
Local impact gardening and redistribution of each exposed regolith ejecta zone after deposition also enhances uniformity and, apparently, continuously develops a uniform cosmic ray exposure age through out the zone. This uniformity is suggested by the two similar cosmic ray exposure ages (610 and 550 Myr; Eberhardt et al., 1974) reported for zone Y+Y* at different depths, assuming that error limits (average ± ~40 Myr, Eugster et al., 1977) are comparable to those given in Table 13.5 in §4.0.
There remains a question as to why the detailed petrographic analyses of Vaniman et al. (1979) and Taylor et al. (1979) do not show more uniformity, although the major variations shown are generally consistent with the zone delineations made above. Also, all but one zone (W) have more than one chemical analysis by Laul (§5), and those compositions are very similar to each other within a given zone. The answer to this question may lie in the fact that petrographic integration of particles of the size counted in thin sections would be more difficult in the parabolic time available than would be the integration of intensive variables, such as previous zone cosmic ray exposure ages and bulk composition carried by the fines <150 µ.
Each corrected cosmic ray exposure age in column 5 of Table 13.13, therefore, can be assumed to be the integration of the cosmic ray exposure ages of all the regolith ejecta zones that existed to the excavated depth of regolith at the site of their respective source crater, plus each zone’s post-deposition exposure age (column 5, Table 13.15). If the ∆Is/FeO-based exposure age for a given deep drill core zone is subtracted from the total cosmic ray age, the remainder is the integration of the exposure ages of the ejected zones. A question remains about how deep does a large crater excavate local regolith. Although much smaller than the large source craters, the flat floor of Rudolph Crater suggests that regolith is ejected down to the major change in geotechnical parameters.
The logging of each regolith ejecta zone in the deep drill core might give an indication of the maturity index of that zone at the time of deposition (Is/FeOm in Column 3, Table 13.1a). These pre-existing indices can only be estimated to within about 5 points in the half-cm log of Is/FeO raw data discussed in §4.2. The exact value for Is/FeOm is obscured by the probable Is/FeO resets caused by the source crater impact as well as by the post-deposition interaction of impact induced Is/FeO resets and Is/FeO increases between resets. The indicated total cosmic ray exposure age of a given core zone, if correct, would include the ∆Is/FeO-based exposure age for the zone (Table 13.16, Column 3); however, the difference between this total and the post-deposition exposure age would give an independent value for the zone’s deposition Is/FeOm.
End of Upload 15
Start of Upload 16

Table 13.16 compiles the data necessary to extract the following conclusions about the pre-deposition source regolith using reported cosmic ray exposure ages:
1. Subtraction of the ∆Is/FeO-based exposure age for a given deep drill core zone (Column 3) from the total cosmic ray exposure age (Column 4) gives the integrated exposure ages of the ejected, pre-source crater regolith stratigraphy (Column 5).
2. A comparison of a deep drill zone’s logged Is/FeOm ages for initially deposited regolith (Column 4) with the integrated exposure ages of pre-source crater regolith (Column 5) indicates 77-96% resetting of pre-impact Is/FeOs has resulted from the source crater impacts (Column 5).
3. An estimate of the depth of ejected, pre-source crater regolith (Column 5 red figures) for each zone can be made by dividing both the zone’s total, pre-burial exposure age (pre-source crater integrated exposure age) (Column 5) by width-weighted integrated exposure age of the deep drill core (104.3 Myr) for the deep drill core depth through zone Z+Z* (2.85 m). This estimate equals 36.6 Myr per meter. The results of these calculations range from 14.3 to 6.3 m (Column 5 red figures) for the pre-source crater impact depth of regolith. These values are consistent both with previous estimates of a 11.4 m regolith depth at the deep drill core site and with the variable geological locations of source crater impacts.
4. The pre-source crater impact regolith depth associated with zone V+V* (14.3 m) probably reflects, respectively, (1) the core site being within one crater diameter of source crater Camelot and (2) deep, pre-source crater regolith due to the superposition of post-basalt regolith on pre-basalt Sculptured Hills regolith.
A plot of the ratio of zone width to core distance from its source crater against ejected regolith volume (Table 13.17; Fig. 13.21) shows: (1) source craters of various ages that are within ~2 km or outside ~3 km of the core site (Crater Cluster and Sputnik, Horatio and Nemo Craters, respectively) deliver relative thin regolith ejecta thicknesses (Group A); (2) source craters of various ages that are within 2.5 and 3.0 km of the core site deliver relatively large regolith ejecta thicknesses (Group B), confirming the earlier conclusion in Fig. 13.8; (3) the 1451 m diameter source crater MOCR Crater for zone S falls outside the systematics of the 400-800 m diameter source craters; and (4) the A and B groupings of craters in Fig. 13.21 are consistent with the parabolic ejecta sheath hypothesis proposed in §3.3.

 Fig. 13.21. Plot of the ratio of zone thickness to core distance from its source crater against ejected regolith volume (Table 13.16, col. 5).
End of Upload 16
Start of Upload 179.0 Rate of Impact Is/FeO Resets Recorded in Deep Drill Core Apollo 17 Neutron Probe Stratigraphic Interpretation of Deep Drill Core
9.1 Rate of Impact Is/FeO Resets
Combining the estimates of exposure ages in Table 13.15, Column 5, with the number of impact resets of Is/FeO in Table 13.5 provides a rough measure of the meteor flux causing resets at Taurus-Littrow over the last 0.951 billion years. Table 13.18 gives an estimate of a reset every 5.8 ± ~1.6 Myr, not including the low rates for zones W* and X* or the probable high rate for zone T+T*. The impact rates suggested for these zones may reflect actual times of anomalous decreased impactor flux or just increased uncertainty in their exposure ages, as noted previously. The variations in the dynamics of the Solar System that would result in flux variations might reflect the interactions of Jupiter with the Main Belt Asteroids.

[The inclusion of zone U in the average of reset frequency may be coincidence as there is strong evidence (§5) that this zone was deposited as a consequence of the simultaneous impact of four cometary objects (hemispherical source craters Steno, Emory, Faust and Sputnik) and that its flux of “Is” reset impactors included cometary debris.]
9.2 Apollo 17 Neutron Probe Stratigraphic Interpretation of Deep Drill Core
Curtis and Wasserburg’s (1975) interpretation of stratigraphic variations in the neutron exposure of the deep drill core tend to roughly support the zone stratigraphy and ages given in Table 13.15. They report the following:
- An upper ~52 cm of the core at ~100 g/cm2 that is well mixed with an estimated exposure age of 100-200 Myr with average fluence of 2.3×10¹⁶ n/cm2, (The depth estimate uses an average regolith density = 1.91 g/cm3 (Heiken et al., 1991, their Table 7.14) to convert g/cm2 to depth.). This depth is roughly consistent with the combined zones S and T (~51 cm in Table 13.1a, including the 4 cm mixed zone between, and combined exposure ages of 96 Myr in Table 13.15). If Curtis and Wasserburg’s data actually includes zone U, the combined exposure ages at 197 Myr would be well within their given range of 100-200 Myr.
- An intermediate ~210 cm thick unit at 100-500 g/cm2 or thicker with average fluence of 3.5 × 10¹⁶ n/cm2 and that is poorly mixed. (The thickness estimate uses an average regolith density = 1.84 g/cm3 (Heiken et al., 1991, their Table 7.14) to convert g/cm2 to depth.) This would roughly include zones U-Y+Y*. These five zones have highly varied maturity and petrography and are made up of regolith ejecta of mixed compositional parentage.
- A deep layer of lightly irradiated materials (<1016 n/cm2) that would be ~30 cm thick and roughly include zones Z+Z*and Z**. The reduced irradiation may be the result of less exposure to neutron fluence relative to zones higher in the core.
10.0 Geology and Maturation of Orange+Black Ash at Shorty Crater
10.1 Geological Context of the Orange+Black Ash Deposit
The discovery, examination, imaging, sampling and post mission analyses of a deposit of orange and black pyroclastic ash on the rim of the 110 m diameter Shorty Crater (Schmitt 1972, 1973, 2014b) has provided detailed insights into apparent ash deposits lunar mappers previously only inferred to be present through analysis of images obtained from Earth and lunar orbit (Wilhelms, 1983). Synthesis of various studies of sample 74220 from a half-trench dug across the deposit and of a 70 cm drive tube core (74001/2) of the ash deposit, show that the deposit was the result of at least 5 and possibly 7 separate pyroclastic eruptions that took place between ~3.82 and 3.60 billion years ago.
Orbital images (Wolfe et al., 1987) as well as regolith samples from elsewhere in Taurus-Littrow (§5.0) indicate that the erupted ash covered thousands of square kilometers in the region. Over the last 3.6 billion years, has been incorporated into most of the regolith materials sampled (Meyer, 2012). As will be discussed in §11.0, the specific ash sampled at Shortly Crater fortuitously was protected from such redistribution by a subsequent ejecta blanket of light gray regolith (samples 74240 and 74260) from an impact that formed Fitzgibbon Crater about 24 Myr after the last ash eruption (Eugster et al., 1981).
The orange+black pyroclastic ash deposit resulted from repeated pyroclastic eruptions over a period of at least 127 Myr (Eugster et al., 1981). These eruptions occurred between the last basalt lava eruption at 3.82 ± 0.04 (Schaeffer et al., 1977) and the last ash eruption at 3.60 ± 0.05 (Huneke, 1978). The 70 cm drive tube core provides a continuous section of ash strata without clearly identifiable regolith development between ash depositions. An X-ray image (Meyer, 2012) of the unopened drive tube shows a full, “72 cm” tube (this dimension is in error as the double drive tube maximum length is 70 cm). After extrusion during curation, however, the final core measured 66.3 cm (Nagel, 1978), a compression of 3.7 cm.
[In order to compare apples with apples, this synthesis generally will use 39-40Ar ages as reported, realizing that the 40K decay constant, an essential component in 39-40Ar age dating, has been re-evaluated (Carter et al., 2020; Noumenko-Dezes et al., 2018; Renne et al., 2010). For what is interpreted here as the last ilmenite basalt lava eruption in the valley, Mercer et al. (2015) recalculated Schaeffer et al.’s (1977) 39-40Ar age of ~3.82 ± 0.05 Ga to 3.795 Ga for 70215, a 0.52% decrease; however, the relative differences in 39-40Ar ages constitute the main points in these following discussions.]
This synthesis has identified 5-7 orange+black ash layers within 74001/2, based on comparisons of the X-ray image given by Meyer, the descriptive work of Nagel (1978), and grain size data of McKay et al. (1978) and Graf (1993). The major, well-defined units from younger to older (top to bottom in core), and using the extruded core length of 66.3 cm, are as follows (Fig. 13.22a):
- Unit 5 (0-12 cm): 60-90% orange ash.
- Unit 4 (12-25 cm): Largely black ash (15-25% orange ash).
- Unit 3 (25-37 cm): Weakly stratified black ash (~15% orange ash).
- Unit 2 (37-54): Massive black ash (~5% orange ash). From major differences in cosmic ray exposure ages and slight variations in internal stratigraphy, Unit 2 appears to be the result of three separate eruptions (2, 2a and 2b).
- Unit 1 (54-66+ cm): Massive black ash (~5% orange ash) with reversed ash particle grading (large to small with depth) in “weakly stratified” portions. The X-ray image artist indicates a lighter image response to x-ray than for units 2-5.
From this synthesis, it appears that the core 74001/2 penetrated upright units 5 through 2 before crossing the partially overturned axial plane of an anticlinal fold in unit 2 and then into a portion of Unit 1 (see Fig. 13.22b). Folding and overturning of the deposit was the result of radial forces generated by the Shorty Crater impact. It is not known, of course, if older eruptive ash units exist below unit 1; however, the Hasselblad image (AS17-137-20994, Fig. 13.22c) of an estimated ~0.5 m thick, black ash layer in the 15 m vertically high north wall (Lunar QuickMap) of Shorty Crater suggests that the 70 cm drive tube core would have penetrated the original thickness of the deposit of ash strata had it not entered the axial area of unit 1 (see Figs. 13.22b,c). It would appear, then, that unit 1 is probably the first ash to be deposited.
 Fig. 13.22a. Stratigraphy and exposure ages (Eugster et al., 1981) of core 74001/2 (after Negal, 1978).
 Fig. 13.22b. Schematic cross-section of orange+black pyroclastic ash deposit at Shorty Crater (Station 4) in relation to drive tube core 74001/2 and sample 74220.
 Fig. 13.22c. The color corrected version of AS17-137-20994 showing the inclined black ash streak at the top and upper middle of the northern wall of Shorty Crater above the fiducial cross (from Fig. 11.108a in Chapter 11, Schmitt, 2024b).
The depositional context of the orange+black ash deposit at Shorty Crater is intriguing on a number of levels. At least five individual eruptions over at least 127 Myr are indicated by (1) the sum of the cosmic ray exposure ages reported by Eugster et al., (1981) and Eberhardt et al. (1974) (Table 13.18), and their correlation with apparent petrographic variations suggested by Nagel’s (1978) report; (2) the x-ray pre-extrusion image (Meyer, 2012); and (3) grain size variations (Graf, 1993). This estimate, of course, does not include Unit 5’s exposure age (24 Myr) prior to its burial by regolith ejecta from Fitzgibbon Crater or the ages of potential older deposits below Unit 1. If the possible two additional eruptions suggested as part of Unit 2 (2a and 2b) are included, based on an average exposure age of Units 2-4 being ~26, this eruptive period extends to a possible 179 Myr. 179 Myr would consume most of the ~220 Myr between the last basalt eruption at 3.82 Ga and the last ash eruption at 3.60 Ga.
End of Upload 17
Start of Upload 18
Column 5 of Table 13.19 are the reported concentrations of zinc at various levels in core 74001/2 (Blanchard and Budahn, 1978). The variations may indicate an increase in volatiles late in the eruptive period; however, some zinc would be lost during impact gardening between eruptions.
10.2 Regolith Development on Ash Deposits
In spite of exposure of each new ash deposit to space for tens of millions of years, Is/FeO values are near zero throughout all but the youngest deposit (Morris et al., 1978; Fig. 13.23, below) and petrographic data do not indicate any compositional variations at the top of ash units other than the topmost unit 5 (Blanchard and Budahn, 1978; Meyer, 2012). As Is/FeO is a product of both solar wind proton and alpha+beta decay radiation, this fact reflects an extreme example of both the absence concentrated crystallographic Fe++ in glassy orange ash and the continued dissemination of uranium and thorium in the residual glass of partially devitrified ash. Both distributions result in very low rates of conversion of Fe++ to nano-phase iron by either proton or alpha+beta radiation (see §10.1,Table 13.19, Column 4; Fig. 13.23).
 Fig. 13.23. Is/FeO in drive tube core 74001/2 that sampled the orange+black pyroclastic ash deposit in the rim of Shorty Crater (after Morris et al., 1978).
The Is/FeO values are up to 3.6 in the upper few cm of the youngest ash unit (Unit 5), in contrast to being near zero for the rest of the 66 cm drive tube core. This indicates contamination in the upper portion of Unit 5 from the light gray regolith that buried it. Non-ash particles (agglutinate+basalt+low grade breccia) are reported as 6% in 74220 (Heiken and McKay, 1977) and as 18% in the top of core 74002 (McKay et al., 1978) No such contamination is reported by Nagel for lower units in core 74001/2. The reported cosmic ray exposure ages for the non-core sample of Unit 5 (74220) vary from 27 Myr (Hintenberger et al., 1974) to 30 Myr (Kirsten et al., 1973) to 32 Myr (Schaeffer and Husain, 1973). Eugster et al. (1981) reported 42 Myr for the top 1 cm of core 74002 and 24 Myr at both 7 and 14 cm. If Unit 5 contains ~12% light gray regolith (average of the reported 6% and 18%) with a cosmic ray exposure age of about ~160 (Eugster 1985; see §4.2 and Table 13.5), this would be equivalent to an additional ~19 Myr, and, if added to the 24 Myr measured at 7 and 14 cm, it would move the age close to Eugster’s 42 Myr value for the contaminated 1 cm at the top of the core.
The ~46 Myr exposure age for the oldest sampled ash deposit, Unit 1, if it is also the first deposit, when compared to the ~25.5 ± 3.5 Myr average exposure ages for younger units may indicate that, after an extremely large initial eruption, the magma/volatile system settled into periodic eruptions about every 25 Myr.
The two sets of identical cosmic ray ages for the lower portion of Unit 5 (24 Myr) and for Unit 3 (30 Myr) taken as different depths, along with the similar ages at different depths in Unit 1, suggest that impact gardening integrated the depth variations in the exposure age of each ash deposit and that the gardening rate was rapid enough to make the measured exposure age about the same at every depth in those units. With some depth-weighted (y =1/x) reduction for post-burial, attenuated exposure, the ages in Column 3 of Table 13.19 probably are close to the actual exposure ages. The total exposure age for Units 1-4 of ~127 Myr would represent the minimum length of the eruptive period. If the existence of two additional sub-units in Unit 2 is correct, and an average exposure age of 25 Myr is added to this 127 Myr for those two sub-units, the minimum eruption period would be ~177 Myr.
As noted above, the lack of significant values of Is/FeO in the 74001/2 core (Morris et al., 1978) can be explained by the dominance of volcanic glass in the core. Regolith formation on the ash units after each eruption, therefore, would have been almost solely by micro-meteor impact, the effects of which would be largely indistinguishable from the glass, glass shards, and scoria in the primary ash. The absence of measurable variations in maturity between the units’ Is/FeO values also indicates that micro-meteor impact has had no significant effect on Is/FeO values.
A very detailed, continuous size-frequency/fragment characterization profile of core 74001/2 might confirm the tops of each five to seven ash deposits. For example, the relative proportions of fine and coarse ash particles with depth should change during exposure to the micro-meteor flux. As a preliminary check on the possibility of seeing an effect of commutation by micro-meteor impacts, Fig. 13.24 shows a plot of the ratios between <20 µ and 45 µ (o, o) points) and the <20 µ and 90+150 µ (x) size fractions from various depths as determined by D. S. McKay (Graf, 1993).
 Fig. 13.24. Grain-size frequency trends in ratios for <20µ / 45µ (o, o) and <20µ / 90+150 (x) in the double drive tube core 74001/2 into the orange+black ash deposit at Shorty Crater and for bulk sample 74220, based on D. S. McKay’s data in Graf (1993). The horizontal dotted line shows the possible consistent ratios for the tops of units 2-5.
The plots in Fig. 13.24 suggest the following:
- Although the plot indicates that the ash from successive eruptions tended to become relatively finer, it does not give unequivocal confirmation of the tops of the various ?? for units proposed in Table ??.
- Taken in isolation in 13.24, <20µ / 45µ ratio points (red (o) points) at the tops of Units 5, 4, 3, and 2 reported at 6, 18, 26 and 37 cm, respectively, have values that nearly are identical (2.50 ± 0.05). These same points, however, also are in the scatter that defines the two trends in the change in ratios relative to depth and relative age.
- The Shorty impact planed off top of Unit 5; however, scoop sample 74220 came from that unit with a mixed depth of about 7-17 cm (reported 1-10 cm adjusted for about 6 cm of deposit being planed off by radial impact forces). Size-frequency data from the 74220 sample gives mixed results, with 74220’s <20µ / 45µ ratio plot being intermediate between the two linear trends.
- The <20µ / 90+150µ ratio for 74220 plots well below both linear trends but its value showing greater coarseness may be reflecting the 6-18% admixture of light gray regolith.
- There are indications that Unit 2 may be a composite of three deposits, if this is not the case, the plots for Unit 2 would indicate grading from fine to course with increasing depth.
- The anomalous position of both ratios for Unit 1 at 58 cm relative to the two trends for other units may reflect the probability that Unit 1 was the product of the first orange+black ash eruption with a size-frequency distribution that is distinct from the four, more periodic eruptions that followed.
10.3 Deposition Ages of Orange+Black Ash Deposit
The ages reported for the last eruption of orange+black ash, 74220 (Unit 5) include Tera and Wasserburg’s (1976) Pb-Pb 3.48 ± 0.03 Ga and five 39-40Ar ages for 74220 compiled by Meyer (2012) that are all older than 3.48 Ga by 60 to 230 Myr. The most likely age in the latter group for the last eruption of orange+black ash, is 39-40Ar 3.60 ± 0.04 Ga (Huneke, 1978), preformed on undevitrified, rapidly cooled glass beads from sample 74220. Alexander et al., (1980) also report a 39-40Ar age on similar glass beads of 3.66 ± 0.03, matching that of Huneke within error limits.
The Huneke age would put the last orange+black ash eruption at about 220 Myr after the last basalt lava eruption at 3.82 ± 0.05 Ga (Schaeffer et al., 1977).
[Schaeffer et al.’s 39-40Ar analysis was of a very fine-grained armalcolite+ilmenite intergrowth (early crystallization) in ilmenite basalt sample 70215.]
As this interval based on the Huneke age encompasses the possible 177 Myr minimum total of cosmic ray exposure ages (Eugster et al., 1981) from ash units in the core 74001/2 (not including the last unit, Unit 5), it will be used in this discussion. Huneke’s age would indicate that ash eruptions began soon after 3.82 ± 0.05 Ga (3.60 Ga + ~177 Myr = 3.777 Ga).
A39-40Ar age of 3.654 ± 0.020 Ga (Saito and Alexander et al., 1977) on partially devitrified ash from an unreported depth in the lower core 74001 is the only published 39-40Ar age for an ash eruption earlier than the last. Eugster et al. (1978) report a K/Ar age = 3.64 ± 0.10 Ga for 74001 that straddles the Saito and Alexander age of 3.654 ± 0.020 Ga. The Saito and Alexander age is ~54 Myr older than Huneke’s age, suggesting that their sample came from the upper part of the ash sequence in 74001 when matched against the possible minimum of ~177 Myr for the eruptions sampled by the core. As a visualization aid in relation to these and other events, Fig. 13.25 shows the sequential relationships for reported 39-40Ar ages for the events surrounding the orange+black ash eruptions.
 Fig. 13.25. Schematic visualization of 39-40Ar ages related to orange+black pyroclastic ash eruptions.
The stratigraphic and regolith development constraints on the representations in Fig. 13.25, anchored to the reported 3.82 ± 0.05 39-40Ar age for the last ilmenite basalt eruption, are as follows:
-
- The 39-40Ar age for the last orange+black ash eruption of 3.60 ± 0.04 Ga (Huneke, 1978) implies that the first eruption was >127 Myr, and possibly >177 Myr, earlier (>3.77 Ga), based on the sum of exposure ages of earlier ash units given by Eugster et al. (1981), that is, shortly after the last ilmenite basalt lava eruptions.
- The last basalt eruption, with a 39-40Ar age of 3.82 ± 0.05 Ga (Schaeffer et al., 1977) and within the ± 40 Myr error limits extrapolated from Huneke’s measurement. This probability is supported by the observation of an apparent ash layer mixed with basaltic rubble in the Station 1 crater wall (Chapter 10).
- The last ash deposit at Shorty Crater was exposed for 24 Myr to cosmic rays (Eugster et al., 1981) before being covered and protected for ~3.5 billion years by the light gray regolith ejecta blanket from nearby Fitzgibbon Crater.
- Solar wind impingement on the lunar surface began with the demise in the strong lunar magnetic field between the deposition of the last two ash units (Units 4 and 5), that is, just before 3.60 ± 0.04 Ga, providing a refinement of the 3.54 Ga age for the field’s declined estimated by Tikoe et al. (2017).
The observation of an apparent layer of black ash mixed with ilmenite basalt rubble in the wall of the crater at Station 1 (Chapter 10; Schmitt, 2024a) indicates that ash probably erupted soon after the last basalt eruption, as such a surface rubble zone would develop on top of the last lava flow in that location. This rubble and the associated ash, however, probably are part of the ejecta blanket surrounding Steno Crater.
[The possibility that black ash overlies the basalt rubble may indicate that the crater at Station 1 penetrated a relatively thin ejecta blanket from Steno Crater to near basalt bedrock. Otherwise, the younger ash would be expected to underlie rubble due to overturn of the ejecta blanket.]
The careful descriptive work of Nagle (1978a, 1978b) shows no evidence of non-ash, regolith ejecta in core 74001/2, in spite of Eugster et al.’s (1981) cosmic ray exposure age evidence that orange+black pyroclastic eruptions took place periodically over at least 127 Myr. Although surprising, the fact that local ash accumulations would not include non-ash, regolith ejecta from impacts in the valley over that length of exposure is plausible, none-the-less. Impacts that would penetrate a half-meter or more of ash in that length of time would be rare but possible. Ash ejecta and impact glass from the more frequent but smaller impacts, including impact-derived shards, agglutinates and breccias, from impacts that did not penetrate the ash deposits, of course, would be difficult to detect or to differentiate from pyroclastic if, indeed, scoria were produced during an eruption.
Impact craters greater than half-a meter deep would be more than ~2.5 meters in diameter (Pike, 1974) and would not accumulate at a saturation size-frequency in a few tens of Myr. Also, coarse ash “compound particles,” noted by Nagel, actually may be ash “agglutinates” rather than scoria, as pyroclastic eruptions in vacuum initially would produce largely fine ash particles due to vacuum enhancing the rapid release of dissolved volatiles in the parent magma. Additionally, in §9.1, it is estimated that small macro- and micro-meteor impacts appear to have occurred close to the deep drill core site with a frequency of every 5.7 Myr. Impacts capable of penetrating more than 0.5 m of ash would occur exponentially less frequently.
End of Upload 18
Start of Upload 1910.4 Pyroclastic Record of the Decline of the Ancient Lunar Magnetic Field
Tikoo et al.’s (2017) estimate that the ancient lunar magnetic field was at ~110 µT between 4.25 and 3.56 Ga might be partially tested with the Shorty Crater ash samples, as their latest deposition age (Unit 5), at 3.60 Ga, is older than Tikeo et al.’s estimate for the timing of the field’s decline. An independent evaluation is possible as to when the magnetic field decline reached a point where solar wind ions could again impact areas away from north and south lunar dipole poles (Nicoles et al., 2021). If it can be shown that the solar wind was impacting one of the ash units around 3.56 Ga and not impacting older units, the Tikeo et al. estimate would look very good.
Unit 5 at the top 74002 does show some signs of maturation (Is/FeO < 3.8); however, that could be attributed to contamination from overlying light gray regolith (Is/FeO = 5) particles as noted above. On the other hand, there is significant isotopic evidence that the youngest unit (Unit 5) was exposed to the solar wind, whereas, the lower units sampled by the core (74001/2) were not so exposed.
For example, the 4He/3He ratio reported by Eberhardt et al. (1974) for 74220, equivalent to Unit 5 of the core, is 2760, and is only slightly higher than what these analysts reported for the deep drill core zones (2540-2720). This indicates solar wind helium implantation in Unit 5. In contrast, Eugster et al. (1979) report 4He and 3He contents that give 4He/3He ratios for units below Unit 5 as follows:
- 5 gm/cm2 (~33.6 cm, Unit 3) – 761
- 5 gm/cm2 (~39.5 cm, Unit 3) – 653
- 5 gm/cm2 (~53.5 cm, Unit 1) – 475
- Average – 630
Similarly, Eugster et al. (1981) report data that give 4He/3He = 473 at 144 gm/cm2 (~62.9 cm, Unit 1), lowering the above average 4He/3He to 591. This is a factor of 4.7 less than for 74220 and Unit 5 in core 74002, indicating no exposure in these older units to solar wind helium, but possibly indicating the primordial 4He/3He was roughly 591.
[The depths of samples reported by Eugster et al (1979, 1981) have been estimated by using densities reported by Mitchell et al. (1973)— that is, 2.04 gm/cm3 for 68.5 gm/cm2, apparently from upper core 74002, and 2.29 gm/cm3 for three other measurements, reported to be from lower core 74001.]
Nitrogen isotopic data, reported as δ15N‰, paint a similar picture to those of helium. Kerridge et al. (1991) report that, at 13.5 cm (Unit 4) and below in the core 74001/2, δ15N‰ values are all positive. δ15N‰ values in 74220. In contrast, they report that the top Unit 5 of the orange+black core sample (74002) is trending from positive values of around +20 toward the current negative values in the current solar wind (δ15N‰ = –118). This trend is analyzed in more detail in §6.2.
The above data on helium and nitrogen isotopic ratios indicate that the decline of the field began before 3.60 ± 0.04 Ga, supporting the Tikeo et al., estimate of 3.56 Ga, particularly if the new 40K decay constants are applied to the 39-40Ar age of 3.60 Ga. Kerridge et al.’s report of positive δ15N‰ values in Unit 4 at 13.5 cm whereas they are negative in Unit 5 affirms this conclusion.
The calculated Unit 1 39-40Ar ages indicate that pyroclastic orange+black ash eruptions began very close to the end of ilmenite basalt lava eruptions. Based on their distinct, chondritic isotopic ratios (Ketterige et al., 1991), this close timing relative to the end of basalt eruptions suggests that rising pyroclastic volatiles, evolved in the post-basalt migration of warming into a chondritic lower mantle, helped create new magma reservoirs by lowering melting points in the upper mantle.
10.5 Primordial δ15N‰ for the Moon
Kerridge et al. (1991) concluded that the primordial lunar value for δ15N‰ is +13 ± 1.5‰, based on analyses of pyroclastic ash taken from the Station 4 drive tube core 74001 between 55.5 and 56.5 cm depth in stratified pyroclastic ash. The average of their δ15N‰ values for orange+black ash between 56.0 and 58.0 cm is +9.6 ± 6.5‰ for heating steps 600 and 800 ºC; however, Kerridge et al. concluded that the best overall value is +13 ± 1.5‰, based on other detailed considerations. This latter value will be taken as the indigenous δ15N‰ for the source of the pyroclastic nitrogen.
Although more precise, a value for of +13 ± 1.5‰ also is consistent with the range of δ15N‰ = +0.2 to +20‰ determined by Furi et al. (2015) in their study of mare basalts derived from the upper lunar mantle. These data support a conclusion that the pyroclastic volatiles sampled in 74001/2 came from the upper portion of a relatively undifferentiated, chondritic lower mantle, i.e., the pre-magma ocean, proto-core of the Moon.
In contrast to the positive value for δ15N‰ in Unit 1, Kerridge et al.’s (1991) δ15N‰ value for the top-most 0.5 cm of ash in core 74002 is –25 ± 5‰, the average of 3 heating steps, 800, 850 and 900 °C). Relative to Unit 1, this 38‰ decrease in the value for δ15N‰ in the topmost ash deposit, Unit 5, further indicates that before 3.60 ± ~0.04 Ga the lunar magnetic field had weakened to the point that the solar wind (δ15N‰ = –118‰) was impinging on low latitude surfaces.
Based on the interpretation of the partially overturned structure of the ash deposit (Fig. 13.23), the Kerridge et al. (1991) analyses at 55.5-56.5 were done on the oldest of the sampled pyroclastic deposits, Unit 1. In addition, with a corrected cosmic ray exposure age of 46 Myr (Table 13.11) for Unit 1 at 56 cm depth, and referencing the evidence of negative δ15N‰ values near the top of Unit 5, the positive δ15N‰ value at ~4 cm below the top of Unit 1 indicates that the lunar magnetic field remained strong enough until just prior to 3.60 Ga to prevent solar wind impingement. It would be desirable to verify with δ15N‰ values for Units 2-4 that the Unit 1 value of +13 ± 1.5‰ was the original minimum value for erupted ash.
10.6 Very Low Titanium (VLT) Ash Eruptions
An important component in the modeling of sources of regolith ejecta zones in the deep drill core (§5) is the composition of a VLT ash bead in core sample 70007 (Vaniman and Papike, 1977). A rake sample rock, 78526, of composite VLT “green glass” (scoria) has a composition similar to the 70007 bead (Laul and Schmitt, 1975). Unlike the outcrop of stratified orange+black ash at Shorty Crater (Station 4), however, no coherent deposits of VLT ash were sampled at Taurus-Littow. Examination of LRO NAC stereo images by Schmitt et al. (2017) led to the discovery of several possible VLT pyroclastic fissures in the Sculptured Hills, northeast of Station 8. The suggestion that these are VLT ash fissures rather than orange+black ash is based on the apparent abundance of VLT ash (“glass other” than orange+black ash) reported by Heiken and McKay, (1974) in Sculptured Hills’ regolith 78501 and 78221.
Zellner et al. (2009) reports a 39-40Ar age of 3.630 ± 0.040 Ga for a VLT glass in rake sample 71501 from Station 1. This age falls within the 3.82 to 3.60 Ga range of orange+black ash eruptions (§10.3, Fig. 13.25), indicating that the two styles of pyroclastic activity probably were contemporaneous as well as coming from independent magma sources. The association of isotopically chondritic, thermally released volatiles from the lower mantle (§10.5) with the titanium-rich orange+black ash suggests volatile induced magma formation in the upper mantle as the crustal impact breccia-induced thermal front that produced the maria lavas continued to migrate downward; whereas, the low titanium and high silica VLT ash may be related to residual liquid+volatiles from reservoirs of largely fractionally crystallized (olivine and ilmenite removed) ilmenite basalt magma sources.
11.0 Light Gray Regolith
11.1 Introduction
As discussed above, the Shorty Crater, orange+black ash deposit and its internal stratigraphy was protected for ~3.5 billion years, beginning ~24 Myr after its final eruption (3.60 ± 0.04 Ga), by an blanket of light gray regolith ejected from the nearby, ~100 m diameter Fitzgibbon Crater (working name). Samples 74240 and 74260 of this regolith, obtained from either side of the orange+black ash outcrop (Chapter 11), appear to be compositionally similar to Sculptured Hills regolith 78501 (Table 13.20). This implies that the light gray regolith had developed on a nearby knob (kapuka) of Sculptured Hills-like material.

Basalt fragments in sample 74261 of the light gray regolith give cosmic ray exposure ages of 375 ± 120 Myr for 81Kr and 331 ± 80 for 38Ar (Eugster et al., 1985), whereas, many other analyses indicate cosmic ray exposure ages around 160 ± 50 Myr (Table 13.5). In contrast, the total Is/FeO for both the light gray regolith samples is only 5 (Morris et al., 1978). Further, the light gray regolith likely had only limited exposure to solar wind protons during its active gardening due to the presence of a strong, 20-110 µT lunar magnetic field as it accumulated (Tikoo et al. (2017). Tikoo et al. report such a field existed between 4.25 and 3.56 Ga and the discussion in §10.4 indicates that the field was already minimal at the time of the eruption of the last deposit of ash at 39-40Ar 3.60 ± 0.04 Ga.11.2 Inconsistency Between Cosmic Ray Ages and Is/FeO Values
Prior to being exposed at the lunar surface by the Shorty impact, the light gray regolith’s exposure to maturation would have been only from internal uranium and thorium alpha radiation due to the presence of a strong dipole magnetic field before ~3.60 Ga (§10.4). The current U+Th content of 74260 is 1.799 (Silver, 1974). As the Sculptured Hills appear to be Imbrium ejecta, that is ~3.9 Ga in age, the mean exposure age for light gray regolith would be about 3.8 Ga, assuming an exposure age of ~160 Myr. For its current U = 0.434 and Th = 1.365 (Table 13.20), U and Th at 3.8 Ga would be 0.618 and 1.550 ppm, respectively, and U+Th would be 2.168 ppm,
With an alpha+beta-only ∆Is/FeO / Myr = 0.58 per ppm U+Th (§6.3.4), and with no solar proton input, the mean ∆Is/FeO / Myr = 1.26 (0.58 x 2.168 ppm) for 74260. For a cosmic ray average exposure age of ~160 Myr this gives a ∆Is/FeO = ~202 (1.26 x 160 Myr), as the minimum ∆Is/FeO in contrast to the measured 5.
The inconsistency in the estimated ∆Is/FeO relative to reported cosmic ray ages indicates impact related reset of the “Is” component of light gray regolith’s Is/FeO. The light gray regolith samples were obtained on the rim of the 110 m diameter Shorty Crater where the orange+black ash deposit and its covering light gray regolith are now exposed in a folded and partially overturned small anticline. This indicates the returned samples would have experienced significant in situ shock.
The geological history of the Shorty Crater area (Schmitt, 2017) is complex. There is cosmic ray exposure age (Eugster et al., 1981) and GCR tracks (Goswanni and Lal, 1974) evidence from samples of the shattered rim boulder (74255) indication that the Shorty impact occurred about 2.8 to 3 Myr ago. There is additional cosmic ray exposure evidence from the boulder that, prior to the Shorty impact, it previously had been exposed at the surface for 17.8 ± 1.6 Myr (Eugster et al., 1981).
As the 3 Myr post-Shorty exposure would add only a few Is/FeO points to the boulder, one explanation for these data is that most of the light gray regolith’s current Is/FeO = 5 is a residual of the large Is/FeO it had prior to a reset by the Shorty impact. Residual Is/FeOs are present in most impact generated regolith breccias as well as many long exposed but low Is/FeO bulk regolith samples (Morris, 1978). The pre-Shorty, ~17 Myr cosmic ray exposure of boulder 74255 probably was acquired prior to the partially overlapping Fitzgibbon Crater impact, with the boulder then being buried until the Shorty impact excavated and exposed it for another 3 Myr. This scenario appears consistent with the known facts relative to samples from Station 4 and analyses related to them.
12.0 Lunar History in Nitrogen Isotopic Data from Shorty Crater Pyroclastic Ash and Light Gray Regolith
Kerridge et al. (1991) published nitrogen isotope data for samples in the 70 cm double drive tube core of the ash deposit (74001/2). Becker and Clayton (1977) have done the same for 74240 of the light gray regolith that had protected the ash deposit for ~3.5 billion years. Is/FeO data (Morris et al., 1978) give a sequence of relative exposure to the solar wind for these samples from essentially zero (74001 at 68 cm) to an Is/FeO = 3.6 (74002 at 0.5 cm) to Is/FeO = 5 (light gray regolith 74240 on top of 74002). The δ15N‰ values for the three samples increase with exposure as follows:
- 74001 (68 cm): δ15N‰ = +13 ± 1.5‰ (Kerridge et al., 1991)
- 74002 (3.6 cm): δ15N‰ = –25 ± 5‰ (average of 3 heating steps, 800, 850 and 900°; Kerridge et al., 1991)
- Light gray regolith 74240: δ15N‰ = –80‰ (Becker and Clayton, 1977), probably accumulated after its deposition on the ash as that would be its first exposure to solar wind.
As discussed in §10.3, the upper portion of the last ash deposit, erupted at 3.60 ± 0.05 Ga (geologically very soon after the decline in the ancient lunar magnetic field) and was exposed to cosmic rays for ~24 Myr before being shielded by light gray regolith ejecta from Fitzgibbon Crater at about 3.43 ± 0.03 Ga. (The Fitzgibbon impact penetrated the orange+black ash deposit to tap the regolith below the ash.) The fact that there is a 38‰ decrease in δ15N‰ between Unit 1 and Unit 5 indicates that the solar wind impinged on ash Unit 5 with no evidence of its impingement on Units 1-4. After being covered by the light gray regolith, a short second exposure of about 3 Myr occurred after being uncovered by the Shorty impact.
Exposure of Unit 5 would have been to solar wind with a δ15N‰ = –118‰ for a total of about 24 Myr (Eugster et al., 1981). The fact that δ15N‰ = –25 ± 5‰ at the top of core 74002, versus +13 ± 1.5‰ at the bottom, indicates that ~24 Myr was required for there to be a total decrease of 38 ± 6.5‰ in δ15N‰ from an initial deposition value of +13 ± 1.5‰. The net ∆δ15N‰ / Myr = –38 / 24 or about –1.58 δ15N‰ / Myr. Note that this rate applies to the top of the core 74001/2 that is estimated to be about 5 cm below the pre-Shorty top of ash Unit 5; however, mixing within the impact gardened portion of Unit 5 probably gave that unit the same δ15N‰ value throughout.
Apparent net exposure of light gray regolith sample 74240 to solar wind after deposition on ash Unit 5 was about 51 Myr (–80‰ / –1.58). The light gray regolith would not have been exposed to solar wind before ash deposition due to the ancient lunar magnetic field being active before about 3.60 Ga (§10.4) and after 4.25 Ga (Tikoo et al., 2017). It would not have been exposed for the first time until ejected from beneath the ash by the Fitzgibbon Crater impact. The 51 Myr apparent exposure, as well as the limit of δ15N‰ = –80‰ reached in light gray regolith rather than –118‰, represents the level of net exposure of sample 74240 to (1) impact gardening’s effective depth and (2) maturation losses of 14N over the next ~3.5 billion years. This suggests that there was a significant thickness of light gray regolith above this sample as well as the high probability of ejecta from post-Fitzgibbon impacts and deposition from the light mantle avalanches adding to protection from the solar wind.
Relative to data on maturation, an exposure to cosmic rays for ~24 Myr is about 4.5 Myr longer than the sunlit sample 76220 at Station 6 (§6.3.3) for which a proton-only ∆Is/FeO / Myr = 0.11. At that rate, hypothetically, proton-only ∆Is/FeO for 24 Myr would be about 2.6. With a U+Th = 0.874 ppm for 74220 from Unit 5, the alpha+beta contribution to ∆Is/FeO would be ~12 (0.58 × 0.874 × 24) for a total hypothetical ∆Is/FeO = ~15. With a measured ∆Is/FeO = <3.6, this hypothetical value of ~15 is further indication of the attenuation effect of volcanic glass (§7.3) on nano-phase iron production and that the <3.6 value is inherited from the intermixed light gray regolith components even though the nitrogen data on upper Unit 5 of core 74002 indicates exposure to solar wind. (90-95 molar% of the 90-150 µ fraction of Unit 5 is glassy volcanic ash (Heiken and Mckay, 1974).)
Additionally, the relatively ash-free light gray regolith (~5 molar% ash in 90-150 µ fraction, Heiken and McKay, 1974) has ∆Is/FeO = 5 (74240) and 5.1 (74260). These values are still far too low, if the light gray regolith were exposed after covering the ash at 3.43 Ga and too high if the first exposure was after the Shorty impact at ~3 Myr ago.
[To evaluate the validity and possible meaning of the δ15N‰ value of –80‰ for 74241, it should be noted that the total nitrogen in 74241 is very low, that is, only ~4.7 ppm total release of nitrogen for the 900º and 1000º heating steps, as compared with 10 to 20 times that amount for most other regolith samples analyzed in the 800-1000º heating steps. Given the available facts, the most likely source of error is in the δ15N‰ value of –80. A re-analysis of δ15N‰ in 74240 and a confirming analysis in 74260 would be very helpful in this regard.]
13.0 Solar and Lunar History in Regolith and Regolith Breccias at Van Serg Crater
13.1 Introduction
The ~90 m diameter, 15 m deep Van Serg Crater (Fig. 13.26) is about half a crater diameter from both the rims of the ~700 m diameter Cochise and Shakespeare Craters and has penetrated their ejecta blankets. The ejecta blankets of those craters, however, are overlain by regolith ejecta from the younger, deep drill core regolith ejecta zones Y+Y* through S (Table 13.1a), whose source craters (§3.4) are all within range of Van Serg Crater (Fig. 13.5) and have contributed varying amounts of regolith ejecta to the pre-Van Serg Crater surface (Table 13.21). The small, near-by Gatsby Crater also may have added regolith ejecta to the pre-Van Serg sample locations.
As estimated in Table 13.21, the thickness of regolith ejecta from the source craters for zones Y+Y* through S is probably between 3.21 and 2.34 m. The major uncertainty in the thickness of this accumulation of post-0.806 Ga ejecta comes from the degree of interaction that occurred between ejecta sheaths from the four simultaneous source impacts for deep drill core zone U. The thickness of the ejecta blankets of Cochise and Shakespeare Craters and regolith ejecta underlying those blankets is unknown; however, as the Van Serg impact penetrated to bedrock basalt, the total depth of all overlying regolith is less than 15 m, the current rim to floor depth of the crater (Lunar QuickMap). This “less than 15 m” thickness, probably on the order of 13 m when accounting for ejecta at the crater rim, is consistent with the range of regolith depths given in Table 13.16 (Column 5).

 Fig. 13.26 Features in the vicinity of Station 9 at Van Serg Crater (QuickMap image has some distortion). Van Serg should appear circular in this image; however, Gatsby Crater is ellipsoidal, but somewhat exaggerated in the image.)
Gatsby Crater; the rim of which is only about 80 m to the south southwest, is markedly ellipsoidal (240 × 200 m), with a long axis bearing of 320° and with two mounds of material on its floor (Fig. 13.26). These characteristics suggest that Gatsby is the result of a relatively low velocity secondary impact and its near-crater ejecta blanket may extend significantly less far than a crater diameter width typical of primary impacts. This may be particularly true in the direction of the site of core 79001/2 that is roughly orthoganal to the long axis trend and ~180 m from the northeast rim of Gatsby Crater (Wolfe et al., 1981). The close proximetry of Gatsby Crater to Van Serg Crater, however, makes it a candidate as a source crater for some of the pre-Van Serg regolith ejecta in the sampling area.
Van Serg Crater’s floor is covered with small to large, relatively high albedo boulders and, at its deepest points, is about 15 m deep. Its forming impact may have excavated material from the deep drill core (70001/9) regolith ejecta zones (Table 13.21) as well as the ejecta blankets of Cochise and Shakespeare Craters, as indicated by the apparent basalt boulders on its floor and ejecta blanket. Gatsby Crater ejecta, if present, would lie just below Van Serg ejecta in core 79001/2. Gatsby also appears to have dark material exposed on its floor, with an area of ~1000 m2, that may correlate with the dark ejecta around Van Serg Crater.
Van Serg Crater was investigated and sampled at Apollo 17 Station 9 (Chapter 12), initially under the impression that it looked similar to Shorty Crater due to the dark albedo of its ejecta blanket. As we now know, Van Serg Crater’s dark albedo ejecta is clearly the result of the excavation of darker than normal regolith rather than concentrated pyroclastic ash excavated at Shorty Crater. Van Serg Crater also is younger than the ~3 Myr-old, ~110 m diameter Shorty Crater (§10.1; Chapter 11). (Cosmic ray exposure and track analysis on Shorty’s rim boulder 74255, reported by Eugster et al. (1977) and Goswanni and Lal (1974), respectively, both indicate a final exposure of 76255 at about 3 Myr from the present.)
In comparison with the ~3 Myr old Shorty Crater, the absence of friable regolith breccia around Shorty clearly shows that Van Serg is the younger crater. Yokoyarna et al. (1975) estimated an age for the Van Serg event of 1.6 ± 0.5 Myr, using the content of 26Al in sample 79221 from the upper 2 cm of a half trench dug in the outer portion of the ejecta blanket. This age is consistent with the differences in the regolith breecia content of the ejecta blankets of the two craters, although the total absence of regolith breccia at Shorty suggests that the Van Serg age may be closer to 1 Myr rather than 1.6 Myr.
[Broad support for the Yokoyarna et al. (1975) estimated age of 1.6 ± 0.5 Myr can be found in the lack of a ∆Is/FeO value after the last Is/FeO impact reset in core 79002. 79221’s companion sample, the original upper 2 cm of the upper double drive tube core 79002 would have been compressed to about 1.14 cm (0.57 × 2) for which Morris et. al. (1980) report two Is/FeO data points, both with a value of 87. These two data points follow an impact reset of Is/FeO from Is/FeO = 90 at 1.25 cm to 87. (see §§4.1 and 4.2). No ∆Is/FeO recovery, however, is indicated in the Is/FeO values at 0.75 and 0.25 cm in 79002. The actual ∆Is/FeO for this interval therefore can not be determined from the Morris et al. (1980) data but can be assumed to be very small.]
Abundant, friable, dark gray regolith breccia fragments exist on and in the ejecta blanket surrounding Van Serg Crater and along its rim and upper inner wall. This is in sharp contrast to the lack of regolith breecia at Shorty Crater. Large, light colored boulders also are scattered across the ejecta blanket and, from a distance, resemble boulders in the lower crater wall and floor. Mistakenly, these ejected boulders were not sampled, directly, although basaltic clasts in the breccias may be representative of them.
A well defined but irregular bench exists about halfway down the north and west inner wall of the crater and probably extends around much of the portion of the wall not visible from the Station 9 rim location. The bench is at the base of several meters of gray regolith, overlying concentrated rubble of light-colored, apparently non-friable rock. This bench may be the base of Van Serg ejecta, that is, the pre-Van Serg surface, or it may be the base of the Cochise ejecta blanket. On the northwest upper wall, a much darker apron of apparently fine-grained material exists. This apron tapers downward to the bench, suggesting that it is related to the dark regolith ejecta surrounding Van Serg Crater, similar to that sampled at the crater rim.
Samples collected on the rim of Van Serg consist of friable regolith breccias, 79035, 79115, 79120-25, 79135, 79175, 79195, 79235, and 79510-37, some with impact melt coatings and veins. Clasts in these samples, similar to those in 79155, suggest that the light-colored rocks and boulders on the floor and lower wall of the crater are ilmenite basalt rubble. “Glass” and “Glass Other” are present to over 10 modal% in the breccias (Simon et al., 1981) and orange+black ash is present in ejecta sampled the half trench (Heiken and McKay, 1974; Morris et al., 1980).
[Heiken and McKay (1974) report a total “Orange glass” and “Glass other” in 79221 of 15.7vol.%, but do not include particles <90µ. On the other hand, Graf (1993) indicates that ~57wt% of the 79221 sample is, in fact, <90µ, so Heiken and McKay’s 15.7vol% “glass” is not represetative of 79221 as a whole. Graf gives Station 4’s orange+black pyroclastic glass <90µ as ~81wt% of the total in upper core 74002 (18.0-18.5 cm interval). Ratioing 15.7vol.% to 43wt% indicates that the <90µ portion of 79221 (57wt%) would have ~29vol.% “orange” and “glass other.”]
End of Upload 19
Start of Upload 2013.2 Regolith Ejecta Sequence at Van Serg Crater and Its Correlation with Deep Drill Core Zones
A 70 cm long double drive tube core 79001/2 (see Morris et al., 1980??; Meyer, 2012) was obtained close the half trench to further sample the two zones observed in the trench. Up on examination in the Lunar Receiving Labatory, the upper drive tube section contained only 20 cm of core rather than the section length of 35 cm, because of post-collection and curation compaction of the relatively low density, near surface regolith.
The stratigraphy of core 79001/2 is summarized in Fig. 13.27 and Table 13.22 with the ∆Is/FeO values and Is/FeO resets based on the half-cm logging of raw data reported by Morris (1980??). The lettered units are divided based on estimated Is/FeO values and field observation of the wall of the half trench. It is important to note that the original core at time of collection was ~70 cm in length. As was the core sampling procedure, upper core 79002 was compacted after collection, ending up at 20 cm or ~57% of its original length. (Some additional compaction occurred during curation extrusion of the core.) Only the top 3.75 cm (Unit A in Table 13.22) of this 20 cm is a sample of the dark gray, ~7 cm of regolith that was observed in the trench and sampled as 79220 (0-2 cm) and 79240 (2-7 cm). Conversely, the remaining ~16.25 cm of the compacted 20 cm in core 79002 was originally 28 cm of regolith below the 7 cm of in situ dark gray regolith. The lower ~17 cm of the half trench sample 79260 was reported to be light gray (Chapter 12; Schmitt. 2024c).
 Fig. 13.27. Graphical represenation of half-cm Is/FeO data from Van Serg Crater drive tube core 79001/2 summarized in Table 13.21 (after Morris et al., 1980??). ???No Morris et al., 1980 in endnotes; also no Morris (1980 or 1981)???.
The logic for the interpretations of source craters for the zones identified in Table 13.22, that is, Van Serg, Gatsby, MOCR, Sherlock, Sputnik and Camelot, is as follows:
- The dark gray top 3.25 cm (zone A) in core 79002 (7 cm in the half trench) is clearly representative of the dark gray, regolith breccia and orange+black ash-rich ejecta present at Van Serg’s The dark gray appearance of unit A and the rim regolith breccias is due to abundant orange+black ash, indicating that they represent regolith that developed on the surface of the youngest ilmenite basalt flow (~3.82 Ga) after the eruptions of ash soon after the last lava eruption (see §10.3).
- Units B-D in the core also are likely a mix of overturned regolith ejecta zones, that is, zones comparable to the deep drill core zones and those below them. B has an impact reset of Is/FeO = 17 indicating significance shock disturbance. This indicates that, before the Van Serg impact, unit B was resting on dark gray regolith and includes regolith ejecta not sampled by the deep drill core, that is, material below zone Z** (Table 13.1a). As discussed further below (§4.3), nitrogen isotopic data confirms that units A and B-D are overturned relative to their pre-impact relationships, further indicating that zone B would be the bottom of the in situ pre-impact regolith ejecta zones, including the Cochise and Shakespeare Craters near-crater ejecta blankets. The incoherence of Is/FeO values in units C and D, likely produced by impact disruption, strongly suggest that the bottom of unit D rests on the pre-Van Serg impact surface.
- Units E-H, with an impact reset of 16 Is/FeO points in unit H, likely constitute an 8.40 cm thick (22.65 –14.25) zone of the nearby, pre-Van Serg, Gatsby Crater This association with Gatsby is further supported by the nitrogen isotopic (δ15N‰= +2‰) data discussed below.
- The near rim of the 1451 m diameter MOCR Crater is ~6.13 km from Van Serg Crater and has been identified as the source crater for the youngest deep drill core zone, zone S. The zone S regolith ejecta deposit at the deep drill core location came from a slightly greater distance, 6.27 km, and is 19.65 cm thick. Zone J-M in core 79001 is defined by a impact reset of 16 Is/FeO points over 2 cm of unit I in the Van Serg At 10.00 cm thickness (32.65 – 22.65), the MOCR regolith ejecta zone in core 79001 is about half that for zone S in the deep drill core (Table 13.21), probably the result of ejection-related thinning, if this correlation is correct. Further, the total ∆Is/FeO for the interval J through M in Table 13.22 is ~31, significantly less than 46 for the still exposed zone S in the deep drill core (Table 13.1a); however, zone S at the deep drill core site has been continuously exposed since deposition whereas units J-M have been shielded from 15 points worth of ∆Is/FeO exposure by overlying Gatsby (10) and Van Serg ejecta (5 in unit A), making I-M identical with zone S (31 + 15 = 46).
- Unit O in core 79001 is defined by a large impact resent of 18 Is/FeO points as the bottom of units suggested to be equivalent to deep drill core zone T+T*. The near rim of Sherlock Crater is ~1.40 km from Van Serg Crater and has been identified as one of two source craters for zone T+T*, the least mature zone in the deep drill core. Sherlock Crater’s regolith ejecta deposit in the deep drill core is from 1.04 km and is 25.70 cm thick vs. 3.5 cm for units N-O in core 79001, significantly less than that of zone T+T* in the deep drill core. Zone T+T*’s regolith ejecta zone, however, also had a simultaneous contribution from Powell Crater, 2.71 km distant from Van Serg. The regolith ejecta contributions of Sherlock and Powell at the Van Serg location are estimated in Table 13.21 to be 30 and 46 cm, respectively but ejecta sheath interactions may have reduced the final deposition thickness, significantly. Further thinning as a result of the Van Serg impact would have reduced that thickness even more.
- The distances from Van Serg Crater to the near rims of the four contemporaneous source craters for deep drill core zone U (§5.0), Steno, Emory, Faust and Sputnik Craters, are given in Table 13.21. Sputnik’s specific contribution to zone U at the core site is estimated to have been about 11 cm (§3.4.2, Table 13.3a), because the ejecta sheaths of the four simultaneous impacts probably interacted. These craters’ contributions of regolith ejecta deposit in Van Serg core 79001 is 7.4 cm for units P-S versus the pre-Van Serg estimate in Table 13.21 of 116 cm, suggesting major thinning of the P-S unit by the Van Serg impact or great asymmetry in the zone U oblique ejecta sheaths. Further, P-S’s ∆Is/FeO = 36 vs. 75 for the deep drill core’s zone U. Also, as discussed in §§ 4 and 8.5, data suggest that reset impacts affecting zone U were of abnormally high kinetic energy, however, the half-cm logging of core 79001 does not show a similar reset vs. ∆Is/FeO pattern as seen in the deep drill core’s zone U ( 13.1a). The reason for this difference between the patterns in the two cores has not been determined. It may be related to disruption of the Is/FeO record by the proximity to the Van Serg impact.
- Due to its relative position in the core, units T-V of core 79001 appears to provide a sample of zone V+V* regolith ejecta from Camelot Crater, about 2.62 km from Van Serg Crater. As this distance is near the optimum deposition distance for regolith ejecta ( 13.8), a significant thickness of Camelot ejecta may lie below the 3.50 cm of unit T-V sampled by 79001, although this depth would also include regolith ejecta equivalent to deep drill core zones W through Y+Y*, the ejecta blankets from Cochise and Shakespeare Craters, and all ejecta units deposited after the ~3.82 Ga eruption of the last ilmenite basalt lava. Just above the lava would a half meter or so of orange+black pyroclastic ash, and just below the lava would be the dark gray ancient regolith that makes up the rim regolith breccias.
[The half-cm Is/FeO data for the core summarized in Fig. 13.27 (Morris et al., 1980??) and Table 13.22 indicate a 5.50 cm thick mixed Is/FeO sequence that varies from 44 to 77 points between a compacted 14.25 and 5.25 cm in depth. These depths would probably correspond to an uncompacted depth of about 25.00 and 9.21 cm at 43% compaction and probably records internal, real-time mixing of the Van Serg impact ejecta. As the dark gray regolith ejecta and rim breccias do not appear to have participated in this mixing, it suggests that they may have been initially ejected on more vertical trajectories that delayed their deposition.]
The intervals with red bold text in Table 13.22 indicate possible lower contacts of regolith ejecta deposits for which relatively large impact resets of Is/FeO are noted in half-cm logging. When the δ15N‰ values given in Table 13.22, Column 4, are noted, they also indicate a relationship with the regolith ejecta zones of the deep drill core (§6.2). The Van Serg sequence of δ15N‰ values suggest that (1) below the relatively thin uppermost Van Serg, dark gray ejecta (δ15N‰ = +20), the sequence of deep drill core zones has been overturned between 14.25 and 3.75 cm and mixed so as to give a net δ15N‰ value of –64‰; and (2) the zones below the pre-Van Serg surface are right side up zones whose δ15N‰ values roughly correlate with those in the deep drill core. One exception to this correlation is the first zone (units E-I) below the pre-Van Serg surface in which δ15N‰ = +2. This zone in core 79001 is probably is ejecta from nearby Gatsby Crater. The δ15N‰ values in zones (units J-T) below the apparent Gatsby zone follow the deep drill core sequence given in Table 13.22, Column 3. These data strongly suggest that, below the overturned regolith, the pre-Van Serg zone sequence sampled by drive tube core 79001 is Gatsby, MOCR (zone S), Sherlock+Powell (zone T+T*), Steno, etc. (zone U), and Camelot (zone V+V*).
The above relationships are summarized schematically in Fig. 13.28.
 Fig. 13.28. Schematic diagram of stratigraphic relations of regolith ejecta zones below the rim and ejecta blanket of Van Serg Crater. Bold lettered zones refer to those in the deep drill core (70001/9) listed in Table 13.1a).
Support for the zone sequence proposed above is found in the variations in trace elements reported by Morris et al. (1980??). Trace element concentration spikes and depletions associated with the various regolith ejecta zones are given below, as correlated with the base of those zones sampled by drive tube core 79001/2.
[Key: black bold = increase, black bold* = large increase, red bold = decrease, plain text = no apparent change]
- Van Serg dark gray (3.75 – 5.25 cm): La, Sm, Hf, FeO, Co, Sc, Cr, 20Na, Eu, Ni, Ir.
- Van Serg overturned ejecta (5.25 cm overturned): La, Sm, Hf, FeO, Co, Sc, Cr, 20Na, Eu, Ni, Ir.
- Gastby ejecta (22.65 cm): La, Sm, Hf, FeO, Co, Sc, Cr,
- 20Na, Eu, Ni, Ir.
- MOCR (zone S) ejecta (32.65): La, Sm, Hf, FeO, Co, Sc, Cr, 20Na, Eu, Ni, Ir.
- Sherlock+Powell (zone T+T*) ejecta (36.15): La, Sm, Hf, FeO, Co, Sc, Cr, 20Na, Eu, Ni, Ir.
- Sputnik (zone U) ejecta (43.65 cm)- La*, Sm*, Hf, FeO, Co, Sc, Cr, 20Na, Eu, Ni, Ir*.
- Camelot (zone V+V*) ejecta (+46.65 top): La, Sm, Hf, FeO, Co, Sc, Cr, 20Na, Eu, Ni, Ir.
The above list indicates that trace element anomalies occur in the deposition units of the several identified zones in core 79001/2. It also suggests the following:
-
-
- The Van Serg impact (item 1) was by a metal-rich meteor.
- The enrichment in Hf in Van Serg overturned ejecta (item 2) may reflect the significant amounts of massif regolith in the thick, lower zones of the deep drill core (§5).
- The contrast between MOCR and Sherlock+Powell enhancements and depletions suggest that their regolith ejecta sampled two different basaltic lavas. The existence of a possible lava flow front running north and south and including the east wall of Cochise Crater, discussed in relation to photography obtained at Station 6 (Chapter 12; Schmitt, 2024c), suggests this possibility as well, as does the straight east wall (rectangular shape) of Cochise Crater.
- The compositional enrichments noted for Sputnik ejecta appear to support the conclusion in §§4 and 8.5 that zone U regolith ejecta was the result of fragments of a disaggregated comet (Steno, Emory, Faust and Sputnik Craters).
END OF UPLOAD 20
Start of Upload 2113.3 Deposition Age Estimates for Regolith Ejecta Zones Sampled at Van Serg Crater
The reported data on values for Is/FeO and Th in drive tube core 79001 (Morris et al., 1980) obtained at Van Serg Crater provide an opportunity both to estimate the possible exposure ages of unit groups correlated with Gatsby, MOCR, Sherlock and Steno, etc. source craters and to further evaluate the process of impact reset of Is/FeO as was done in §11.2 for Shorty Crater. Table 13.23 summarizes the relevant data relative to this evaluation.

[Relative to Table 13.23, Row 2, dealing with Van Serg surface ejecta, data from Morris et al. (1980) give the current Is/FeO for the top of core 79002 as 87 with a logged ∆Is/FeO = 5 and a logged Is/FeO reset = 14 in the upper 3.75 cm of the core (~7 cm in nearby trench). These figures would indicate a net pre-impact Is/FeO = 98. Morris et al. (1978) give the Is/FeO = 81 for 79221 that sampled the top 2 cm of the half-trench near 79002; however, Is/FeO = 98 at the top of 79002 would be more representative of the pre-impact Is/FeO. No Is/FeO is reported for the rim breccias (Meyer, 2012); however, Housley et al. (1976) conclude that rim breccia 79035 petrography, that is, very high ferromagnetic resonance, indicates that maturity is very high which is consistent with the above data from Morris et al. (1976, 1980). Is/FeO = 98, on the other hand, does not take into account a probable large Is/FeO reset due to the Van Serg impact.
An average of 4 similar U+Th analyses for rim breccias 79035, 79115, and 79135 gives U+Th = ~1.5 that, in turn, gives a post-impact ∆Is/FeO / Myr = 0.98 (1.5 × 0.58 + 0.11). That maturation rate gives an estimated exposure age since the Van Serg impact of ~5.1 Myr, inconsistent with the apparent ages of 1.6 Myr or ~1 Myr when compared to Shorty Crater (§13.1). Further, if the above total Is/FeO = 98 is considered, it gives a remaining exposure age of ~100 Myr for Van Serg surface ejecta, after any resets. The rim breccias and surface ejecta are interpreted below as ancient regolith excavated from below the 3.82 Ga ilmenite basalts. Great uncertainty must be attached to their exposures to maturation since that time.]
Column 6 in Table 13.23 shows reductions of 84% and 58% in the calculated ∆Is/FeO-based exposure ages for Sherlock (zone T+T*) and Steno, etc. (zone U) in core 79001 as compared to exposure age values in Table 13.15. These reductions in exposure ages reflect comparable reductions documented in Table 13.16 for deep drill core zones relative to source regolith cosmic ray exposure ages. The relatively low reduction of 33% in the exposure age of regolith ejecta from MOCR Crater (zone S), as well as the reasonable exposure age of 11 Myr for pre-Van Serg Gatsby Crater regolith ejecta, suggests that the ∆Is/FeO reset effects of impact shock are mitigated within near surface regolith. This mitigation may reflect the lower density and less compaction of near surface regolith that mitigate shock propagation.
13.4 Solar History in Nitrogen Isotopes at Van Serg Crater
The δ15N‰ vs. Is/FeO data for Van Serg Crater samples also provide illuminating implications for solar wind history. Table 13.24 summarizes δ 15N‰ and Is/FeO values reported for various depths in core 79001/2, as well as for measurements on the regolith breccias and the crater rim. As discussed in §6.2.3, nitrogen isotope data appears to reflect a factor of 3.4 increase in the energy of the solar wind, possibly some time after ~0.512 Ga (zone W* deposition).
[The tie to zone W* comes from the trend of increasing δ15N‰ in Fig. 13.12a that appears to begin with the younger zone W and culminates in a current δ15N‰ value of –118‰. It would appear to represent an increase in or beginning of solar fusion production of 15N.]
Fig. 13.29a is a plot of reported Van Serg nitrogen data given in Table 13.24, superposed on a summary of the trends in Figs. 13.12a and 13.12b from §6.2. The red arrows in Fig. 13.29a show increasing depth in upper drive tube 79002 and the green arrows show increasing depth in the lower drive tube 79001. Black sample numbers are for regolith rim breccias and half-trench samples.

 Fig. 13.29a. Plot of δ15N‰ vs. reported Is/FeO for Van Serg Crater double drive tube (79001/2), trench and regolith breccia samples given in Table 13.24. Dashed lines are the δ15N‰ vs. ∆Is/FeO trends shown previously for the deep drill core in §6.2’s Figs. 13.12a and 13.12b. Green plots and arrows are for lower core 79001, red plots and arrows are for upper core 79002, and black plots are from a half-trench through the ejecta blanket ~50 m and from the rim for breccia samples from the crater rim. The small numbers under the sample numbers are depths in cm of samples analyzed. Dashed oval includes breccias that have anomalously low δ15N‰ values.
The relationships between core 79001/2 samples represented in Fig. 13.29a could be interpreted as contradicting the earlier conclusions related to the δ15N‰ vs. ∆Is/FeO trends shown previously for the deep drill core in Figs. 13.11a and 13.11b of §6.2. Specifically, none of the plots in Fig. 13.29a correlate with the trend (black) of older zones (U-Z+Z*) in the deep drill core, but rather many cluster near the trend (red) for the younger zones (S-T+T*) and surface regolith samples. The plots in Fig. 13.29a, however, do not take into account the conclusion in §13.3 that ∆Is/FeO resets associated with the Van Serg impact have reduced the ∆Is/FeO values and corresponding exposure ages for their related deep drill core zones (Table 13.23, Column 5) relative to their calculated values in Table 13.15.
The ∆Is/FeO values in parentheses in Column 3 in Table 13.23 are calculated pre-Van Serg impact numbers for ∆Is/FeO, assuming each has been reduced by the percentages shown in Table 13.22, Column 6, for MOCR, Sherlock+Powell, and Steno, etc. For the samples in Table 13.23 relatively older than regolith ejecta from these three source craters, the average percentage ∆Is/FeO loss for Sherlock+Powell and Steno, etc. (71%) has been used in the recalculation.
 Fig. 13.29b. Plot of δ15N‰ vs. reported Is/FeO for Van Serg Crater double drive tube (79001/2), trench and regolith breccia samples with reported ∆Is/FeO values increased by percentages indicated in Table 13.23, Column 3 (in parentheses), Dashed lines are the δ15N‰ vs. ∆Is/FeO trends shown previously for the deep drill core in Figs. 13.12a and 13.12b. Green plots and arrows are for 79001 and red plots and arrows are for 79002 and black plots are for breecia samples from the crater rim and from a half trench into the ejecta blanket ~50 m from the rim. Dashed oval shows breccias that have anomalously low δ15N‰ values. The numbers under the sample numbers are depths in cm of samples analyzed.
Using these recalculated values for ∆Is/FeO, Fig. 13.29b shows a plot of the revised data previously plotted in Fig. 13.29a (note scale changes). This new plot shows that most of the deeper core samples (79001) are, indeed, related to the older deep core trend, supporting the hypothesis that they are samples of older regolith ejecta zones. Exceptions are:
- The three 79002 samples from 2-17 cm appear to have largely equilibrated with the zones S, T, and surface regolith trend, as they have all been exposed at the lunar surface during the last 10 Myr or so.
- As discussed further below, half-trench samples 79221 and 79261 may reflect an ancient ∆Is/FeO inheritance, as may the two rim breccias (79035, 79135).
- 79002 at 17 cm. correlated with Gatsby Crater in Table 13.22, has a δ15N‰ value of +2‰ that is consistent with Gatsby Crater being created after the increase in the solar wind energy and thus greater 14N fractionation.
- Inhomogeneity may explain the inconsistency between the δ15N‰ values of core 79002 at 2 cm and the skim trench sample 79221 at 0-2 cm (+20‰ and –76‰ to –127‰, respectively).
- The crater rim regolith breccia 79035 with highly negative values of δ15N‰ of at least –210‰, along with 79135, was excavated by the Van Serg impact at its deepest penetration. These δ15N‰ values are much more negative that the projected δ15N‰ = –118‰ of the current solar wind and suggest an exposure to solar wind in a pre-lunar magnetic field period when the 15N/14N ratio in the solar wind was much lower than today. Although there is no ∆Is/FeO data for 79035, its low negative δ15N‰ values project to very high ∆Is/FeO values on the deep drill core older ∆Is/FeO / δ15N‰ trend. These low δ15N‰ values, in turn, imply that the Van Serg impact tapped into regolith developed when solar wind impinged on surface regolith in the absence of a global magnetic field prior to ~25 Ga (Tikoo et al., 2017). When that ancient regolith was later protected from solar wind by the rise of the global field at ~4.25 Ga, maturation by alpha+beta particles and impact gardening continued to fractionate 14N from l5N.
- The conclusion in item 5, above, is confirmed by the move of the plot for trench skim sample 79221 in 13.29b to roughly coincide with the trend (black) of old deep drill core zones after recalculating ∆Is/FeO values to account for impact resets.
In the pre-magnetic field period, the very low δ15N‰ regolith postulated in item 5, above, and sampled at Van Serg Crater would need to survive largely intact (1) the period of large basin formation (South Pole Aitken, Crisium, Serenitatis); (2) incorporation in Imbrium ejecta (Sculptured Hills); and (3) being covered by ilmenite basalt lava and pyroclastic ash (~3.82 to 3.60 Ga) until finally exposed by the Van Serg impact about 1 Myr ago from below the basalt and ash. 10 or more meters of regolith ejecta apparently prevented post-Imbrium exposure. The Van Serg impact excavation (Fig. 13.30), then, appears to have penetrated below any basalt, ash and all ejecta blankets into Imbrium ejecta (Sculptured Hills) that included the ancient regolith. Further, an area of dark material exposed on the floor of Gatsby Crater suggests that the dark gray regolith at Van Serg Crater may have significant lateral extent.
Alternatively, at ~700 m in diameter, Cochise Crater probably excavated to about 150 m depth, potentially excavating below both the older Shakespeare ejecta blanket and any underlying basalt and ash as well as older regolith ejecta zones. Van Serg’s impact much later took place through Cochise’s ejecta blanket that may have included this ancient regolith that was part of the Imbrium ejecta. In fact, as we drove along the east rim of Cochise toward Van Serg Crater, I reported (Chapter 12; Volume 5), “… looking at the western [southwestern] wall of Cochise, I can see a contact within the subfloor between albedo units, one of which is a light tan-gray and the other is a light blue-gray.” The “light blue gray” unit may be ilmenite basalt and would indicate significant penetration by the Cochise impact into underlying Imbrium ejecta (Sculptured Hills) that included the ancient regolith. The mixing of ancient regolith with orange+black ash, however, makes this alternative unlikely.
A schematic summary of the path of events affecting Taurus-Littrow that would affect the low probability of ancient regolith surviving intact is shown in Fig. 13.30.
 Fig. 13.30. Schematic representation of major events affecting the geology of Taurus-Littrow since accretion of the Moon as well as the path that needed to be followed by ancient regolith sampled at Van Serg Crater. Source crater codes and ages are for deep drill zones listed in Table 13.15 and for the six large basins that contributed ejecta to the area (§3).
End of Upload 21
ENDNOTES:
-
-
- Gupta, R. P. (2023). JWST early universe observations and ΛCDM cosmology. Mon. Not. Roy. Astron. Soc., 524, 3385-3395. ↑
- Tikoff, B. and T. F. Shipley (2025) Grand Canyon, USA: Lumping and splitting to make sense of a (somewhat) predictable world. GSA TODAY, 35, 4, 4.9
-
-
-