“Something Miraculous Happened over 26 Billion Years Ago[1]. We all are living with or studying its wonder, its order, and its consequences.”
Chapter 13
HISTORY IN THE DUST
Regolith of Taurus–Littrow: Ejecta Zones, Source Craters,
Ages and Implications
 A part of a DTM constructed from four Apollo 17 nadir metric mapping photos from rev. 14 and four from rev. 15 of the Taurus-Littrow environs (north is up). The valley extends from the upper middle towards the lower right. The main features are the small Family Mountain at the valley entrance at left; the Lee-Lincoln Scarp crossing the valley from the South to the North Massifs; the avalanche from the northeast facing slope of the South Massif (horseshoe crab shaped mountain in center); the Crater Cluster in the valley center north of Bear Mountain; the Sculptured Hills mostly in shadow to the right of the North Massif; and also the East Massif casting a large shadow at the right end of the valley. (Total DTM triangulated from NASA photos AS17-M-0445 through M-0448 and AS17-M-0594 through M-0597 by the editor (Wells, 2021: Fig. 3.13c)).
Preface
Comparison of the valley of Taurus-Littrow on the Moon with the Grand Canyon of the Colorado on Earth has been irresistible for over half a century. Since I explored this last site of the Apollo lunar landings, I have used this reference repeatedly.
Recently, Basil Tikoff and Thomas Shipley wrote in awe of the Grand Canyon[2]: “Standing on the rim of the canyon, you viscerally experience the name—it feels big in a way that pictures do not capture. The immensity of absence, which is the Grand Canyon, is conveyed across all of the senses. For instance, the soundscape of the rim is not silence; you can hear the wind. Yet the sound quality is unfamiliar; absent are the common echoes from the nearby surfaces. The space of the canyon is so immense that echoes disappear. The Grand Canyon’s ubiquity in geology and popular culture reflects in part, the clarity with which stories of time are written in its space.”
If Tikoff’s and Shipley’s insights about the Grand Canyon were applied to Taurus-Littrow on the Moon, it might be said: “Standing on the floor of the valley of Taurus-Littrow, your brain must assimilate what it knows about size without references to the familiar and without sound other than the life-preserving movement of oxygen in the fragile envelope around you. Brilliant massif walls, illuminated by a morning Sun, silhouetted in reverse against a blacker than black sky, rising above a chasm deeper than the Grand Canyon, and watched over by the seemingly stationary blue and white Earth above the highest of the confining walls. The valley’s geological record of time precedes that of even the magnificent strata of the Grand Canyon, as far into the past as that natural wonder takes us, but its pages of the history of our solar system are far more subtle, but nonetheless reflect the order imposed by Creation.”
The presence of an experienced field geologist as Lunar Module Pilot on Apollo 17’s mission to explore the valley of Taurus-Littrow, as well as over 53 years of reports on analytical studies from the returned samples and geophysical data, provide an unique opportunity for integrated scientific synthesis. Large scale reviews of the vast stores of observational, photographic, petrographic and analytical data for the areas of Apollo exploration have not occurred over the 40 to 50 years since these data were published, documented in “gray” unpublished volumes and abstracts, or burned into explorers’ memories.
Beginning in the 1950s, funding for lunar science has almost entirely been the purview of the National Aeronautics and Space Administration (NASA) and the National Science Foundation (NSF), with earlier contributions by the Geological Survey and various academic institutions. The tendency of scientists to focus on narrow, definable questions as well as on the equally narrow interests and results-oriented biases of federal agencies is understandable. However, these agencies almost never have encouraged proposals to undertake broad integration and correlation of the full range of the resulting vast reservoir of available information. Small exceptions to this existing paradigm of closely bounded research efforts have been NASA’s funding of early “consortium” studies of specific mission sample suites and the recent Apollo Next Generation Sample Analysis (ANGSA) program. The latter, however, still largely concentrated on one Apollo 17 drive tube core sample.
Over the last 15 years or so, the author has attempted the synthesis of the observations, imagery and samples related specifically to his Apollo 17 exploration of the valley of Taurus-Littrow. Such research is a dynamic and, of course, a continuous process. As the project progressed, new insights required sequential revisions of previous approaches to portions of the synthesis that, in turn, required alternative approaches to be considered. Eventually, an internally consistent picture of the geology and history of the Taurus-Littrow valley emerged. The iterative nature of the synthesis of many data sets results in early sections of this work referring to later sections so that the reader is aware of the details that led to various integrated findings that supplanted earlier, more tentative results.
The ~50 km long Taurus-Littrow, fault-bounded valley radially penetrates the outer ring of uplifted and augmented massifs that encircle the 740 km diameter, Serenitatis Basin. Taurus-Littrow’s varied, 1600 to 2200 m high valley walls of impact melt and fragmental breccias constitute ejecta from the Crisium, Serenitatis, and Imbrium basin-forming events. Lithoclastic ash, basaltic lava, pyroclastic ash, and subsequent impact-derived debris that partially fill the valley and covered earlier features provide insights into a variety of eruptive, impact and mass wasting activity. The first of such activity closely followed deposition of ejecta from the Imbrium Basin and additionally provide insights into the nature and origin of materials in the lunar interior.
The synthesis of these data has been greatly influenced by early studies that relate to the upper-most 951 million years of a 3.8 billion year accumulation of regolith ejecta that comprise the 294 cm, Apollo 17 deep drill core. Isotopic and maturation data from the core and other samples indicate that the average energy of the solar wind increased about 514 million years ago and then increased again about 200 million years ago, this latter increase by over a factor of ~3.4. A spectrum of impacts, avalanches, debris flows, boulder shadowing, and thrust faults that occurred subsequent to valley volcanism add additional perspectives into recent lunar and solar histories and provide samples from which values for the rates of aging of exposed debris (regolith) have been derived. These rates of aging, in turn, allow estimates for the ages of 10 regolith ejecta source craters located throughout the valley.
There is great and unique value of a far-ranging synthesis of data related to each Apollo landing site in increasing understanding of the geological history of specific sites as well as the internal, solar and other dynamic factors recorded in that history.
Harrison H. Schmitt
Apollo 17 Lunar Module Pilot and Field Geologist
Major Findings:
-
-
- The Apollo 17, 294 cm long, deep drill core sample of Taurus-Littrow regolith (70001/9; see Fig. 13.1a↓, Fig. 13.1b↓, Fig. 13.5↓ for location) is comprised of 11 strata or zones of regolith ejecta derived from ten 400-800 m diameter source craters and one 1400 m source crater, the ages of which span 951 million years of lunar history and represent the upper portion of ~11 m of regolith ejecta deposited on ilmenite basalt, the youngest eruption of which was at ~3.795 Ga. (§3.0)
- Increases in exposure-related maturity indices (∆Is/FeO) in the core’s regolith ejecta zones, due to the reduction of structural Fe++ to Feº, is the result of (1) alpha+beta particles from the decay of uranium and thorium (∆Is/FeO / Myr = 0.58 per ppm U+Th); and (2) surface exposure to solar protons (∆Is/FeO / Myr = 0.11 for young regolith and 0.032 for old regolith). (§6.0)
- Exposure ages and deposition ages for the deep drill core’s regolith ejecta zones can be calculated from the zone’s total half-cm log of ∆Is/FeO divided by the zone’s total ∆Is/FeO / Myr. (§6.0, §7.0)
- Half-cm logging of the deep drill core, comparison of core zone cosmic ray exposure ages with ∆Is/FeO-based exposure ages, and Is/FeO relationships at Shorty and Van Serg Craters show that impact shock partially resets the “Is” component of maturity indices, ranging from a few percent for small impacts that average one every ~5.8 Myr near the core to over 95% for zone source craters whose impacts that average one every ~95 Myr. (§4.0, §8.0, §9.0, §11.0, §13.0)
- Relationships between the core’s regolith ejecta zones’ ∆Is/FeO and δ15N‰, and ancient regolith δ15N‰ values <–210‰ show: (1) a sharp change in δ15N‰ from ≤210‰ to about –118‰ after ~514 Myr and before 394 Myr; (2) a lunar δ15N‰ accretionary value of ~+80‰; and (3) a factor of ∼3.4 increase in solar wind energy at ~199 Myr ago, with the increase in solar 15N production at ~514 Myr, within probable error limits, being related to warming associated with the Cambrian Explosion of oceanic life on Earth at ~538 Myr. (§6.0)
- The absence of Is/FeO values >2 in glassy pyroclastic ash in core 74001/2, particularly values that would result from alpha+beta particles, and the attenuation of Is/FeO growth in deep drill core zones as a function of ash content, indicates that, in glass, the separation of Fe++ from uranium and thorium atoms and from access by solar protons is sufficient to prevent almost all Feº formation. (§7.0, §5.0)
- Positive values for δ15N‰ (+13‰) in buried pyroclastic ash of core 74001/2, versus a current solar wind value of ~118‰ indicate a chondritic lower mantle source for the ash magma and its volatiles and suggest a lunar origin by accretion and capture rather than from a giant impact on the Earth. (§10.0)
- The young and old light mantle avalanche deposits are two of at least seven mass wasting deposits from the slopes of the Taurus-Littrow South Massif and have Is/FeO-based exposure ages, respectively, somewhere between 27-32 Myr and 10-15 Myr and deposition ages, respectively, somewhere between of 27-32 Myr and 37-47 Myr with a deposition age of 41-51 Myr for the newly identified ancient light mantle. (§17.0)
- Mass wasting activity from the slopes of the South and North Massifs and from a peak in the Sculptured Hills is likely the consequence of repeated thrust faults along the Lee-Lincoln Fault caused by continued contraction of the gradually cooling Moon. (§17.0)
- Comparison of North and South Massif regolith samples from the valley of Taurus-Littrow indicate that volatile-rich, lithoclastic volcanic eruptions preceded those that produced the ~3.795 Ga mare basalts. (§25.0)
- Partial coronas in troctolite 76535 between plagioclase and olivine, consisting of pressure-release, retrograde symplectitic textures made up of Cr-spinel intergrown with clineoproxene next to plagioclase and with orthopyroxene next to olivine have replaced pressure-stabilized, prograde Cr-rich garnet and indicate this sample and crushed dunite 72415 originated below ~400 km and 500 km, respectively, in the fractionally crystallized magma ocean. The movement of these rocks to higher levels where they were accessed by later basin formation was a result of upper mantle overturn triggered by the Procellarum basin-forming impact at ~4.35 Ga that also resulted in the partial pressure-release melting of the warm upper mantle to produce Mg-suite plutons in the lower crust and the migration of urKREEP residual magma to the Procellarum region. (§27.0)
- The synthesis of data from Taurus-Littrow indicates that the Imbrium Basin forming impact occurred between 3.850 and 3.795 Ga. (§22.0)
- The addition of water to the early impact-generated regoliths of Earth and Mars would create smectic clay mineral species (phyllosilicates) whose adaptive silicate sheet crystal structures and compositions could serve as templates for the organization and stabilization of complex, pre-biotic and biotic organic molecules. (Schmitt, 2015, with update to be published subsequently.)
-
1.0 Introduction
Any discussion of the science of the lunar regolith must acknowledge the foundational observations and interpretations made by Gene Shoemaker (Shoemaker, 1965; Shoemaker et al., 1967), based on his early studies and on the Surveyor III television observations of its landing site in Mare Cognitum. Shoemaker’s insights were followed by the seminal work of Larry Taylor that advanced understanding of the lunar regolith sampled by the Apollo astronauts. Taylor’s and his associates’ vast contributions to deciphering the character and formation of lunar regolith are without peer (e.g., Taylor, 1988; Carrier et al., 1991; Taylor et al., 2001a, 2001b; Pieters et al., 2010).
Contributing to the studies by Taylor and others, the Apollo 17 mission to the valley of Taurus-Littrow (Schmitt and Cernan, 1972a; Schmitt, 1972, 2021; Wolfe et al., 1981; Meyer, 2012) provided a uniquely broad and diverse suite of regolith samples and the massif and volcanic components contained within them. Review, integration and synthesis of the geologic context of this sample suite and published analytical research continue to give special insights into the processes of regolith formation as well as indirect clues related to other important issues of lunar geology and solar and Earth history. Of particular importance to the development of various regolith-related hypotheses have been the maturity indexes (Is/FeO) conceived of and measured by Richard Morris (1976, 1978), and Morris et al. (1975, 1979, 1989)); the nitrogen isotopic measurements by Mark Thiemens and Robert Clayton (1980), Richard Becker and Clayton (1975, 1977); and John Kerrridge (1975) and Kerridge et al. (1991); cosmic ray exposure ages by Peter Eberhardt et al. (1974), Otto Eugster (1985) and Eugster et al. (1977, 1979, 1981a, 1981b); uranium and thorium analyses by Lee Silver (1974); and, of course, the wonderful Lunar Sample Compendium of Charles Meyer (2012). These pioneers were all assisted by innumerable colleagues of the Apollo lunar science generation.
The Lunar Source Book (https://apollojournals.org/alsj/) and the Lunar Sample Compendium (https://curator.jsc.nasa.gov/lunar/lsc/index.cfm) produced by Grant Heiken, David Vaniman, and Bevan French (1992) and Charles Meyer (2012), respectively, and the Professional Papers on the geology of individual missions published by the Geological Survey are invaluable sources of compiled data and references from a nearly infinite number of sources. Most recently, the Apollo Next Generation Sample Analysis (ANGSA) program has added significant data for integration into studies of avalanche deposits (Shearer et al., 2022, 2024) and Thermoluminescence of shadowed samples (Sehlke and Sears, 2022; Sears et al., 2024).
The analytical data are bolstered by the petrographic observations of Grant Heiken and David McKay (1974), Laul et al. (1978, 1979), Jeffrey Taylor and his colleagues (1979, 2001a), and Nagle and Waltz (1979), along with the author’s field observations during the Apollo 17 mission (Chapters 10-12; Schmitt, 2023a, 2024a, b, c). Equally valuable to this synthesis is Eric Jones’s Apollo 17 Apollo Lunar Surface Journal with its crew annotated transcripts and referenced Hasselblad camera images (https://apollojournals.org/alsj/a17/a17.html) and Ed Wolfe and his colleagues’ (1981) integration of early Apollo 17 geological interpretations with sample locations and other data.
1.1 General Nature of Lunar Regolith
Particles that make up the Taurus-Littrow regolith (Shoemaker, 1965; Shoemaker et al., 1967; Heiken and McKay, 1974; Pieters et al., 2010) consist of varying proportions of mineral and rock fragments, regolith breccia fragments, volcanic ash beads and shards, and abundant impact generated, vesicular glassy agglutinates containing some or all these other particles. The mineral and rock fragments and bulk compositions of given regolith areas tend to reflect mixtures of regolith developed on near-by bedrock units. Other than spherical beads of volcanic ash and some transported impact glass, almost all particles are irregular in shape with vesicular glassy agglutinates having largely fractal outlines. Particle sizes range from hand-specimen size and larger to less than a micron with up to fifty percent by weight being less than about 70 microns, and they generally show an approximate bell-shaped size-frequency histogram (Graf, 1993), although variations in histograms’ shape and peak sizes are very useful in some interpretations. Observationally, rock fragments >2 cm in diameter tend to be <5% of the total surface area of inter crater areas (Schmitt, 1972, 2023a, Chapters 10-12; 2024a, b, c; Meyer, 2012, sample 70001/9; Hasselblad images).
Broadly distributed, ancient silicate-dominated surface regolith on Earth and apparently on Mars, likely played a role in the origin of complex organic molecules and their organization into replicating life forms (Schmitt, 2015). Once stable and relatively cool planetary crusts had differentiated from an accretionary magma ocean and stabilized in an impact-dominated and water-rich environment, clay minerals (phyllosilicates), particularly of the smectite group, would have been the dominant mineral species at the Earth’s surface. The characteristic of smectitic clays to incorporate many elements and molecules into their hydrous sheet-like crystal structure offered the potential of organizing organic bases and essential elements into increasingly complex forms.
High-energy solar wind ions and micro-meteors impacting the Moon apparently erode plasmas from exposed particle surfaces that re-deposit on local mineral and glass surfaces (Taylor, 1988; Taylor and Meek, 2005; Burgess and Stroud, 2018; Cymes and Burgess, 2022; Cymes et al., 2022; Li et al., 2022). Protons (H+) in the average solar wind have energies of a few Mev and abundances of about (6 ions/cm3. Protons from solar flares and coronal mass ejections (CMEs), however, arrive at the Moon with Gev energies and abundances of 100s of ions/cm3 (Reames, 2017) and may dominate the plasma-forming process. The resulting re-deposition of plasma material from this so-called “sputtering” process, probably with some contribution from micro-meteor impact plasmas, produces a nearly ubiquitous but discontinuous, ~50 µ thick patina of alumino-silicate glass on regolith particles and rock surfaces. The glass present in the pits formed by micro-meteor impacts on rock surfaces suggests a contribution of impact plasmas to these patinas.
Alpha and beta particles from internal uranium and thorium decay, with minor contribution from solar proton radiation, reduces Fe++ to Feº (npºFe) (Morris et al, 1975; Taylor, 1988). Impact gardening gradually exposes new regolith particles to the surface-specific processes and mixes previously exposed particles and U- and Th-bearing minerals throughout the zone. The titanium-bearing mineral ilmenite, FeTiO3, appears to be the preferred host for this concentration of nano-phase iron (Cameron, 1990; Taylor and Meek, 2005). Solar wind volatiles may be concentrated in 5-50 µ diameter vesicles as well as being present in crystal defects and cracks (see Taylor, 1988; Taylor et al., 2005; Burgess and Stroud, 2018; Cymes and Burgess, 2022; Cymes et al., 2022; Li et al., 2022).
Nano-phase iron production occurs throughout a regolith zone due to ionizing alpha particles, and probably by associated beta radiation, that comes from internal uranium and thorium decay. This source of nano-phase iron has been neglected in past maturation studies; however, Bower et al.’s (2016) analysis of pleochroic halos around uranium- and thorium-bearing zircons in biotite found that radiation from uranium and thorium decay also converts structural Fe++ in biotite to Feº. Alpha+beta radiation, therefore, must be taken into account in the interpretation of variations in regolith maturation, as uranium and thorium exist in amounts of 1-4 ppm in Taurus-Littrow regolith samples. Extremely fine fragments of minerals and glass containing both elements have been broadly disseminated during long-term impact gardening of lunar regolith. Additionally, earlier in lunar history, the concentrations of these continuously decaying elements were significantly greater than today.
2.0 Error Limits Related to Taurus-Littrow Data Synthesis
Much of the following synthesis of over 55 years of data on the Taurus-Littrow regolith involves the integration of different types of measurements (maturity indices, radio-isotopic and cosmic ray ages, petrographic and chemical contents, etc.) each of which have varying estimates of analytical error limits, although many such limits are not reported. Accumulated error limits resulting from various calculations, therefore, can grow to numbers that suggest very large uncertainties. On the other hand, the synthesis itself includes various direct and indirect tests on the reasonableness of the results of calculations, as well as, in some cases, confirmation of those results by independent approaches or by their compatibility with clear constraints imposed by the overall geology of the area, or of the Moon, or of the history of the Earth and Solar System. As a consequence, when available, and unless otherwise noted, the error limits on original published data are quoted, but the accumulated hypothetical error limits inherent in various calculations generally are not considered except in terms of the reasonableness of the results.
In this context, the underlying, measurable parameter for initially evaluating the formational history of the lunar regolith consists of the Is/FeO maturity index for returned regolith samples developed and measured by Richard Morris (1976, 1978) and Morris et al. (1975, 1978, 1979, 1989). This objective, maturity data consists of measuring the intensity of the ferromagnetic resonance (Is) of a sample and then normalizing it for comparison with other samples by dividing by each sample’s FeO content. The author of this current narrative originally considered the Is of a sample basically to reflect the amount of nano-phase iron (np°Fe) produced by solar wind proton reduction of regolith Fe++ (Pieters et al., 2010) in proportion to the samples FeO content. It was eventually realized that alpha+beta particle radiation from the decay of uranium and thorium contributes to the formation of np°Fe (Bower et al., 2016).
Morris (1978) states that the precision of the Is measurement used in the Is/FeO determinations is ±5%. As the error limits of FeO determinations used by Morris (usually from R. Warner, unpublished) are not available, measured Is/FeO values used throughout this paper will be assumed to be accurate to be within 5%, that is, Is/FeO = 20 would be ± 1 and Is/FeO = 80 would be ± 4. This assumption implies that inaccuracies in analytical determination of values for FeO are included in the 5% stated by Morris and, nonetheless, would be small enough not to affect the inherent value of Is/FeO as a synthesis tool. On the other hand, consistency in the results of the following synthesis suggest that the precision of Morris’s combined Is and FeO measurements is significantly better than ±5%, possibly about ±2% or even better.
3.0 Apollo 17 Deep Drill Core
3.1 Introduction
The Apollo 17, ~3 m deep drill core (70001/9) (Baldwin, 1973; Meyer, 2012) constitutes the most complete vertical sample of the lunar regolith obtained to date (Meyer, 2012; Heiken, et al., 1992). The deep drill core was obtained during the deployment of the Apollo 17 Apollo Lunar Science Experiment Package (ALSEP) at a location about 180 m west of the landing point of the Lunar Module, Challenger (Fig. 13.1a↓, Fig. 13.1b↓). Synthesis of published analytical data provides new insights into the formational, depositional and exposure history of regolith sampled by this core. Of particular importance are the investigations of maturity indices (Morris et al., 1979); petrographic characteristics (Vaniman and Papike, 1977; Vaniman et al., 1979; Taylor et. al., 1979; Heiken et. al., 1992); bulk compositions (Laul et al., 1978, 1979, 1981), volatile element concentrations (Laul and Papike, 1980a, b), nitrogen isotopic measurements (Thiemans and Clayton, 1980), cosmic ray exposure age determinations (Eberhardt et al., 1974), and uranium and thorium concentrations (Silver, 1974; Laul et al., 1978, 1979, 1981; compilations by Meyer, 2012).
 Fig. 13.1a. Apollo 17 landing site with the remaining Challenger Lunar Module descent stage located at right; the Apollo Lunar Surface Experiments Package (ALSEP) deployment site; and the deep drill core (DDC; white arrow) site located at left outlined by the light colored box. The ~50 m diameter Rudolph Crater is at top left (LROC image).
 Fig. 13.1b. Enlargement of Fig. 13.1a to show the detail of the ALSEP experiments and the deep drill site locations. Thin parallel tracks were made by the LRV. The heavier, darker tracks were made mostly by my foot traffic. (LROC image).
The in situ inter-crater regolith sampled by the Apollo 17 deep drill core is made up of eleven definable zones of regolith ejecta from 400-800 m diameter craters and one 1400 m diameter crater within about 6 km of the core site (Schmitt (2019b, 2021, 2023a)). Such zones superficially resemble each other, but they show significant differences in detailed maturity (Morris et al., 1979), lithology and mineralogy (Taylor et al. (1979)), and bulk chemical compositions (Laul et al. (1978, 1979, 1981); Meyer (2012); Silver (1974)). These differences, in turn, reflect the compositions and, in part, the pre-excavation maturities and cosmic ray exposure ages (Eberhardt et al. (1974)) of the source regoliths.
The 11 distinct regolith ejecta zones comprise the ~294 cm of material in the deep drill core and record, directly or indirectly, a significant portion of the cratering, regolith maturation, and volcanic history of Taurus-Littrow. These zones also contribute to understanding the distribution of geological units and sequence of impact cratering events that created a corresponding 14 potential source craters, 400-1400 m in diameter, that lie within about 6 km of the core site. The maturity of these regolith ejecta zones due to space weathering and internal alpha+beta particle radiation, as well as associated cosmic ray exposure age data, further allow the approximate dating of these large impact events (§6.0). Certain aspects of the history of the solar wind also are recorded in the core.
Much of the following synthesis relies on analyses and observations of portions of the Apollo 17 deep drill core conducted by many researchers; however, the exact length of the returned core, and thus the precise depth of analyses are not absolutely certain within a few centimeters. For example, Morris et al.’s (1979) maturity index data measured at half-cm intervals are available from –1.30 to 285.85 cm (Morris, pers. comm.), while Silver’s (1974) uranium, thorium and lead analyses and Eberhardt et al.’s (1974) cosmic ray exposure ages are reported up to 290 cm, and Meyer’s (2012) compilation of element analyses goes to 294 cm. To complicate matters further, Meyer (2012) states that when the core was opened, there was a “10-12 cm void” at the base of the upper pair of returned drill stems, that is, where core sample 70008 is now defined. This “void” possibly relates to Astronaut Cernan’s statement, made while the core was still in the ground, that the top, stabilizing “plug” for that section ultimately moved about two-thirds of the length of the compacting rammer. This operation compressed the less compact upper portion of cored regolith. A 10-12 cm thickness of low-density regolith at the surface of inter-crater areas is consistent with direct observations during Apollo 17 EVAs.
Top core section, 70009, is listed in Mitchell et al. (1973) as having a length of 25 ± 2 cm, about 15 cm less than the 40 cm of a full section. As the rammer was about 50 cm long, Cernan’s statement probably meant that “two-thirds” of the rammer was still showing outside the core section for his statement to match Mitchell et al.’s information. In light of the above, and, as Mitchell et al. measured the total “drill stem depth” (not core length) at 305 ± 1 cm with 95-97% recovery, the total length of “core” will be assumed here to be ~294 cm, a length which also matches the Meyer report. Morris (pers. comm.; Morris et al., 1979) records 284.65 cm as the depth of the last Is/FeO measurement given in Morris et al. (1979), but also says that the first measurement was at a depth of “minus 1.30 cm.” These figures suggest that there is ~7 cm of core at the bottom for which Is/FeO data was not obtained.
The following probably contributed to the “10-12 cm void” reported by Meyer:
-
- It is certain that the loosely consolidated upper 10-15 cm of the regolith compacted upon insertion and “ramming” of a plug on top of the core in the first drill stem section before extraction of the drill stem from the regolith.
- During handling and transport to the Lunar Receiving Laboratory in Houston, the core in the first of two drill stem as sections, as well as the top plug, slid away (upward) from the bottom cap.
As will be detailed below (§5.0), the chemical composition of three samples from the upper 20 cm of the compacted core (Laul et al., 1978) and the composition of nearby control sample 70181 are almost identical, indicating that the control sample gives a good representation of the elemental and mineralogical makeup of the top portion of the core.
3.2 Deep Drill Core Maturity Indices and Regolith Ejecta Zones
Morris et al. (1979) have reported, graphically, the maturity indices (Is/FeO) for nearly the full length of the Apollo 17 deep drill core (Fig. 13.1c↓). These Is/FeO values reflect the degree of reduction of Fe++ to Feo by internal alpha+beta and surface solar proton particle radiation. They have been derived from the ferro-magnetic response of nano-phase iron (npoFe) particles in regolith samples, normalized to reflect the varying FeO content of the measured regolith samples. Morris et al.’s data plotted in Fig. 13.1c↓, with a representative example of the raw, detailed, half-cm resolution data set (Morris, pers. comm.) in Fig. 13.1d↓, indicates the existence of zones of regolith with significantly different degrees of exposure to the internal and external radiation as well as having distinct petrographic characteristics after comparison with other data. This conclusion is supported less precisely in Fig. 13.2↓ by agglutinate content (Taylor et al., 1979) and “cosmic ray track maturity” (Goswami and Lal, 1979). Of particular importance, however, are the variations in Is/FeO measured as a function of depth that provide data on relative age based on superposition.
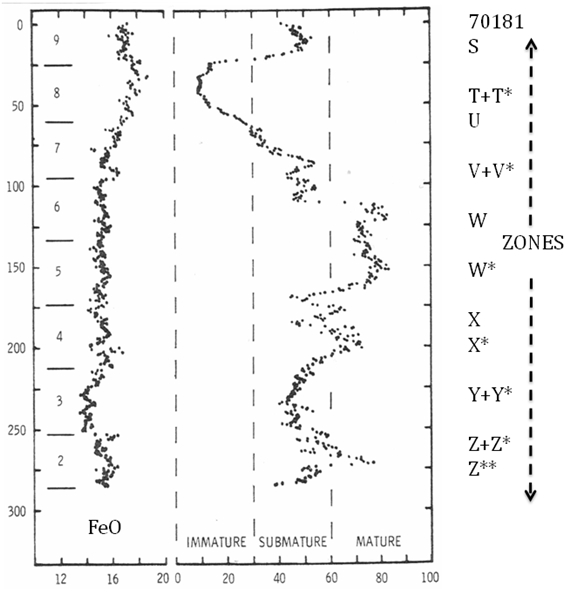 Fig. 13.1c. Plot of Is/FeO maturity indices and FeO content in the Apollo 17 deep drill core (Morris et al., 1979) with a rough indication of the identified regolith ejecta zones shown in the column on the right.
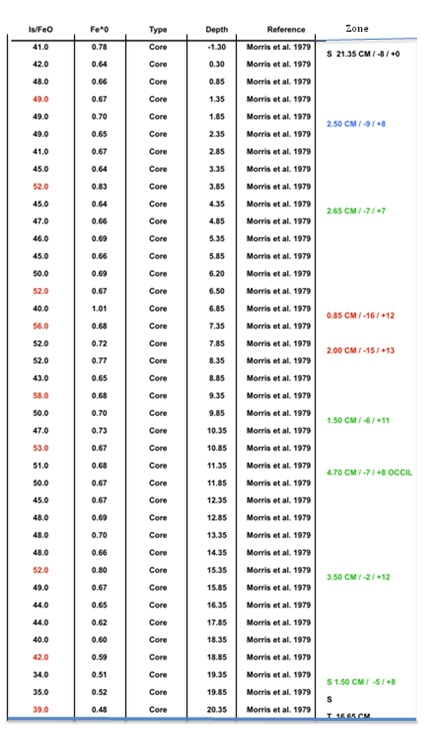 Fig. 13.1d. Representative portion of the half-cm resolution, raw data set (Morris, pers. comm.) related to the deep drill core’s Is/FeO values graphically represented in Fig. 13.1c↑. Column 6 indicates zone decreases and increases of Is/FeO noted during logging of this data set.
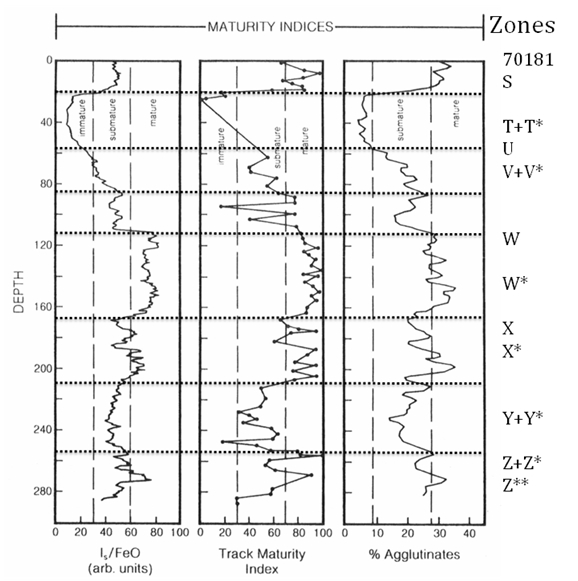 Fig. 13.2. Data on the maturity of the Apollo 17 deep drill core comparing Is/FeO maturity indices, left column (Morris et al., 1979); cosmic ray track density, center column (Goswami and Lal, 1979); and agglutinate content, right column (Taylor et al., 1979). Figure is after Heiken et al., (1992). Approximate regolith ejecta zones S-Z** are largely based on maturity data shown in Fig. 13.1c↑ as verified by logging of half-cm raw data (Fig. 13.1d↑).
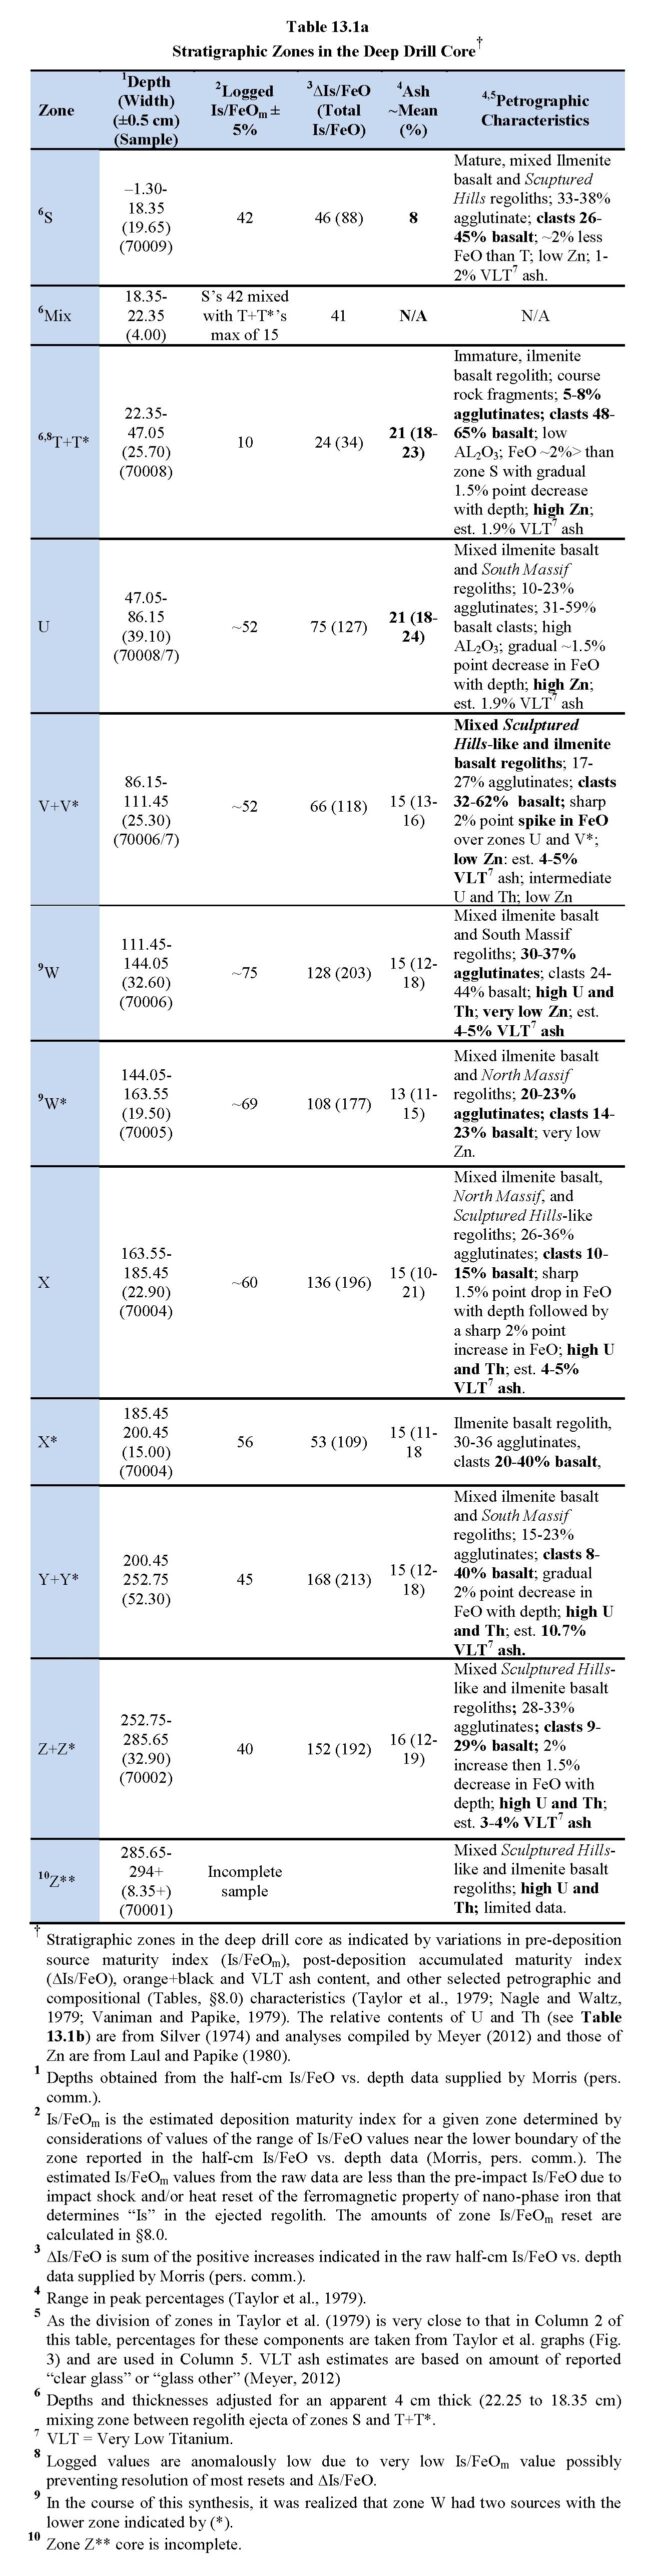
Table 13.1a↓ provides the depth intervals for defined regolith ejecta zones (Column 1) that are used in the subsequent synthesis of Taurus-Littrow geological, petrographical and analytical data. “Is” is a measure of ferromagnetic resonance and thus of the content of nano-phase iron produced through reduction of Fe++, that is, by (1) solar wind weathering, largely by energetic solar protons (Pieters et al. (2010)), and (2) internal alpha+beta particle radiation (Schmitt (2022a)). Micro- and macro-meteor impacts are contributing factors as they continuously garden and mix exposed regolith ejecta as well as produce complementary agglutinates. Sorting out the quantitative effects and implications of these factors is a significant focus of this synthesis.
In Table 13.1a↓ and in subsequent discussions, Is/FeOm and ∆Is/FeO refer to the estimated deposition value of Is/FeO of source regolith, as suggested by the half-cm logging, and the post-deposition accumulation of Is/FeO, respectively. As will be discussed below, the actual pre-deposition total Is/FeO of an integrated source regolith is not given by the value of Is/FeOm in the table, as there is strong evidence that the shock and/or heat of impact partially resets the ferromagnetic component of the near-impact nano-phase iron on which the “Is” component of Is/FeO is based. The extent to which impact reset has affected the logged estimated Is/FeOm given in Column 3 of Table 13.1a will be examined in §8.0.
With respect to zone S, it appears that the significantly higher velocity regolith ejecta from the large MOCR Crater (§3.4) that constitutes zone S resulted in more mixing with the previously deposited zone T+T* than at other zone boundaries. This mixing zone is about 4 cm thick (22.35 to 18.35 cm) and includes an increase in ∆Is/FeO of ~47 points that is not the consequence of maturation after zone S deposition. The logged post-deposition ∆Is/FeO of zone S is 46, confirmed by the reported ∆Is/FeO = 47 of control sample 70181 (Morris et al., 1978).
[In the course of this synthesis, the definitions of the various zones have varied. Initially, those definitions were based purely on broad changes in Is/FeO shown in Fig. 13.1b↑, however, correlations with various other associated data, the half-cm logging of Morris’s detailed data, and improved understanding of source regoliths indicated the need for improvements in these zone definitions. This process first suggested several subzones and then, in some cases, indicated recombination into the original set. This final process is reflected in zones labeled T+T*, V+V*, Y+Y* and Z+Z* in various tables and figures. Subzones W*, X* and Z** proved to be coherent stratigraphic units in their own right, but the asterisk (*) designations have been retained for them.]
Table 13.1a footnotes:
Links to §8.0, Table 13.1b↓, Taylor et al. (1979), Nagle and Waltz (1979), Vaniman et al. (1979), Silver (1974), Meyer (2012), and Laul and Papike (1980a).
Close examination of the plotted points in Fig. 13.1c↑ shows that the saw tooth patterns present along the length of the core have Is/FeO minima that are roughly constant for various sections of the core. The existence of these minima is best shown in the core sections between 115 and 170 cm. These locally constant minima are probably close to the original deposition maturity index (Is/FeOm). The precise deposition Is/FeOm values are uncertain within about ± 5 in most cases.
In defining stratigraphic zones based on Is/FeO values in the deep drill core, a large, sharp decease or increase in background Is/FeOm is interpreted as the boundary between zone depositions. These defined boundaries are generally supported by petrographic and compositional data as will be discussed in §5.0. The sum of the positive magnitudes of the small saw tooth spikes, showing the total increase in Is/FeO over Is/FeOm throughout a given zone (∆Is/FeO), is a measure of the post-deposition maturation of the zone before burial by a younger zone.
Table 13.1a↑ gives the regolith ejecta zones identified by examination of Fig. 13.1c↑, as refined by subsequent analysis that resolved a number of inconsistencies with other data. After preliminary definition, the indicated depths of zones were determined within half a centimeter with reference to the raw Is/FeO data provided by Richard Morris (pers. comm.).
Table 13.1b↓ compares the zone definitions in Table 13.1a with “unit” classifications given by Nagle and Waltz (1979), Vaniman et al. (1979), and Taylor et al. (1979). Although these latter three stratigraphic classifications and their associated descriptions do not line up exactly with the detail in Table 13.1a, they are generally consistent relative to evidence of maturity and source regolith characterization. Nagle and Waltz’s boundaries between zones S and T+T*, V+V* and W, W* X and X* in their sketch of the deep drill core are particularly consistent with the divisions in Table 13.1a Some relevant comparisons are given.
Table 13.1b footnotes:

Links for Nagle and Waltz (1979), Vaniman et al. (1979), Taylor et al. (1979), Table 13.1a↑, Silver (1974), Meyer (2012) and Laul et al. (1978, 1979, 1981).
3.2.1 Agglutinate Formation in Relation to Is/FeO Maturity Index
Vesicular “agglutinates” composed of mineral and rock particles in a glass matrix accumulate over time at the surface of lunar regolith. These agglutinates are the result of local impact melting and mixing. Their abundance is a rough measure of the relative exposure of a given regolith unit to the geologically steady impact of macro- and micro-meteors. The pattern of abundance of agglutinates (Taylor et al., 1979) in the deep drill core are shown in Fig. 13.3a↓.
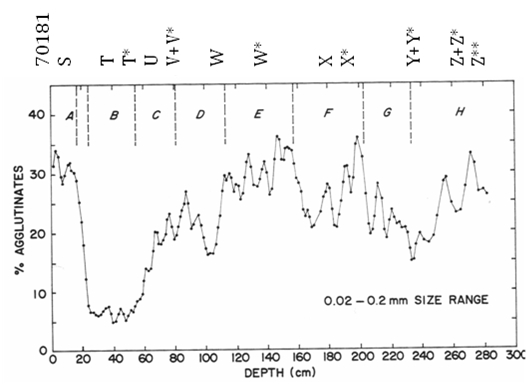 Fig. 13.3a. Graph of percentage variations in agglutinates as measured by modal analysis of 171 thin sections from the deep drill core (Taylor et al., 1979).
As deep drill core values of total Is/FeO (Morris et al., 1979) and total modal-% agglutinates (Taylor et al., 1979) rise with age, a correlation between these two parameters would be expected. Fig. 13.3b↓ gives a visual comparison of this relationship. The indicated graphical relationships zone by zone are given in Table 13.2a↓ with reference to total Is/FeO from Table 13.1a↑; maximum modal-% agglutinate peak; and the ratio of these two parameters. The ratio of total Is/FeO to maximum agglutinates averages 4.96 ± ~1.7 (lowest and highest ratios not included), verifying the close and constant relationship between nanophase iron production and agglutinate formation.
It would be expected that this relationship would carry over to the ratio between ∆Is/FeO and ∆Agglutinate. Values of ∆Agglutinate shown in Column 4 of Table 13.2b↓ were determined by summing the measured increases with decreasing depth for each zone shown in Fig. 13.3a↑ Dividing ∆Is/FeO values by ∆Agglutinate values (Table 13.2b) gives a significantly higher ∆Is/FeO to ∆Agglutinate ratio (average of 7.49) than the 4.96 average for total Is/FeO to maximum agglutinate. This discrepancy is likely due to the low resolution of measurements of changes in modal-% of agglutinates, that is, some increases were missed. This conclusion is supported by the fact that the ratios for total Is/FeO to total Agglutinate are generally less than those for ∆Is/FeO to ∆Agglutinate. From personal experience, microscopic “point counting” to determine modal-% of particles is an art of judgment more than of science.
 Fig. 13.3b. Comparison of total Is/FeO (Morris et al., 1979) and modal-% agglutinates (Taylor et al., 1979). Red dash lines indicate the zone widths in Table 13.1a↑.
 Links for Fig. 13.3a↑, Fig. 13.3b↑
3.3 Regolith Transport after Large Impacts in Lunar Gravity and Vacuum
Impacts have dominated the evolution of the Moon’s surface for much of its history (Wilhelms, 1987) from primordial accretion, to the creation of the magma ocean, to the creation of the mega-regolith that now constitutes the lunar crust, to the excavation of the large basins, to the evolution of today’s surface regolith since the formation of a region’s last large impact basin. As craters on the floor of the valley of Taurus-Littrow are, at least in large part, underlain by ilmenite basalt, regolith ejecta zones identified in the deep drill core have their origins in ejecta from impact craters formed since regolith began to form and accumulate on mare basalt erupted about 3.82 Ga (39-40Ar, Schaeffler et al. (1977)).
[Further consideration of the potential closure temperatures for the various isotopic systems suggests that the actual age of the youngest lavas would be close to the 39-40Ar age of rapidly cooled, fine-grained samples. One such sample, 70215, has been dated (using old 40K decay constants) by the 39-40Ar method at 3.82 ± 0.05 Ga. (Schaeffer et al., 1977). In this chapter, this date will be used as representative of the most recent age of the ilmenite basalt lava eruption.
As a means to further tighten the chronology of eruptive activity in Taurus-Littrow, it would be useful to precisely date by 39-40Ar methods other rapidly cooled ilmenite basalt samples from the Apollo 17 collection (e. g., 70075, 71537, 74235, 78586, and 78587). A close examination of un-numbered basalt fragments in the rake samples from Stations 1, 2, 6, and 8 also may include very fine-grained, rapidly cooled ilmenite basalts suitable for dating.
The recently reported revision of the 40K decay constant (Renee et al., 2010); Noumenko-Dezes et al. (2018)); Carter et al. (2020)) would lower previously reported 39-40Ar dates by about 0.025 Ga (Schmitt et al., 2017). However, in order to incorporate as many previously dated samples in this synthesis on a consistent basis, revisions based on the new constant will not be made.]
The regolith zones from the Taurus-Littrow valley floor that are represented in the deep drill core 70001/9 are distinctive because of the presence of detectable regolith contributions from five diverse geologic units related to the massifs surrounding the valley and volcanic ash deposits that contrast with the low SiO2 and low U+Th ilmenite basalt regolith. Those major units are the orange+black low SiO2 volcanic ash, Very Low Titanium (VLT) and high SiO2 volcanic ash, Sculptured Hills Mg-rich suite regolith, North Massif medium SiO2 and U+Th impact breccias, and South Massif high SiO2 and high U+Th impact breccias (§5.0). If new insights are to be gained about the source areas of these regolith zones, the geological challenge is to tie specific regolith zones to specific craters in the Taurus-Littrow valley.
An LROC image-based temporal study of new lunar craters in regolith (Speyerer et al., 2016), indicated that regolith at the sites of recent impacts has been ejected many crater diameters from the impact points and deposited continuously along their trajectory. In contrast, examination of ejecta from fresh craters in lunar basalt of comparable size to the 744 m diameter Camelot Crater (Schmitt et al., 2017) indicates that, much as on Earth, ejected bedrock, extends only about a crater diameter from the crater rim. Thus, it is very probable that significant amounts of regolith reached the deep drill core location after being ejected within a few micro-seconds of the instant of impact at the sites of large craters in the valley of Taurus-Littrow.
Support for this conclusion also is found in Oberbeck’s (1975) experiments on “hypervelocity impacts against a quartz sand layer resting on an ‘indurated’ quartz sand substrate.” Based on the Oberbeck’s and Speyerer et al.’s (2016) observations, and the numerous regolith zones identified in the Apollo 17 deep drill core, the following inferences about the impacts that created the 400 m diameter and larger craters in Taurus-Littrow valley appear to be in order:
-
- The geotechnical differences are profound between surface regolith and underlying blocky and solid bedrock, and result in a sharp discontinuity in reactions to impact shock and resulting excavation.
- At the instant of most impacts and during the subsequent few micro-seconds, the transfer of kinetic energy into overlying regolith creates a dense sheath of particles that are accelerated into an inverted, ~45º, continuously expanding, “conical wedge” (Fig. 13.4a↓) (see also Oberbeck, 1975, Fig. 24). (Less common, low angle oblique impacts appear to bias the shape of the sheath in the direction of impactor flight.)
 Fig. 13.4a. Schematic cross-section of a laterally expanding, inverted, conical wedge of ejected regolith formed micro-seconds before a reflected shock wave fully excavates a lunar impact crater.
-
- The initial conical wedge containing ejected regolith will have its unit mass and velocity of contained particles decreasing away from their source as a function of the radially outwardly decreasing kinetic energy released by the impact and the original density and effective depth of regolith in the impact area.
- A proportionally large amount of regolith near the immediate impact point will be accelerated to the highest velocities in the conical wedge. Initial regolith particle velocities, however, are rapidly reduced as the lateral shock wave encounters more and more regolith mass until expansion of the initially flat, nearly cylindrical crater in the regolith ceases to expand due to the lateral resistance of the material encountered.
- As lateral kinetic shock energy dissipates and the transient flat crater diameter increases, more and more mass of regolith is exposed to a lateral shock wave of less and less energy per unit volume.
- Both the radial explosive energy and the ejected mass per cylindrical unit of volume decreases to zero as the energetically maximum possible flat crater diameter is reached.
- The distribution of total ejecta mass and average particle velocity within a unit volume of the conical wedge would be a function of the level of decreasing shock energy at various distances from the point of impact within the forming crater.
- As a consequence of the above, in the lunar gravity and vacuum environment, the expanding, inverted conical wedge of regolith ejecta curves (“blooms”) into a radially irregular 360º, parabolic ballistic arch (Fig. 13.4b↓).
- Within the ballistic arch, small differences in particle velocities and trajectories and the evolution of solar wind volatiles through agitation, produce ballistically turbulent mixing of the original regolith strata, creating an at least partially integrated chemical composition (§5.0).
- Deposition of progressively lower velocity regolith ejecta moving outward within the ballistic wedge and parabolic arch would begin at the lowest energy tail of the wedge as it moves across the surrounding surface, away from the rim of the newly formed flat crater. The highest velocity ejecta, of course, would be the last to be deposited down range and would land farthest from the impact point.
 Fig. 13.4b. Schematic cross-section of a laterally expanding, inverted conical wedge that gravitationally transitions, in ultra-high vacuum, into a parabolic arch containing the largest proportion of ejected regolith.
-
- As the hemispherical shock wave of potential and kinetic energy, equal to “mgh and 1/2mv2,” respectively, delivered at the impact point moves downward into broken and then coherent bedrock that underlies the excavated regolith, a reflected shock excavates the main volume of the final crater and deposits that material around the crater rim to a distance of approximately one crater diameter. This relatively late arriving bedrock-related material falls on the earliest, lowest velocity portion of regolith ejecta.
These considerations suggest that the initial and progressively radial but nearly instantaneous release of kinetic energy is the primary factor in the ejection of regolith at the impact site, with remaining kinetic energy and the release of potential energy being the primary factors in subsequent excavation of the crater as a whole.
3.4 Source Craters for Regolith Ejecta in Deep Drill Core
The temporal study of recent lunar meteor impacts (Speyerer et al., 2016), based on comparative examination of LROC images, show that regolith is ejected long distances from the point of impact. In that context, there exist 10, 400-800 m diameter, definable impact craters (Fig. 13.5↓; Table 13.3a↓) in the Taurus-Littrow exploration area, plus 8 more that make up the Crater Cluster in the south central valley area and one 1451 m diameter crater east of the exploration area. At least some of the initial regolith ejecta from craters in this size range would have reached the deep drill core site and be possible sources for the regolith ejecta in the identified stratigraphic zones in the core.
 Fig. 13.5. Valley of Taurus Littrow exploration area showing the location of named craters and exploration stations (yellow). The 70009/1 deep drill core site next to the ALSEP deployment area is marked by the yellow X adjacent to “Core”, right of Camelot Crater. (NASA LROC)
The relative geomorphic ages of major potential source craters can be determined by visual comparisons of differences in crater morphology (Melosh, 1977) and in the size-frequencies and distribution patterns of boulders on crater rims and interior walls. The relative ages of crater formation given in Table 13.3a↓ reflect: (1) direct observations (indicated by red entries); (2) surface photography obtained during Apollo 17 EVAs (Chapters 10-12); and (3) diameter to depth ratios measured on QuickMap LROC images. As this report’s synthesis progressed, it became clear that slope mass wasting and nearby crater ejecta affecting some older craters required the use of some geological adjustment of estimated relative ages.
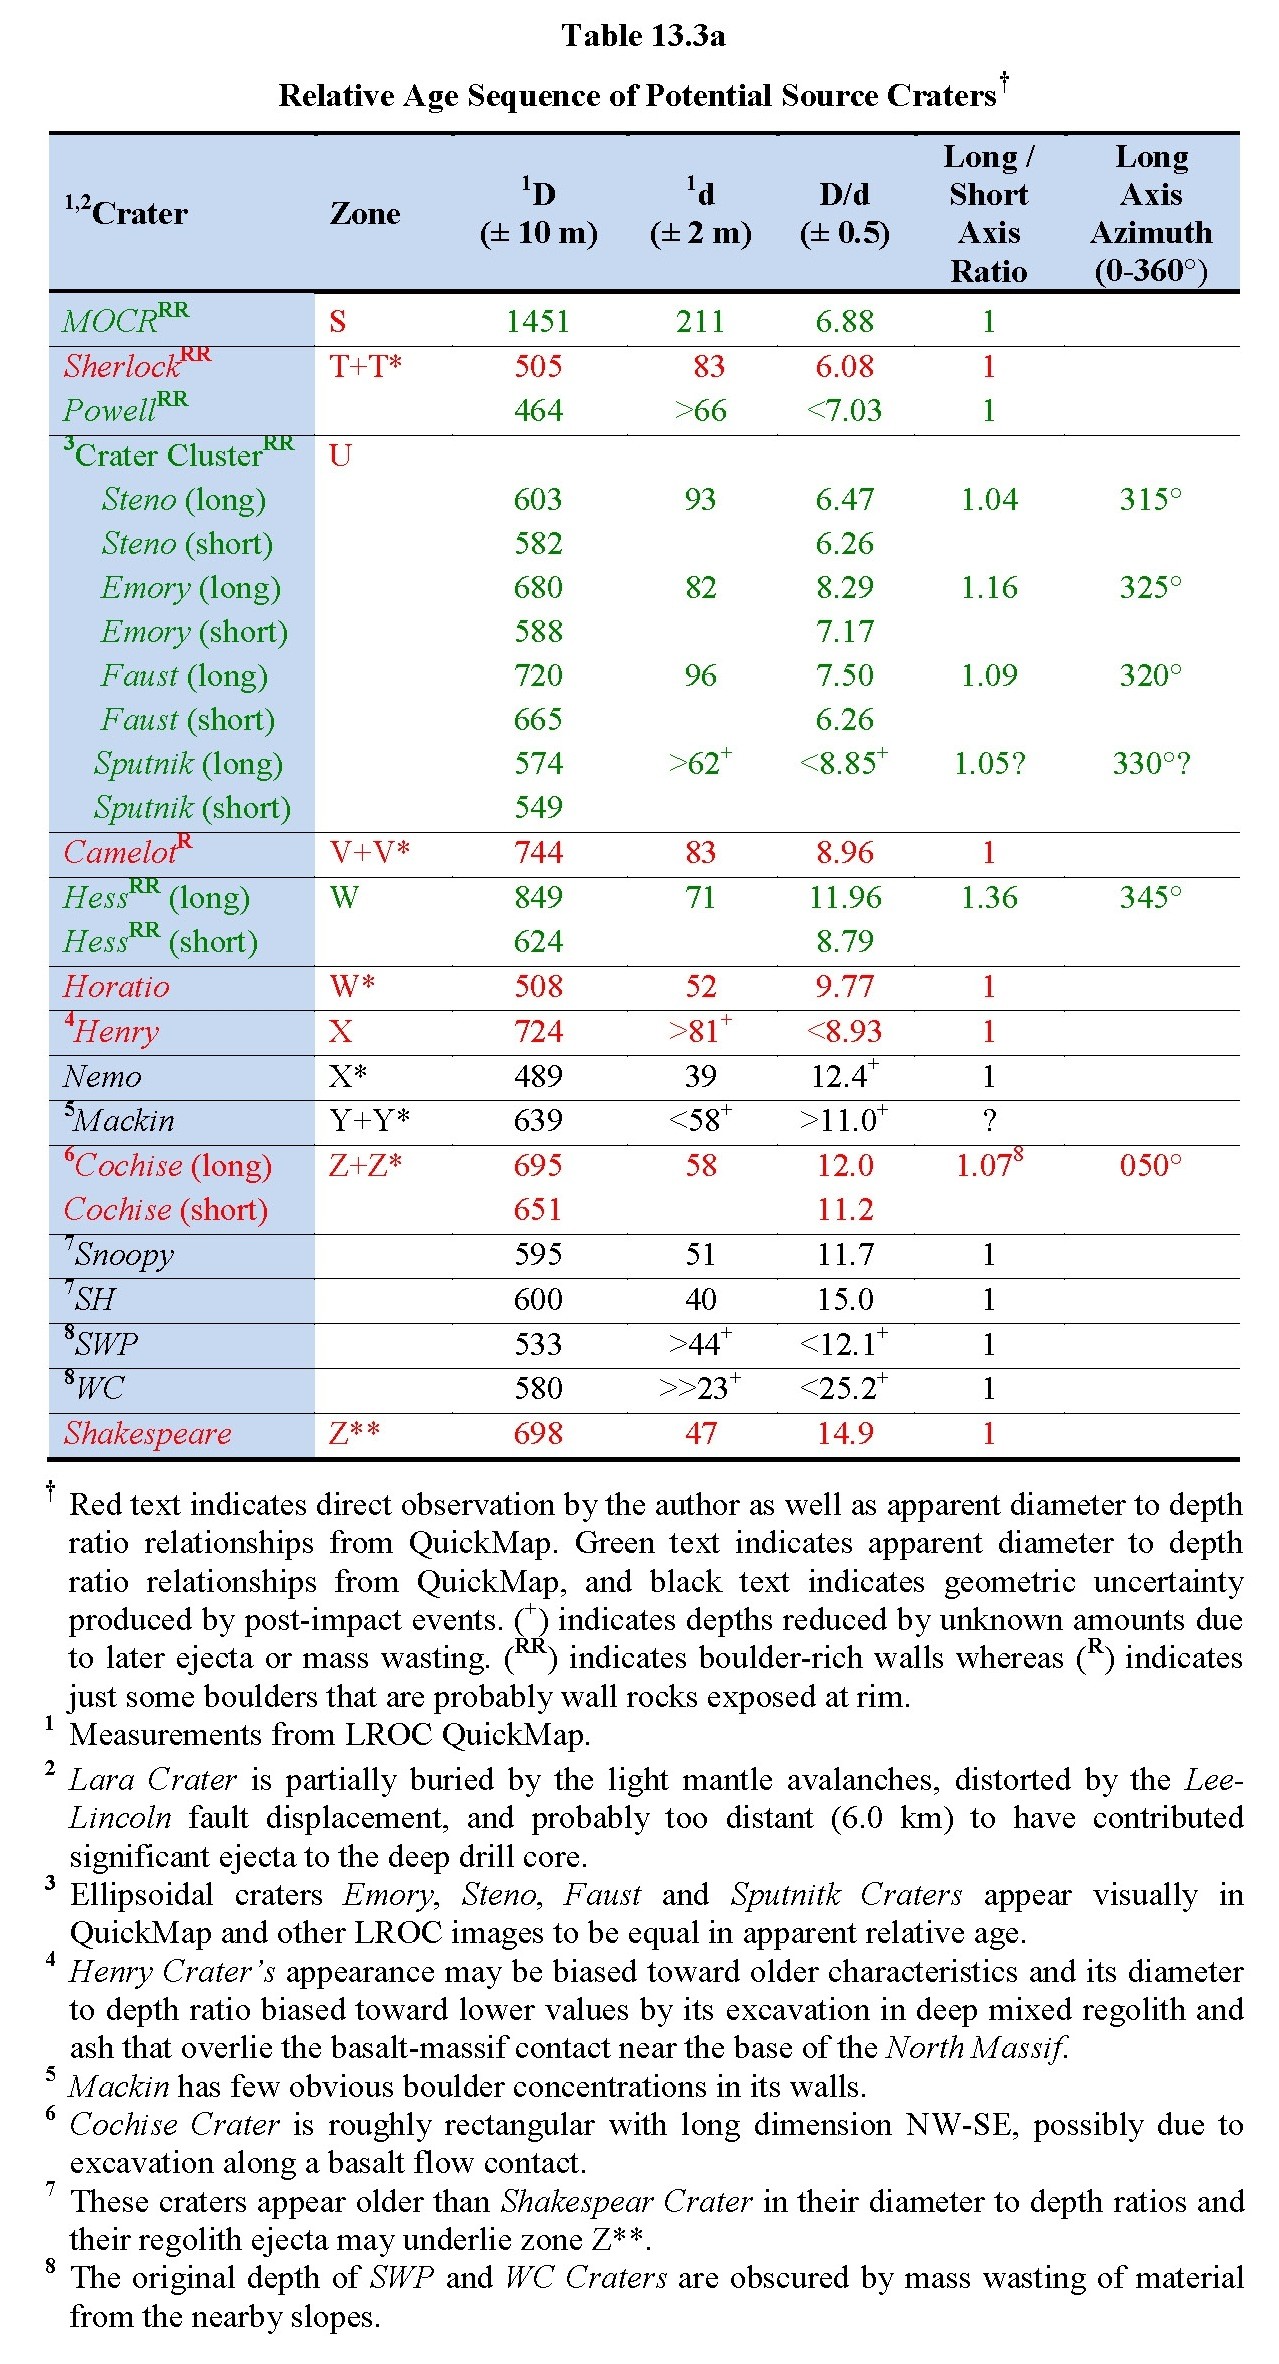
A close study of the large craters in Taurus-Littrow indicates significant variability. The 1451 m diameter MOCR Crater is an exception to other craters in the valley in its much larger size and youngest relative age, as well as being located 6.3 km east of the deep drill core site. Another exception to other craters are four of the major craters in the Crater Cluster (Steno, Emory, Sputnik and Faust as green entries in Table 13.3a) in that they are elliptical in shape rather than circular. Each long axis of these four craters is oriented at a bearing of ~320° ± 5°. This comparable orientation of spatially and apparently temporally related elliptical craters suggests a nearly simultaneous oblique impact of a closely aggregated group of objects. A fifth elliptical crater, Hess, also in the Crater Cluster, is distinct from the other four in its long to short axis ratio and long axis bearing. Finally, two relatively young, circular craters in the Crater Cluster, Sherlock and Powell, may have formed simultaneously.
Using this combination of visual characteristics and diameter to depth ratios, both of which are subject to significant judgment, Column 1 of Table 13.3a↑ contains source crater assignments to each zone as a function of increasing depth in the deep drill core. Although a comparison of these assignments with the petrographic data in Table 13.1a↑ and Table 13.1b↑ and compositional modeling in §5.0 support the sequence indicated, the following caveats are in order:
-
-
-
- “Crater Cluster” in Table 13.3a↑, and subsequently in Table 13.4↓, is the name given to a grouping of 8 large craters and many associated small craters and a generally lumpy surface (Wolfe et al., 1981; QuickMap). Close examination of the relative ages of the large craters (Table 13.3a), however, indicates that Steno, Emory. Sputnik and Faust were formed by simultaneous, oblique impacts. These four craters are distinct from other craters in the Cluster in being elliptical with a consistent bearing of 320° ± 5° of the long axes.
- Post-impact shape distortions of Mackin, Henry, Sputnik, Lara, WC and SWP Craters make diameter to depth ratio determinations subject to significant judgment as to placement of the best diameter line in QuickMap. On the other hand, compositional correlations with deep drill core zones (see §5.0, Table 13.8aa↓ to Table 13.8kk↓) reinforce the judgments listed in Table 13.3a).
- The abundance of basaltic lithic clasts throughout the core (Table 13.1a↑, Column 7) further emphasizes the general absence of massif melt-breccia fragments that resemble boulders at Station 2, 6 and 7 at the base of the massifs and as rocks in avalanche de;posits originating from the South Massif.
- Lara Crater (~675 m in diameter) is not included in Table 13.3a↑ since it is probably too far from the drill site (6.0 km) to contribute significant basaltic regolith ejecta. Lara Crater will be discussed separately, below.
-
-
Craters in the same size and relative age range as those on the valley floor are difficult to define on the North and South Massifs and in the Sculptured Hills; however, analysis of those elevated craters nearest the valley rim show that their distances from the deep drill core site would limit significant quantities of their ejecta from reaching the core site. Clear petrographic and compositional evidence of ejecta contributions from impacts directly on the massifs, is absent from the deep drill core, with the possible exception of zone V+V*, and will be discussed in §5.0.
Table 13.3b gives a summary evaluation of the apparent source craters for deep drill core zones by comparison of (1) evidence for relative ages in relation to the superposition of regolith zones in core (Table 13.1a); (2) petrographic evidence relative to general geology in source crater area (Table 13.1a↑ and Table 13.1b↑); and (3) thickness of zones relative to distance from rim to core site (Fig. 13.8↓, below).

Links for Table 13.1a↑, Table 13.1b↑, Fig. 13.8↓.
3.4.1 Lara Crater as Possible Source Crater
Although Lara Crater’s rim is farther from the deep drill core site than other similarly sized craters (~6.0 km), (Fig. 13.6a↓), it is of the right diameter (~675 ± 30 m) to be considered as a possible source of one of the core’s relatively thin regolith zones. On the other hand, in addition to its distance from the core site being much greater than the maximum deposition distance of 2.6 km (see Fig. 13.8↓), determination of Lara’s relative age is made more difficult by being partially covered by the light mantle avalanche deposits discussed in §17.0. Lara also has been distorted, tilted, and moved ~500 m eastward by movement on the Lee-Lincoln thrust fault (Schmitt et al., 2017). These factors make an estimate of its relative age and its diameter to depth ratio problematic and the faulting transport increases its original rim distance from the drill site to ~6.5 km.
Lara’s current diameter to depth ratio is ~11.4 ± 1 (845/74, using N-S diameter). On the other hand, boulders observed on Lara’s walls, and scattered elsewhere nearby, that project through the light mantles’ deposits (Chapter 11; Schmitt, 2024b), suggest a relative age comparable to or younger than Horatio (diameter to depth ratio = 9.77, Table 13.3a↑). For Lara to match that ratio for Horatio (Fig. 13.6b↓), the fill on its floor would need to be ~8 m thick to give an 82 m original depth. This is a reasonable thickness for such fill relative to comparable estimates for the combined thickness of two light mantle avalanche deposits that have over-ridden Lara (§17.2). In addition to an initial deposition of young and old light mantles, there was some backflow of young light mantle avalanche material into the crater (not included in the current depth estimates).
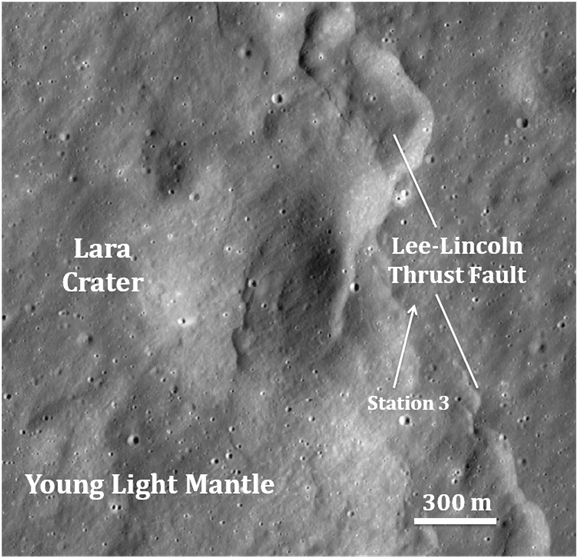 Fig. 13.6a. Lara Crater. (LROC Quick Map image).
 Fig. 13. 6b. Horatio and Camelot Craters (LROC Quick Map image).
3.4.2 Possible Source Craters on the Massifs
Craters >400 m diameter present on the tops of the North and South Massifs have diameter to depth ratios similar to those on the valley floor; however, such craters are too far away for their parabolic arches to reach the core site. The closest crest of the North Massif, for example, is 6.5 km from the drill site (QuickMap). Fig. 13.7↓ indicates that a 45º intersection of the leading portion of a crest crater’s parabolic arch with a point level with the crest would be ~2.6 km from the hypothetical crater rim. Although the massif crest is ~1.6 km above the valley floor, this extra ejecta flight time still would be insufficient to reach the drill site lying 6.5 km from the crest even if its flight maintained an optimum 45º trajectory as illustrated graphically in Fig. 13.7↓.
 Fig. 13.7. Graphical analysis of the possibility of a >400 m diameter crater at the crest of the North Massif (1.6 km higher than the valley floor) contributing regolith ejecta to the deep drill core site lying 6.5 km from the crater rim.
Fig. 13.7 shows the parabolic arch from the crest of the North Massif, with the optimum 45º launch-angle replicated as the impact angle. An 1.6 km altitude advantage would miss reaching the core site by ~2.3 km if a 45º impact angle for an 1.6 km altitude were maintained, which, of course, is greater than gravitational physics would allow.
Craters on the slopes of the North Massif that might have contributed significant regolith ejecta to the core have not been identified nor is there petrographic evidence that this occurred (Taylor et al., 1979) beyond the contributions of down-slope mass wasting (§5.0, zones U, V+V*, W and Y+Y*). It would appear that southwestward moving regolith ejecta from those craters visible on the top of North Massif largely impacted the southwestern facing slope of the Massif. This would have contributed to the mass wasting from that slope (such as noted for WC Crater), but not significantly to the regolith accumulating on the valley floor. (The base of the slope is >4.5 km horizontally from >400 m diameter massif craters nearest the crest (QuickMap measurements)).
The same arguments related to the North Massif would apply to craters on the even more distant South Massif. Petrographic and compositional characteristics of zones U (Steno Crater, etc.), W (Hess Crater) and Y (Makin Crater) (§5.0), however, indicate that their regolith ejecta include material from one or more South Massif slope avalanches (§17.0).
3.4.3 Reach of Each Source Crater’s Regolith Ejecta
The regolith ejecta sheath hypothesis postulates that a hypervelocity impact creates a conical ejecta wedge that evolves into a 360º parabolic arch, with ejecta deposition beginning at the tail of the wedge as it leaves the rim of the now-formed crater. This hypothesis implies that the distribution of mass in the wedge-arch combination at any given time and distance of deposition can be projected onto a roughly circular plane centered at the source crater. The thickness of regolith ejecta deposits forming at the moving tail of the wedge and arch at any given distance from the crater rim would be a function of the initial velocity and mass distribution of ejecta within the wedge-arch and the rate of decrease in its density as outward expansion continued. If, as hypothesized here, regolith ejecta from various 400-800 m diameter craters make up the regolith zones in the deep drill core (except that of zone S), the thickness of those zones should vary systematically with distance from their source crater rim.
From these relationships, it may be possible to empirically determine the approximate distance at which maximum deposition thickness of each source crater’s regolith wedge-arch occurs. Table 13.4a↓ gives the following data:
-
-
-
-
- Thicknesses of the regolith ejecta zones in the deep drill core,
- Potential source crater diameter,
- Distance from the core to the rim of potential source craters (rim chosen because that is where deposition begins).
- Estimated excavated regolith volume from the potential source crater from Table 13.17↓, §8.0.
-
-
-
The volume of ejected regolith was initially thought to be that of an approximate cylinder with a thickness of all the regolith present above bedrock, with an assumption that regolith depth averaged ~10 m. Considerations in §8.0, however, indicated that the actual depth of ejected regolith could be estimated in relation to cosmic ray exposure ages reported for the deep drill core zones as compared to the accumulated exposure age per meter in the deep drill core (37.5 Myr per m). The reader is referred to that Section for these estimates.
Table 13.4a footnotes:
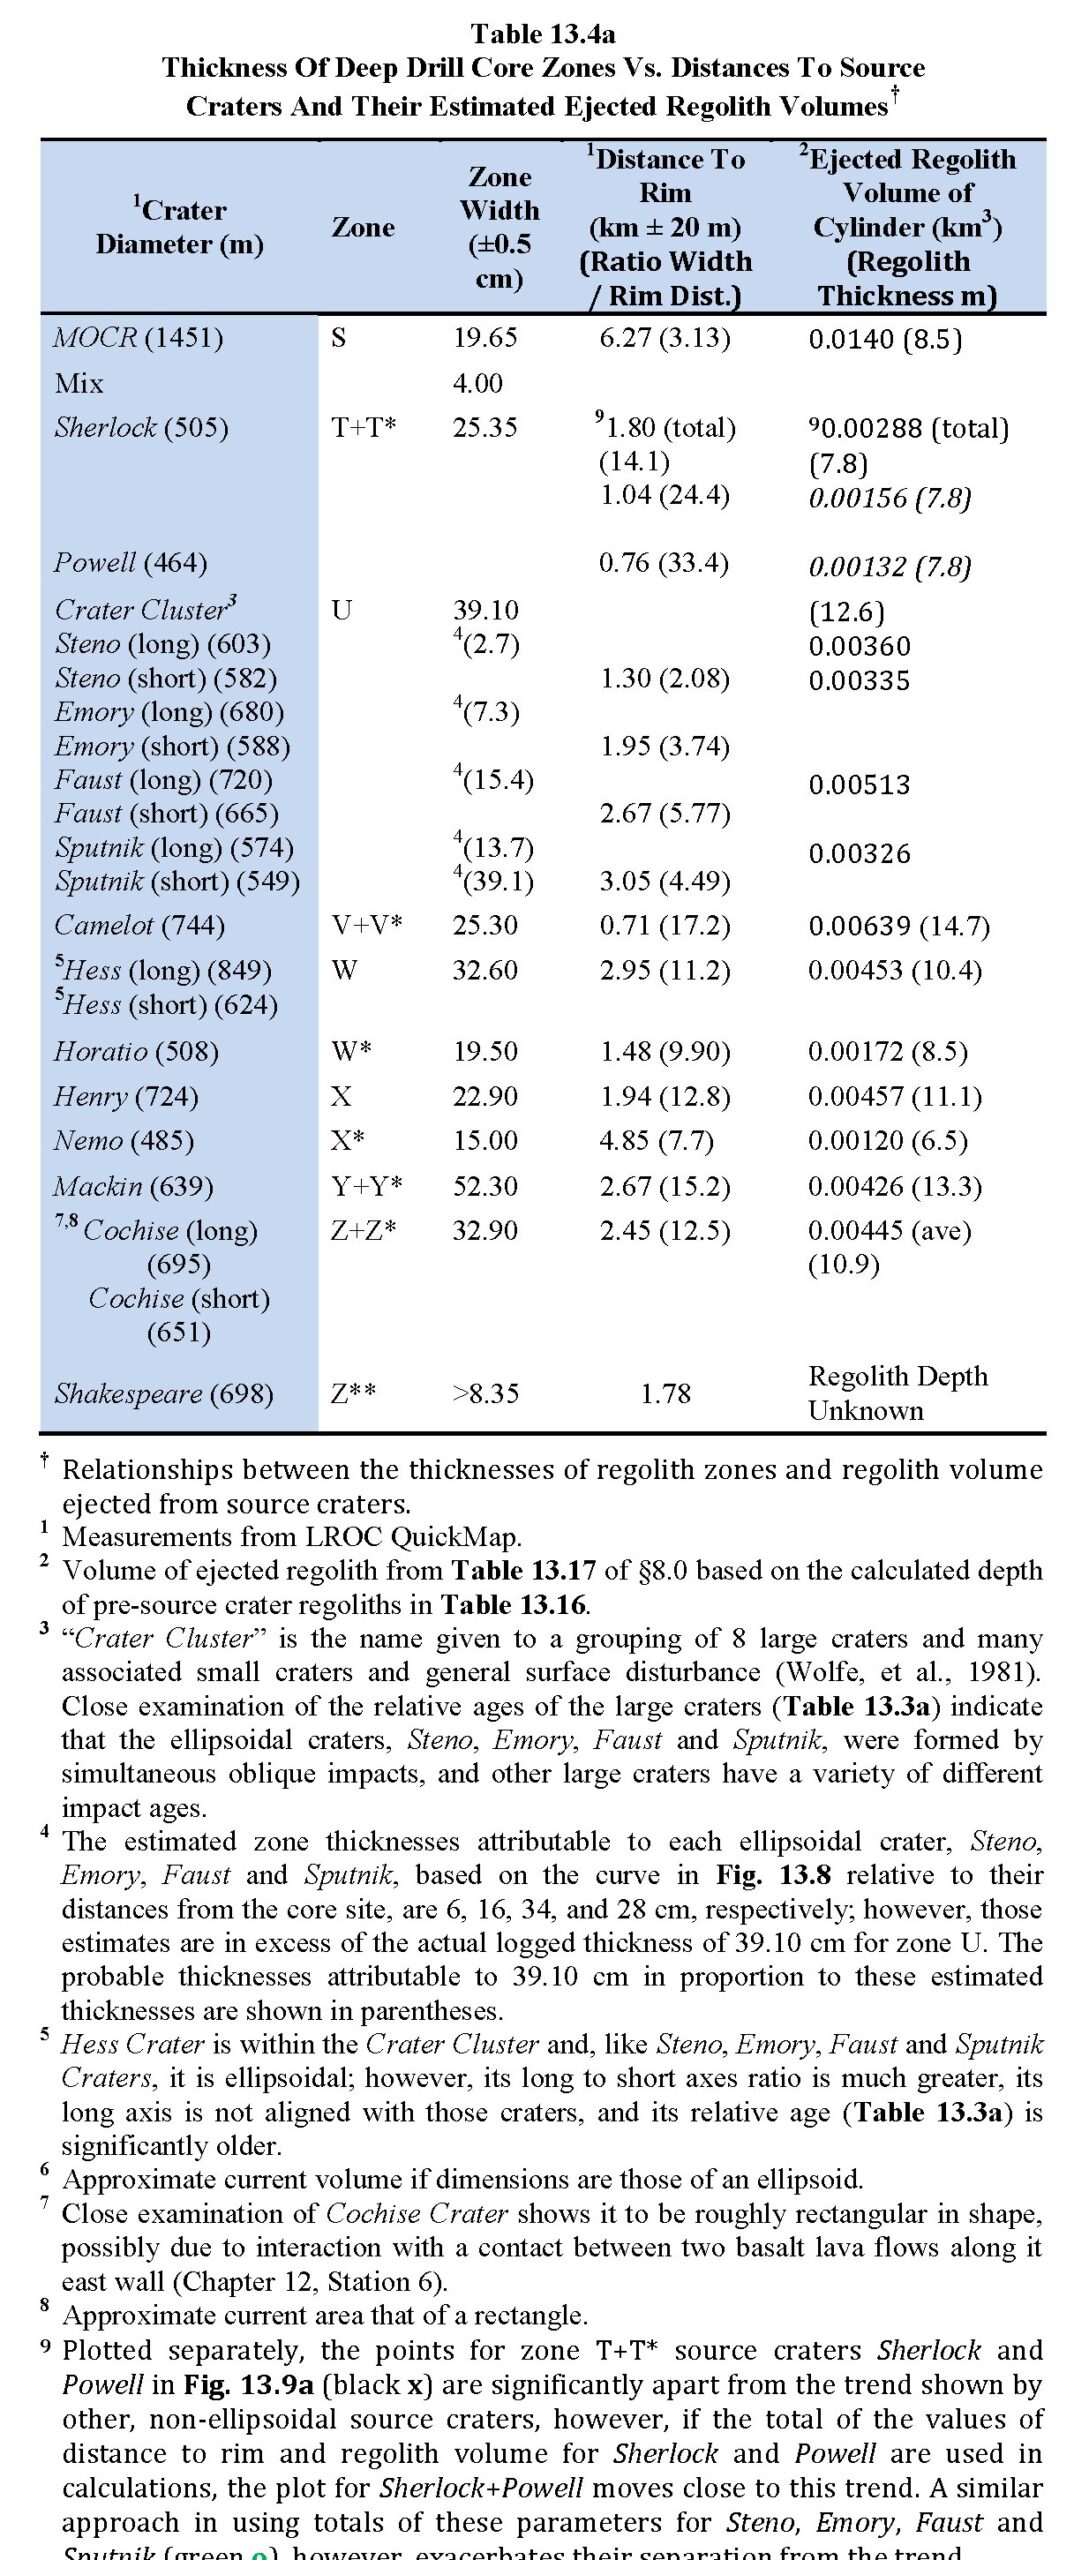
Links for Fig. 13.8↓, Fig. 13.9a↓, Table 13.3a↑, Table 13.16↓, Table 13.17↓, Wolfe et al. (1981).
For target materials of the same density, total excavated volume is representative of the total impact energy delivered to the crater site, both kinetic and potential. In attempting to relate deep drill core zone thickness to the release of impact energy, zone thickness (width) in Fig. 13.8↓ is plotted against distance from source crater rims to the core site. The plot suggests that maximum deposition occurs at a distance of about 2.6 km from the source crater rim. In Fig. 13.8↓, there also is a strong hint of two different non-linear distributions of thickness as a function of distance, approximated by dashed line segments. One trend (red) appears to relate to source craters closer than 2.6 km with large zone thicknesses. The other trend (black) relates to source craters closer than 2.6 km but with relatively small thicknesses. The statistical support for these differences is not great, however.
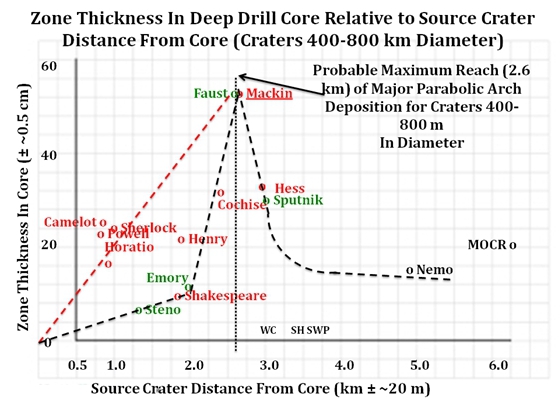 Fig. 13.8. Relationship between the thicknesses of zones of regolith ejecta deposited at the deep drill core site and the distance to the rim of probable source craters. The “distance from core” points for simultaneously formed elliptical craters in the Crater Cluster (Steno, Emory, Faust and Sputnik) are shown in green with their positions a projection from their crater distances to the black dashed curve (see text).
Relationships comparable to those in Fig. 13.8 would be expected if the 360° sheath of ejected regolith follows a parabolic trajectory from which deposition of increasingly energetic particles occurs continuously at the trailing end of the sheath but with the greatest concentration of particles being from the portion of the parabola with the greatest total energy.
As their ellipsoidal shapes, long axis orientations, and diameter/depth ratios indicate that craters Steno, Emory, Faust and Sputnik (green points in Fig. 13.8) formed simultaneously, their contributed thicknesses to the 39.10 cm of zone U would vary relative to their distances from the core site. Projecting source crater rim distance to the dashed trends in Fig. 13.8 indicates that the total thickness such a projection predicts for zone U would be, respectively, 6+16+34+28 cm = 84 cm. It is hard to see how the dashed curves could be moved downward enough to significantly lower these estimates, as the curves are based on objective measurements of zone thickness and crater rim distance. It is more likely that interaction of the simultaneously formed ejecta sheaths resulted in less regolith mass reaching the core site than otherwise would be predicted from the trends in Fig. 13.8. Alternatively, an asymmetric concentration of ejected regolith from an oblique impact may have resulted in lesser deposition at the core site. Weighing the excessive predictive thicknesses for Steno, Emory, Faust and Sputnik, however, against an actual zone U thickness of 39.10 cm gives approximately 2.7, 7.3, 15.4 and 13.7 cm, respectively, as the four predicted contributions to zone U’s logged thickness.
Fig. 13.9a↓ is a graphical plot of zone width normalized to distance from its source crater rim (km) vs. estimated ejected regolith volume (Table 13.4a↑). Some observations related to Fig. 13.9a are as follows:
-
-
- The points plotted for most craters appear to define a trend (red) indicating that zone thickness has a relationship to source regolith ejected volume.
- The intersection of the red trend at the zone thickness-rim distance ratio axis may indicate that as ejected volume approaches zero that ratio approaches a value of ~6. This would imply that 0.1 m away from the rim of a small volume crater the ejecta thickness would be ~0.6 cm, giving some perspective on the nature of the micro-meteor near-surface regolith gardening process.
- The improved correlation of zone T+T*’s source craters, Sherlock and Powell, with the red trend through the use of the total rim distance and total regolith volume lends support for the hypothesis that Sherlock and Powell were simultaneous impacts.
- The close grouping of green points representing the four source craters for zone U would be expected for simultaneous impacts clustered together in one area with corresponding interference between ejecta sheaths.
- The clustering of the green points representing the four source craters for zone U well below the red trend line suggests that the thickness of zone U of 39.10 cm is not the maximum hypothetical zone thickness that could have resulted from those four impacts, and further suggests ejecta sheath interferences or, alternatively, asymmetric deposition with thicker regolith being deposited further downrange.
-
 Fig. 13.9a. Plot of deep drill core zone thickness normalized for source crater rim distance against ejected regolith volume based on source regolith thickness calculated in §8.0.
Fig. 13.9b↓ is a graphical plot of zone width / km vs. estimated initial crater volume (Table 13.4b), a rough surrogate for total energy of the impactor. The ejected total volume calculation assumes that the initial excavated volume was that of a half sphere with its depth equal to the crater radius. In the case of the ellipsoid craters, the initial depth was assumed to be the same as half the short axis. These first approximations of radius and depth are greater to some limited degree than the current radius and depth, of course, as crater diameters increase and crater depths decrease with age.
Table 13.4b footnotes:

Links for Fig. 13.8↑, Table 13.3a↑, Wolfe et al. (1981).
 Fig. 13.9b. Relationship between deep drill core zone thickness (width / km) and the estimated initial source crater volume (Table 13.4b↑), assuming that the radius of the half sphere, or short axis in the case of ellipsoidal craters, approximates the source crater’s initial depth.
Fig. 13.9b indicates the following:
-
-
- As in the case of the plot for regolith volume (Fig. 13.4a↑), the points plotted for craters (red o), other than the ellipsoidal source craters for zone U (green o), show that most craters appear to define a trend (red) that indicates zone thickness has a close relationship to ejected volume.
- Also, as in the case of the plot for regolith volume (Fig. 13.4a↑), the intersection of the red trend at the zone thickness-rim distance ratio axis may indicate that as ejected volume approaches zero that ratio approaches a value of ~6.
- The improved correlation of zone T+T*’s source craters, Sherlock and Powell, with the red trend through the use of the total rim distance and total volume lends (Table 13.4b↑) support for the hypothesis that Sherlock and Powell were simultaneous impacts.
- As in Fig. 13.9a↑, the close grouping of green points representing the 4 four source craters for zone U would be expected for simultaneous impacts clustered together in one area with corresponding interference between ejecta sheaths.
- The clustering of the green points representing the four source craters for zone U well below the red trend line, as in Fig. 13.9a↑, suggests that the thickness of zone U of 39.10 cm is not the maximum hypothetical zone thickness that could have resulted from those four impacts, and further suggests ejecta sheath interferences or, alternatively, asymmetric deposition with thicker regolith being deposited further downrange.
- The relatively close association of source crater points along a similar trend line in both Fig. 13.9a↑ and Fig. 13.9b↑ gives strong support for the correlations of source craters with deep drill core regolith ejecta zones (Table 13.3a↑).
-
In Fig. 13.8↑ and Fig. 13.9a↑ and Fig. 13.9b↑, points for MOCR Crater are, of course, obvious outliers because of that much larger crater’s greater formational energy than those in the 400-800 m range.
There are many possibilities for error in the correlation of deep drill zones with specific source craters; however, support for the assignments comes from the close correlations shown in Fig. 13.9a↑ and Fig. 13.9b↑, helping to confirm the support found in petrographic and compositional details, discussed in §5.0. The plots in these figures and in Fig. 13.8↑ indicate that the primary controls on zone thickness are distance from the source crater, combined with the source crater’s total formational energy and the thickness of regolith at the pre-source crater impact location. The distinct plots for regolith volume (Fig. 13.9a↑) versus crater volume (Fig. 13.9b↑) further support the separation of kinetic energy and potential energy in the physics of impact excavation. This separation also sets limits on the extrapolation of data from explosion craters to impact craters, constricting explosions to be equivalent to the release of potential energy but not the release of initial kinetic energy.
3.4.4 Summary
In summary, if the parabolic arch hypothesis for a 360° ejecta sheath from any given source crater is correct, Fig. 13.8↑ suggests that the probable limit of significant deposition from such arches would be about 2.6 km from the rim of that crater. Further, there is a strong implication in the data as plotted in Fig. 13.8↑ that, for craters in the 400-800 m diameter range and up to about 2.6 km from the deep drill core site, the thicknesses of the regolith ejecta zones are primarily functions of the kinetic energy of the source crater impactor as well as the portion of the parabolic arch that finally hits the surface. In that scenario, the thick regolith ejecta zones for Cochise (zone Z+Z*), Hess (zone W), Mackin (zone Y+Y*), and possibly Faust may represent deposition of regolith ejecta contained in densely concentrated portions of their parabolic arches, that is, the velocity and volume of regolith ejected is greatest just after initial impact and, possibly counter-intuitively, less dependent on the total kinetic+potential energy finally released.
Other factors besides kinetic energy and distance potentially come into play with any given impact. These factors include actual thickness and density of source regolith and angle of impact; however, these may have been a positive or negative factor at Taurus-Littrow only for the four related elliptical craters in the Crater Cluster as well as Mackin and Hess that impacted regolith thickened by one or more South Massif avalanches.
Another way of viewing the plots in Fig. 13.8↑ is that regolith ejecta mass is largely concentrated in the leading volume of the conical wedge and the parabolic arch as they form, and this mass is deposited near the end of the arch’s ballistic trajectory. It appears that 2.6 km constitutes the lunar ballistic limit for the largest volumes of regolith ejected from craters in the 400-800 m diameter size range. The steep drop in delivered regolith thickness documented for Hess Crater (zone W) in Fig. 13.8↑ supports this conclusion, although a small volume of high velocity ejecta from near the exact point of impact almost certainly goes much greater distances and additional small volumes of lower velocity ejecta are spread between the source crater rim and ~2.6 km from that rim. Clearly, more data from deep drill cores at other locations, selected to maximize the number of potential source craters, are needed before this apparent ballistic limit can be more precisely defined as a function of source crater size and its distance to a deposition site. The ballistic limit for large terrestrial impacts might be determined by consideration of tektite strewn fields, and then used to identify the location of candidate source craters.
4.0 Process Sequence That Forms Inter-Crater Regolith
4.1 Introduction
Fig. 13.1c↑ and the log of detailed maturity data from the Apollo 17 deep drill core in half-cm steps from which Fig. 13.1c↑ was derived (Morris et al., 1979; pers. comm.) indicate that major impact events that result in regolith ejecta deposition broadly surrounding the resulting crater are the primary initial contributors to the three-dimensional structure and composition of inter-crater regolith at Taurus-Littrow and other lunar locations. Once deposited as a regolith ejecta zone, impact gardening and external and internal radiation act as agents of continuous maturation until the zone is buried by new regolith ejecta.
The maturity parameter Is/FeO, developed by Morris (1976), is based on the ferromagnetic response of nano-phase iron particles (np°Fe) produced in increasing amounts by the alpha+beta and proton reduction of structural Fe++ to Fe°. Dissolved Fe++ in volcanic glass and glass-rich agglutinates is protected from both alpha+beta and proton radiation as a consequence of the dissemination of iron, uranium and thorium ions and the shielding of iron from radiation by surrounding glass.
Throughout regolith that is continuously gardened by impacts, alpha+beta particle radiation of Fe++-bearing minerals produces a steadily increasing contribution to the value for Is/FeO by reduction of Fe++ ions within 20-30 µ of disseminated uranium and thorium radiation sources (§6.3.2). Once gardening ceases after burial, however, this form of maturation rapidly dies off as local Fe++ ions near alpha+beta sources are consumed. (Although these issues previously were addressed by Schmitt (2022a), the calculations in that abstract were in error and have been updated below.) At the surface, solar proton radiation also increases Is/FeO values on exposed crystalline particles (§6.3.3). This exposed surface material is gradually incorporated into deeper units through the impact gardening process.
Close to points of macro- and micro-meteor impacts, nano-phase iron particles have their ferromagnetic properties disturbed by shock and/or heat so that local Is/FeO is partially reset to lower values (§4.2). These partial resets do not appear to extend beyond the reach of actual regolith excavation and crater wall deformation, based on evidence of such resets in (1) ancient light gray regolith at the rim of Shorty Crater (74240, 74260) (§11.0); (2) regolith breccia sample 79115 and regolith breccias from other Apollo missions §17.0; and (3) a sample (73131) from the wall of a small fresh impact crater in mature light mantle regolith discussed further below in (§4.2). The extent of “Is” reset by large source craters will be further examined later in §6.4.2.
The general sequence of inter-crater regolith formation, such as that surrounding the Apollo 17 deep drill core, has been illuminated in this synthesis by detailed logging of the Is/FeO profile in the deep drill core (every half-centimeter) and by logical consideration of the constant micro- and small macro-meteor rain of gardening impacts. That sequence of inter-crater regolith development at the deep drill core site was as follows:
-
-
-
-
- Regolith ejecta from 10 large, 400-800 m diameter source craters, and one ~1400 m diameter source crater (MOCR), are deposited as layers up to 50 cm thick that sequentially covered hundreds of square meters around the core site. A given layer is contiguous with a circumferential blanket of comparable regolith ejecta surrounding its source crater that reaches maximum thickness at a distance of ~2.6 km from the rim of the crater (Fig. 13.8↑). Bedrock-related ejecta is confined to an irregular blanket comprised largely of brecciated bedrock that extends an average of about one crater diameter from the rim of the source crater.
- It appears that the initial kinetic energy of the impactor creates the far-reaching sheath of regolith ejecta, whereas, its potential energy is largely responsible for excavation of bedrock and overlying rubble and its deposition within about one crater diameter from the crater rim.
- Prior to regolith ejecta deposition, small differences in the velocity and trajectories of individual particles, along with volatiles released due to agitation, create ballistic and volatile turbulence within the parabolic regolith ejecta sheath that emanates from a source crater.
- Turbulence partially integrates Is/FeO values, cosmic ray exposure ages, and compositional parameters of the finest fractions (>70 wt-%; Graf, 1993) of pre-existing regolith zones.
- Micro- and small macro-meteor impacts with an exponential size-frequency distribution increasing toward smaller sizes (Shoemaker et al. (1967); Graf, 1993) begin to modify and garden newly deposited regolith ejecta.
- Regolith at and near the point of small impacts is subjected to partial resets of their Is/FeO values due to local intense shock or heat or both.
- Nearby small impacts capable of depositing regolith at the core site but still are the most distant from the site contribute the most significant Is/FeO reset values, as that most distal regolith has received the greatest shock and energy input from impact. The amount of detectable individual resets varies from ~2% to ~20% for mature regolith, up to ~30% for immature regolith (§4.2) , and to over 90% for regolith subject to large impacts (§6.4.2, §11.2).
- Complementarily, ejected regolith that has the Is/FeO value of the local regolith may or may not be apparent in the raw data.
- As small impacts garden the continually reforming regolith surface, radiation from solar protons on exposed surfaces and U+Th alpha+beta radiation throughout the bulk regolith continue to reduce structural Fe++ to nano-phase iron (np°Fe), thus increasing post-reset Is/FeO. In varying time spans, this maturation counters, partially counters, or exceeds the effect of impact-related resets, but continues to give an increasing measure of the increase in Is/FeO (∆Is/FeO) with surface exposure to solar protons and impact gardening.
- The work of Burgess and Stroud (2018) on solar proton radiation effects on surfaces of exposed ilmenite, chromite, and glass particles confirm solar proton maturation effects; however, that research did not include consideration of the formation of nano-phase iron related to alpha+beta particle radiation reported by Bower et al. (2016) in terrestrial biotite.
- The rising Is/FeO values produced by nano-phase iron production appears in Morris’s raw data (pers. comm.) from the deep drill core as gradual increases in Is/FeO values over 1-3 cm that peak at a point where a rapid decrease over a ½-1 cm in those values occurs due to a reset. This process forms the repeated Is/FeO saw tooth peaks, cliffs and valleys that are so apparent in Fig. 13.1c↑, particularly in deep drill core zones S, V and W.
- Surprisingly, Is/FeO decreases and increases in extended saw tooth patterns are roughly equal in most regolith ejecta zones. Exceptions to this pattern provide information on temporal variations in the impact environment affecting the regolith (see discussion of zone U in §5.0).
- Each original regolith ejecta zone is ultimately gardened by craters with diameters up to ~5 times (Pike, 1974) the thickness of a given zone, until another source crater impact delivers a new regolith ejecta zone of a distinct initial Is/FeO (Is/FeOm) that buries the earlier zone.
- Given enough time, an impact that penetrates the entire regolith ejecta zone may reach into the top of the immediately underlying regolith ejecta zone with that zone’s regolith being integrated into the zone that buried it. An anomalous pattern at a contact with an earlier regolith ejecta zone would indicate that gardening had crossed into that underlying zone, but no such anomaly has been noted in the deep drill core core raw data.
- Lack of a pronounced saw tooth pattern in a relatively thick zone, e.g, zone U (~40 cm thick), would show that the general process outlined above was interrupted by another temporary process. In the case of zone U, a period of small macro- and micro-meteor impacts of higher energy than normal may have resulted in the steady, reset-driven decline in Is/FeO values for that zone (see Fig. 13.1c↑).
- Regolith ejecta from 10 large, 400-800 m diameter source craters, and one ~1400 m diameter source crater (MOCR), are deposited as layers up to 50 cm thick that sequentially covered hundreds of square meters around the core site. A given layer is contiguous with a circumferential blanket of comparable regolith ejecta surrounding its source crater that reaches maximum thickness at a distance of ~2.6 km from the rim of the crater (Fig. 13.8↑). Bedrock-related ejecta is confined to an irregular blanket comprised largely of brecciated bedrock that extends an average of about one crater diameter from the rim of the source crater.
-
-
-
4.2 Impact Shock Partial Resets of Is/FeO Values
In the course of this synthesis, as noted above, several lines of evidence came to light indicating that very locally, impact shock, and potentially heat, partially resets the ferromagnetic basis for the determination of the “Is” component of Is/FeO values developed by Morris (1976). The evidence for this phenomenon is as follows:
-
-
- The Is/FeO values of 5 and 5.1 for light gray regolith samples 74241 and 74261, respectively, obtained at the rim of Shorty Crater, are inconsistent (§11.2) with the cosmic ray exposure ages reported for 74241 that range from 150 to 320 Myr (Table 13.5↓) with large error limit.
- A sample of the regolith, 73231, taken from the wall of a small, very fresh impact crater on the young light mantle has an Is/FeO = 16 that is inconsistent with Is/FeOs = 88 for skim sample 74121 as well as with Is/FeOm = 48 for bottom trench sample 73141 from ~15 cm depth (§17.4).
- Deep drill core zone deposition Is/FeOs (Is/FeOm) are up to 97% lower than they were in the pre-source crater regolith, as indicated by cosmic ray exposure ages versus Is/FeO-based ages on their respective regolith ejecta zones (§8.0, Table 13.16↓).
- The Is/FeOs of impact-lithified regolith breccia samples from Apollo 15 and 16 (Table 13.6↓) are consistently much lower than bulk regolith samples from those missions (McKay et al., 1986, 1989).
- The probable role that impact heating, in addition to shock, plays in resetting Is/FeO to low and very low values relative to bulk regolith is indicated by Apollo regolith breccia samples (Morris in McKay et al., 1986, 1989; Morris, 1976) that have petrographic and/or image evidence (Meyer, 2012) of adhering impact glass or a glass matrix (Table 13.6).
-
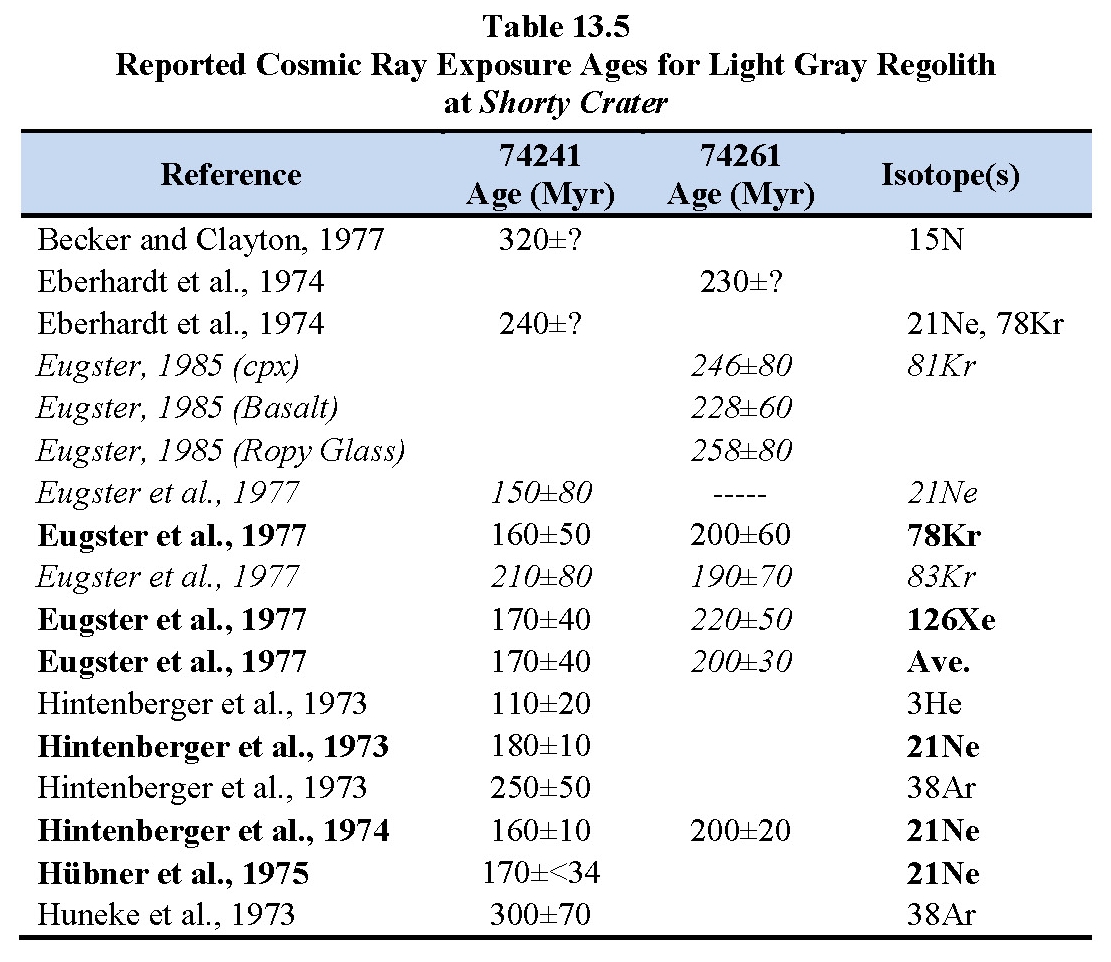

Links for McKay et al. (1986, 1989), Meyer (2012).
The effects of partial resetting of Is/FeO values by impacts are superposed at the half-cm scale on the overall maturity of regolith ejecta zones of the deep drill core shown in Fig. 13.1c↑ and Fig. 13.1d↑. These effects, and the subsequent increases in Is/FeO, create the saw tooth patterns in Fig. 13.1c↑. These patterns are reflected in the raw data (Morris, pers. comm.) from which Fig. 13.1c↑ was created. The general pattern, identified in half-cm logging, is one of a sharp decrease of about 2-10 Is/FeO points followed by multiple increases in Is/FeO values in the overlying 1-3 cm. The increase in Is/FeO may or may not exceed the amount of the reset. This pattern is interpreted here as the result of gardening ejecta from nearby small impacts that contain resets being spread over the core’s location. This exposed reset regolith then continues normal proton and alpha+beta particle maturation until the arrival of the next spray of reset ejecta.
4.3 Summary of Detailed Is/FeO Log of Apollo 17 Deep Drill Core
Morris et al. (1979) recorded the maturity index, Is/FeO, for every half-cm of the Apollo 17 Deep Drill Core, summarizing their findings with the graph shown in Fig. 13.1c↑. An example of the author’s detailed log of the raw data (Morris, pers. comm.) underpinning Fig. 13.1c↑‘s graphical representation is shown in Fig. 13.1d↑. The half-cm log reveals a systematic sequence of sharp resets of Is/FeO values in less than the measurement thickness of half a centimeter, followed by more gradual increases in those values over ~0.5-3 cm along the core. A summary of the Is/FeO log is given in Table 13.7↓. The major findings illustrated by Table 13.7 and other data can be summarized as follows:
- Due to frequent resets and recoveries, the integrated original Is/FeOm of a regolith ejecta zone after deposition (Column 3) can only be approximated, probably ± 5 Is/FeO points, by consideration of Is/FeO values near the base of a given zone.
- Is/FeO resets per centimeter (Column 6) is roughly constant at 0.510 ± ~0.15 except for zones T+T* and V+V* (italics in Table 13.7).
- Zone T+T* probably is anomalous due to their very low initial Is/FeOm values of ~10, thus limiting the amount of individual resets that can be resolved by the Is/FeO technique at a half-cm interval. This issue is addressed further below.
- Zone V+V* probably is anomalous due to its small data set (4 resets over 11.8 cm).
- The apparent 8 point Is/FeO reset at the top of zone S does not appear to be the introduction of a new regolith ejecta deposit. This portion of the core also has been disturbed by compaction. Unlike the sharpness of other zone boundaries, the upper 4 Is/FeO data points are spread across 2.65 cm.
-
- The bulk chemistry for the control sample 70181 for the deep drill core shows no significant differences from the bulk chemistry of core sample 70009 at 1, 9 or 20 cm depths (§5.2, Table 13.8a↓, below).
- The difference in U+Th content of the control sample 70181 (1.380 ppm; Silver, 1974) for the deep drill core and 70009 at 1.18 ppm at ~1 cm depth is probably due to an error in the uranium measurement, as the thorium amounts of 0.95 ppm at 1 cm and 0.94 ppm at 20 cm (Meyer, 2012) are close to the 1.049 ppm Th measured for 70181 by Silver.
-
- Total decrease in Is/FeO resets for the core (1227) exceeds total maturation increase (1138) by only 89 points (7.3%), suggesting a rough balance between the effect of resets and that of nano-phase iron production after zone deposition. Why, other than coincidence, such a rough balance would exist over about one billion years of core accumulation (§6.0) is not obvious, particularly as the total ∆Is/FeO varies greatly between zones.
- Other data discussed below indicate that overall regolith maturity in the long term is more a function of alpha+beta particle flux than solar proton flux (§6.0). Although mixed downward by impact gardening over time, the effect of proton maturation initially only affects particles exposed at a post-reset surface rather than continuously throughout the entire zone.
- Zone U is the major intra-zone exception to the reset-∆Is/FeO balance, as it shows a continuous decline in Is/FeO in Fig. 13.1c↑ as well as in the half-cm log in spite of a relatively normal value for resets per centimeter of 0.455. These data suggest that reset impacts affecting zone U were of abnormally high kinetic energy, possibly due to the periodic passage of the Moon through the tail of a long period comet. Long period comet terrestrial impact velocities are as high as 67 km/sec (Hughes and Williams, 2000) while asteroids impact velocities are around 17 km/sec (Koeberl and Sharpton, 2024). Lunar impact velocities would be less, of course, however the relative difference would remain significant.
Table 13.7 footnotes:
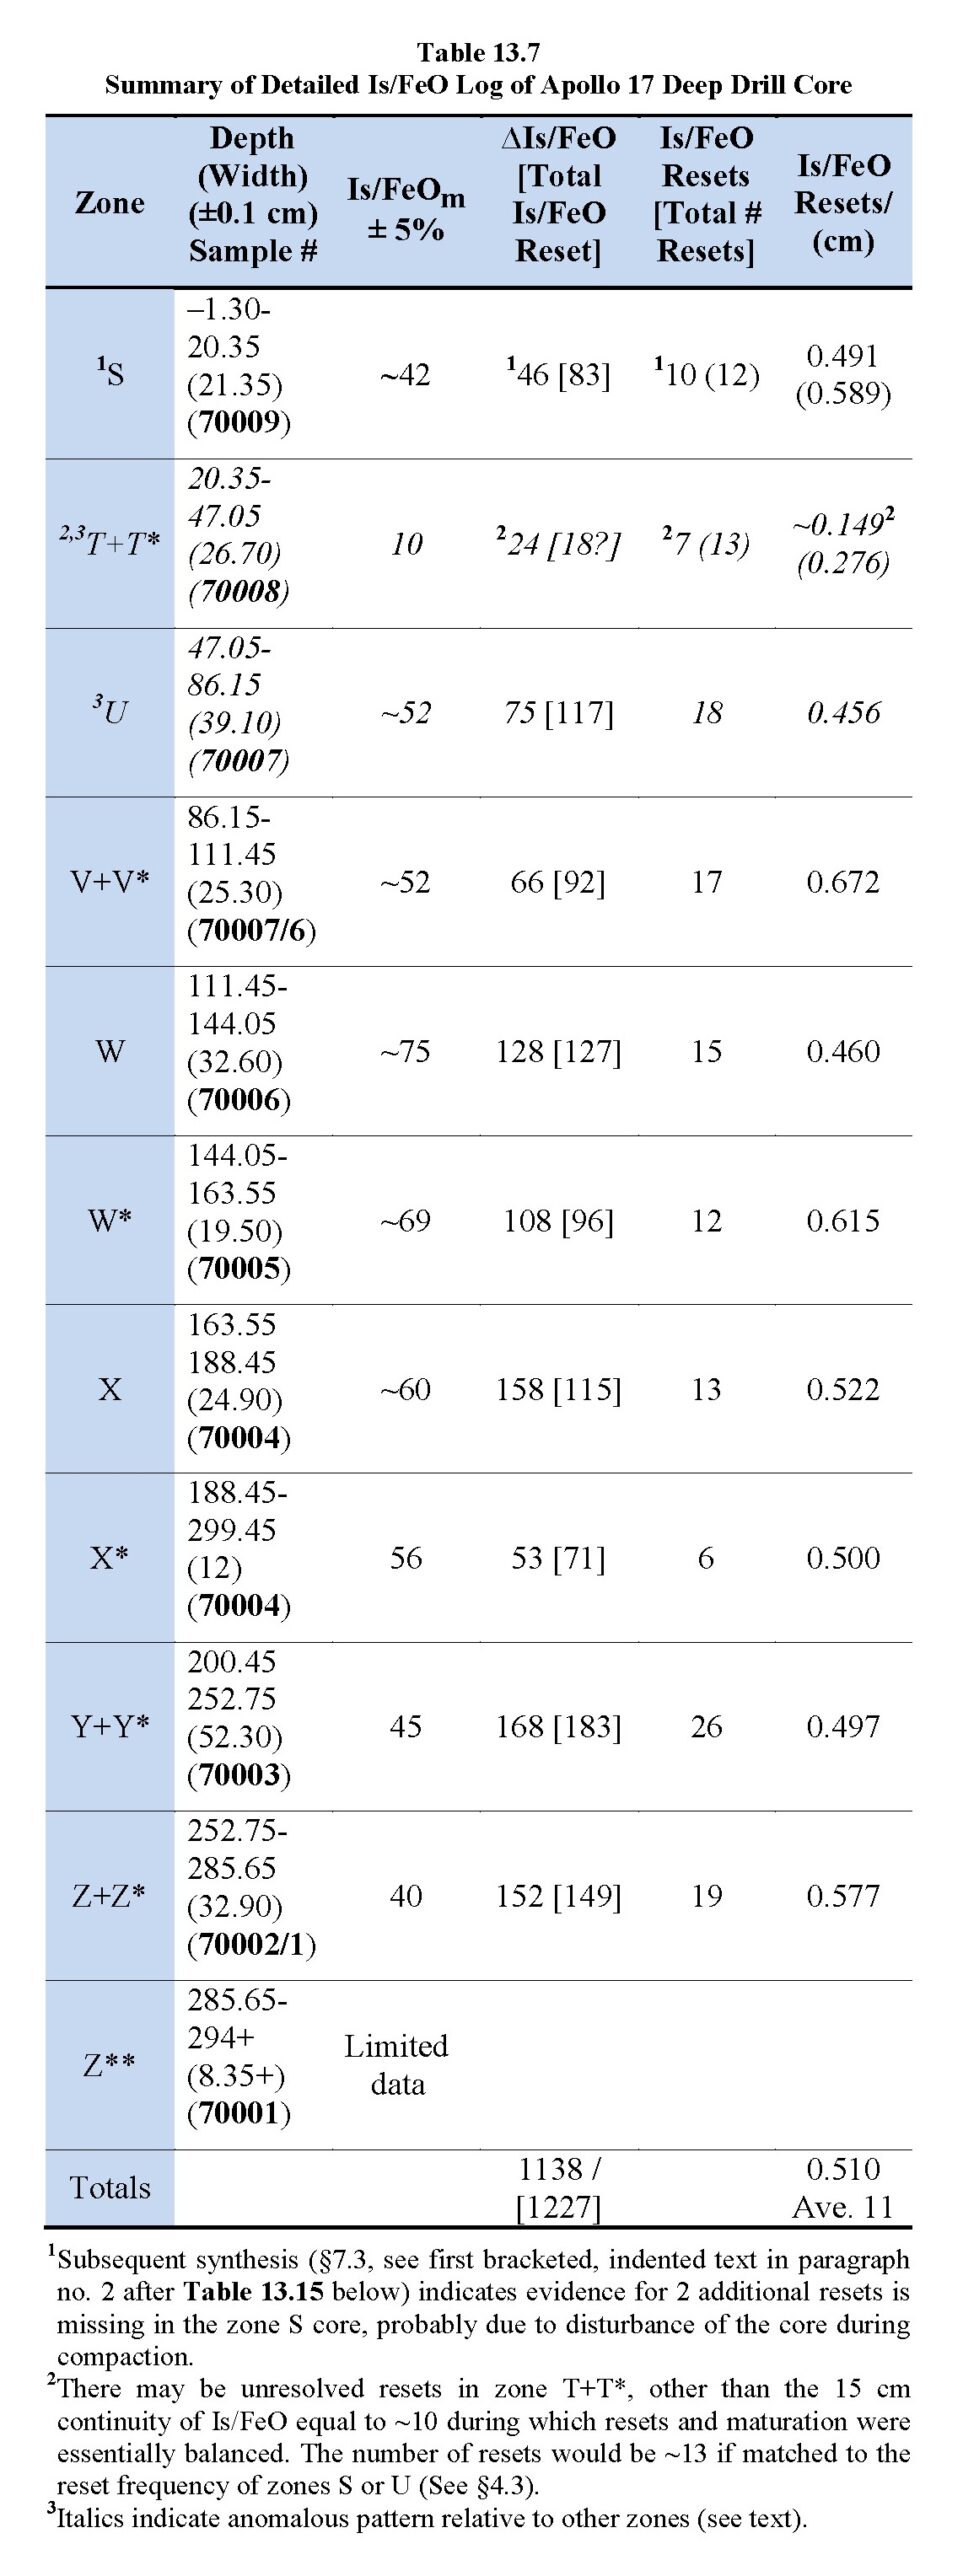
Link for §7.3, Table 13.15↓, and §4.3.
Within this general background, there are rare anomalous patterns, as follows:
-
-
-
- Steady decrease in Is/FeO over >2 measurement intervals (Maybe there were multiple ejecta depositions with relatively little time in between or there was core penetration of a buried crater wall or ejecta blanket).
- Steady increase in ∆Is/FeO over >2 measurement intervals (Maybe a period with no ejecta deposition).
- Oscillation between (1) and (2), i.e., from steady decrease in Is/FeO over >2 measurement intervals to steady increase in ∆Is/FeO over >2 measurement intervals (Maybe that impact activity was inside the resolution of the data).
- Sharp decrease in Is/FeO that is greater than normal pattern (Maybe that ejecta in core is from point of impact where reset of Is/FeO is greatest).
- Sharp increase in ∆Is/FeO that is greater than normal pattern (Maybe that ejecta is mature regolith where reset of Is/FeO is least and is from a significant distance away from point of impact).
- No decrease in Is/FeO over >2 measurement intervals (Maybe there were no nearby impacts).
- No increase in ∆Is/FeO or decrease in Is/FeO over >2 measurement intervals (Maybe that deposited regolith has same Is/FeO as preceding redeposit).
- A few apparent impact resets extended upward for up to six, half cm intervals These extended resets may represent where the core penetrated the sloping wall of a small gardening impact crater. In these few instances, the core interval is overturned and records that the level of reset increased downwards in the parent crater, as would be expected relative to the three-dimensional distribution of levels of shock in the final crater wall, that is, shock was greatest at the base of the crater wall.
-
Zone U constitutes an exception to the general pattern of a sharp decrease in Is/FeO and a variable increase ∆Is/FeO before another sharp decrease. For zone U, the increase that follows a reset is usually less than the preceding reset decrease, resulting in a continuous decrease in zone U’s total maturity index (Fig. 13.1c↑). As zone U’s frequency of resetting impacts as a function of depth appears consistent with most other zones (Table 13.6, Column 6), this zonal-wide change in pattern suggests that the average energy of resetting impacts increased at the time of the deposition of zone U regolith ejecta, with the increase in impact energy dying out within the overlying zone T+T*. As discussed previously, the source of zone U regolith ejecta appears to be four hemispherical craters (Steno. Emory, Faust and Sputnik) in the Crater Cluster, and these craters may be the result of a cometary aggregate’s impacts. The zone U pattern may be the consequent of periodic passage through a cometary tail of debris. The discussion for zone U in §5.0 examines the compositional evidence for such a possibility.
5.0 Petrography and Composition of Deep Drill Core Regolith Zones
5.1 Introduction
Table 13.1a↑ and Table 13.1b↑ include summaries of the variations in stratigraphic parameters for the Apollo 17 deep drill core zones initially defined by an estimation of significant positive or negative changes in Is/FeOm minima from Fig. 13.1c↑ and then verified both in the raw Is/FeO data supplied by Morris (pers. comm.) and by correlation with other variables. Differences in detailed petrography of each of the identified deep drill core regolith zones (Table 13.1a, Column 6) generally correspond with the definition of zones based on Is/FeO data. Of particular usefulness in correlating petrography with maturity indices has been the work of Taylor et al. (1979) whose summary graphs are reproduced in Fig. 13.3a↑, Fig. 13.10a↓ and Fig. 13.10b↓. Numerous chemical analyses for specific depths reported by Laul et al., (1978, 1979), Laul and Papike (1980a) and by Meyer (2012) provide additional stratigraphic data that support the indicated definition of deep drill core zones and the identification of their source craters and the geological context of the latter’s local regolith.
 Fig. 13.10a. Graph of percentage variations in basalt lithic clasts as measured by modal analysis (microscope point counting of particle types) of 171 thin sections from the deep drill core (Taylor et al., 1979). See also Fig. 13.3a↑ for agglutinate variations and Fig. 13.10b↓ for black (+orange) glass (volcanic ash) variations.
 Fig. 13.10b. Graph of percentage variations in black (+orange) glass (volcanic ash) as measured by modal analysis of 171 thin sections from the deep drill core (Taylor et al., 1979). See also Fig. 13.3a↑ for agglutinate variations and Fig. 13.10a↑ for mare basalt clast variations..
5.2 Compositional Modeling of Source Regolith for Deep Drill Core Regolith Ejecta Zones
Laul et al.’s (1978, 1979) and Laul and Papike’s (1980a) regolith ejecta zone analyses are a remarkable resource in understanding the nature and derivation of the deep drill core’s regolith ejecta zones. In modeling their data to verify likely zone source craters, the mix of various regolith sample chemical components employed are: (1) Station 1 high TiO2 and low U+Th regolith (71501) derived largely from ilmenite basalt (Rhodes et al., 1974); (2) South Massif high SiO2 and U+Th and low TiO2 regolith (73121) (Laul et al., 1981); (3) North Massif moderate SiO2 and low U+Th, and TiO regolith (76501); and (4) Sculptured Hills moderate SiO2, U+Th and TiO2 regolith (78501) and (78421) (Rhodes et al., 1974). In addition, it was found that an added 5-30% of orange+black ash (74220) (Rhodes et al., 1974) and/or VLT (very low titanium) ash bead from 70007 (Vaniman and Papike, 1977) compositions to several of the modeling mixes was required to approach a reasonable match with Laul et al.’s zone analyses. Uranium and thorium analyses of model components are largely those of Silver (1974) or Laul et al. (1978, 1979), Laul and Papike (1980a), and Meyer (2012) and including Eldridge et al. (1974) for 71501. In most cases, iterative modeling of mixes of these sample compositions came within 0.5 wt % of Laul et al.’s zone analyses or their average. Exceptions are noted in the zone specific discussions.
As indicated in the mixing proportions given in many modeling tables of this section, there is a strong suggestion that significant orange+black ash (74220) as well as a VLT ash (bead in 70007) (compositionally similar to VLT scoria 78526) are present in most regolith zones; however, it is not clear why their compositional contributions are not contained within the other component regoliths. This may be that, due to the ashes’ very fine grain size (see 74220 in Graf, 1993), they were not included in reported analyses of the modeling components whereas they are included in the Laul analyses. Ash might be expected to be lost from the <20 µ size fraction of the modeling componets. On the other hand, there is otherwise no significant difference between the zone’s reported 20-90 µ and bulk compositions (Laul et al., 1978, 1979, and Laul and Papike, 1980a), suggesting that the 20-90 µ fraction and bulk compositions are nearly the same.
The answer to this puzzle may be that loss of very fine ash in the course of curation and/or sample preparation for analysis, that included sieving, did not affect the accuracy of the analyses. Laul et al. (1978), for example, estimate that “material loss in sieving operations was typically 10%, largely from the <20 µm fraction.”
1. Zone S: –1.30 – 19.35 cm (19.65 cm) (MOCR Crater): The major element composition (Table 13.8a) reported for the deep drill control sample 70181 from the top 0-5 cm of the nearby surface (Rhodes et al., 1974) closely matches that for this zone at its intervals of 0.6-1.1, 9.1-9.6 and 20.1-20.6 cm (Laul et al., 1978). Further, the graphs in Fig. 13.2↑, Fig. 13.3a↑ and photo in Fig. 13.11↓ show increases in agglutinates and track maturity and decreases in lithic basaltic clasts, respectively, at about 10 cm depth (Taylor et al., 1979). These changes suggest a significant addition of regolith ejecta from a larger than average nearby impact.
MOCR Crater is 1451 m in diameter and lies in the central portion of the eastern region of the floor of the valley of Taurus-Littrow, its near rim about 6.3 km from the core site. It is the largest as well as the youngest large impact crater on the floor of the valley (Table 13.3a↑). As it is the youngest large crater and zone S is the youngest regolith ejecta zone, MOCR is its most likely source crater. MOCR Crater was formed by an impact many times more energetic than other source craters (as indicated by total excavated volume (Table 13.4b↑), so its parabolic arch of maximum concentrated ejected regolith would have reached significantly beyond the 2.6 km estimated in Fig. 13.8↑ for 400-800 m diameter source craters. Just the kinetic energy present to eject the mass of thick regolith from MOCR Crater (0.01 km3), was ~10 times more than that of other source crater impacts (Table 13.4a↑). The formational energy of MOCR Crater places it at a much higher level than other source craters in Taurus-Littrow.
Relative to the composition of zone S (Table 13.8a↓), the South Massif and North Massif regolith samples 73121 and 76501, respectively, clearly do not indicate compositional similarities with many of the oxide components in zone S; however, the mix of 55% 71501 ilmenite basalt regolith, 30% 78501 Sculptured Hills regolith, and 15% 74220 orange+black ash (Table 13.8aa↓) matches the average of three analyses and of control sample 70181 within a half a percentage point. This match is consistent with MOCR Crater’s location ~2.6 km south of the base of Sculptured Hills (Fig. 13.5, QuickMap) where older source craters for MOCR pre-impact regolith are located. These correlations of bulk chemistry allow zone S to be a surrogate for the general, inter-crater regolith of the eastern Taurus-Littrow valley floor and support the interpretation that MOCR Crater, 6.3 km from the core site, is the source of zone S’s regolith ejecta.
[As a side note, the lack of a need to include VLT ash in the model for zone S, suggests that the pyroclastic fissures identified by Schmitt et al. (2017) in the Sculptured Hills to the north of MOCR Crater, are vents for orange+black ash. If true, this possibility would support the conclusion that orange+black ash eruptions largely came from fractures outside the valley floor. Fractures under the valley floor likely had been sealed off by lava eruptions just prior to the initiation of pyroclastic activity.]

See Table 13.8aa footnotes below for these reference links.

Links for Laul et al. (1978), Rhodes et al. (1974), Silver (1974) and Eldridge et al. (1974).[Note: The 4 cm long, deep drill core interval between 18.35 and 22.35 has been interpreted here as a thicker than normal zone of mixing due to the high energy of the impacting regolith ejecta coming from the 1451 m diameter MOCR Crater.]
2. Zone T+T* 22.35-47.05 cm (25.70 cm) (Sherlock and Powell Craters): The very low maturity (Morris et al., 1979) (Fig. 13.1c↑), very low agglutinate (<10%) (Fig. 13.3a↑), and high basalt fragment and orange+black ash content (Taylor et al., 1979) (see Fig. 13.2↑ and Fig. 13.11↓) uniquely distinguish zone T+T* from all other zones in the deep drill core and add strong support for the approach used in this synthesis to define other zones in the core. Table 13.8b↓ gives the reported chemical composition in comparison with the rake sample 71501 from Station 1 on the ejecta blanket of Steno Crater within the Crater Cluster area. Nothing in Table 13.8b stands out that would negate correlation with the Crater Cluster regolith, post-Steno, –Emory, –Faust, and –Sputnik impacts, although some mixing between zones T+T* and U may have reduced the zone’s TiO2 content at its base.
 Fig. 13.11. 16-25 cm portion of the deep drill core (70001/9) showing contrast in large fragment size-frequency between zone S and zone T (NASA photo from Meyer (2012)).

Links for Laul et al. (1978), Rhodes et al. (1974), §17.10, Silver (1974), Fruchter et al. (1975), and Eldridge et al. (1974).Table 13.8bb↓ shows that the mix of 75% 71501, 15% 74220 ash, and 10% 70007 VLT ash comes to within half a percentage point of matching the average of three analyses for zone T+T*. Although the U+Th values in the two zones vary between about 0.9 and 1.4 ppm, probably due to poor mixing of U+Th host minerals, the compositional, maturity and petrographic characteristics overall strongly suggest that the source area for the zone’s regolith ejecta is from the post-Steno-Emory-Faust-Sputnik area of the Crater Cluster and, specifically, from regolith developed on ilmenite basalt regolith, mixed with some South Massif regolith, ejected from Steno Crater. Evidence for the presence of pre-Steno, South Massif avalanche material in rake sample 71501 is in the uranium and thorium concentrations (0.23 and 0.75 ppm, respectively) versus their concentrations in ilmenite basalt rock samples from the bedrock rubble at the rim of the nearby ~10 m diameter crater (Station 1, Chapter 10). U and Th contents in basalt samples 71055 and 71136 are 0.132 and 0.32 ppm (Brunfelt et al., 1974) and 0.22 and 0.46, ppm (Eldridge et al., 1974), respectively. As compared to U+Th = 3.45 ppm in young light mantle sample 73121. These lower bedrock values would indicate a possible 10-20% of South Massif regolith in 71501; however, the modeling calculations appear to close without adding a portion of 73121 to the mix . Adding 10% of 73121 to the model in place of equally high SiO2, 70007 VLT bead would create an imbalance in both Al2O3 and CaO relative to the average of the Laul et al. analyses. Analytical error limits for U and Th analyses and poor mixing of the regolith particle components may explain the differences noted here.
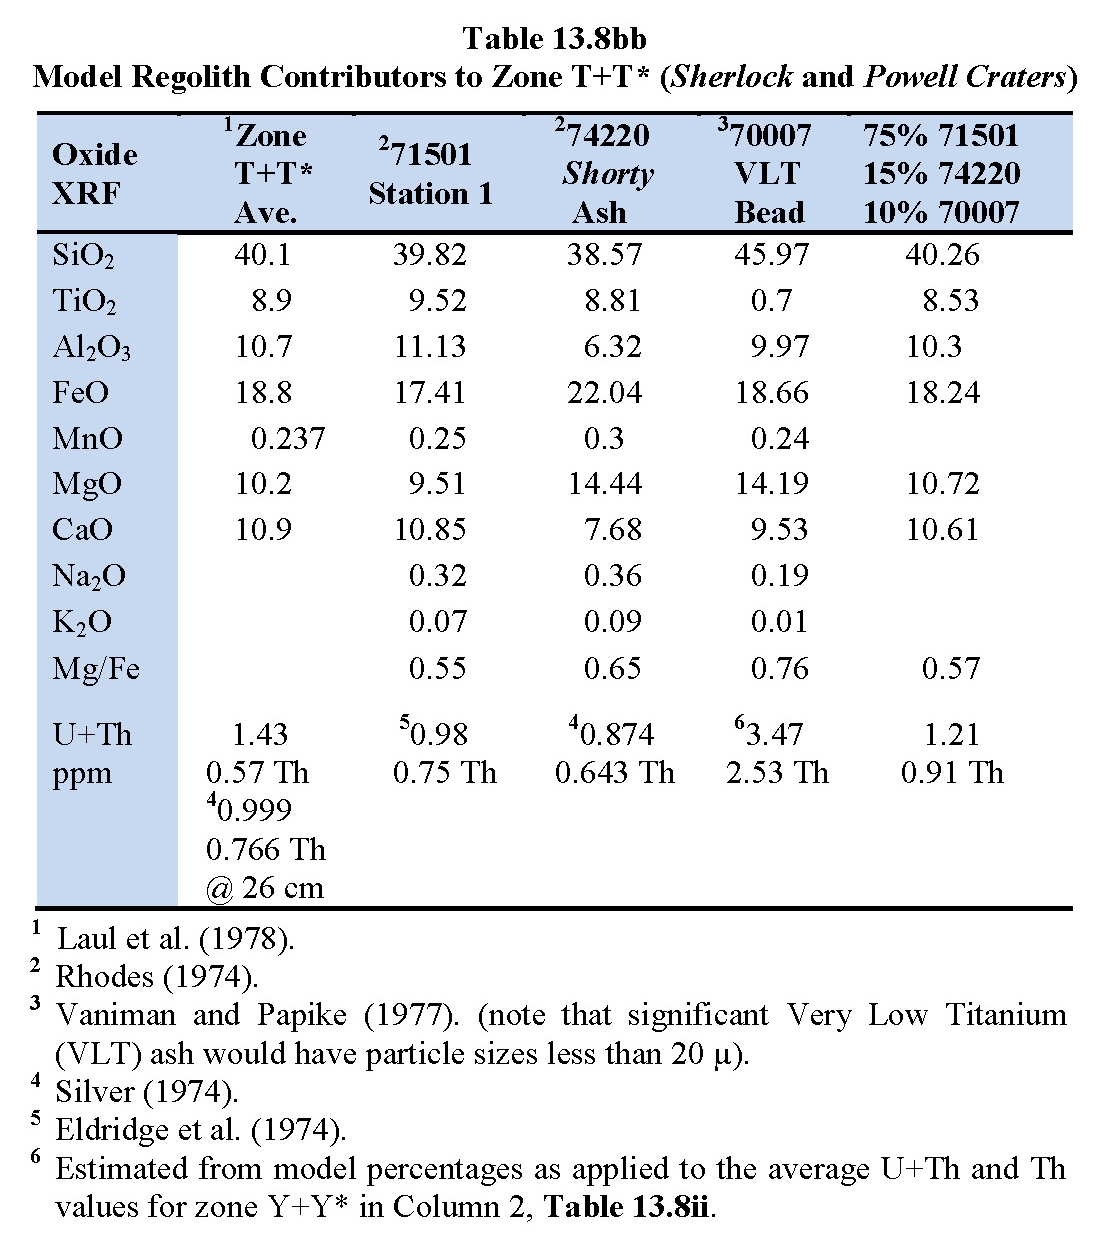
Links for Laul et al. (1978), Rhodes et al. (1974), Vaniman and Papike (1977), Silver (1974), Eldridge et al. (1974), and Table 13.8ii↓.The circular Sherlock and Powell Craters, respectively, both appear similar to each other as well as younger in diameter to depth ratios (Table 13.3a↑) than the elliptical craters of the Crater Cluster. Both craters are potential source craters for zone T+T*. As there is no other zone in the deep drill core that resembles T+T*, it is likely that Sherlock and Powell Craters formed simultaneously. This zone also may include small contributions from South Massif avalanche regolith (see zone U discussion, below); however, the rake sample 71501, as well as large rock fragments in regolith developed on the Steno Crater ejecta blanket, appears to be largely derived from an ilmenite basalt parent (Schmitt, 2014b).
The FeO and trace element composition of deep drill core zone T+T*’s sample 70008 (at 28 cm), is distinct (Laul et al., 1978) from all other zones in the core and in many elements distinct from the ranges of analyses of 10084, the representative regolith sample from Apollo 11 high TiO2 basalt (Meyer, 2012). The comparisons are as follows, with 10084 contents given in brackets [ ]:
a. FeO is ~3 wt % higher (~18% vs. ~15%). [14.4-16 wt%]
b. Sc at 72.1 ppm is highest. [55-60 ppm]
c. Co at 22.3 ppm is lowest. [18-34 ppm]
d. Ni at 60 ppm is lowest. [200-250 ppm]
e. Ga at 5.2 ppm is lowest. [4-5 ppm]
f. Tb at 2.2 ppm is highest. [2.5-3.0 ppm]
g. Dy at 12. 6 ppm is highest. [17-21 ppm]
h. Yb at 8.21 ppm is highest. [10-11 ppm]
i. Lu at 1.16 ppm is highest. [1.4-1.7 ppm]
j. Hf at 6.5 ppm almost the highest. [9-11 ppm]
k. Ta at 1.44 ppm is highest. [1.2-1.4 ppm]
l. Th at 0.766 ppm (26 cm) is lowest (Silver, 1974). [1.6-1.9 ppm]
m. U at 0.233 ppm (26 cm) is lowest (Silver, 1974). [0.41-0.5 ppm]
These trace element data tend to indicate that zone T+T+ represents as close to an unmodified, ilmenite basalt regolith as is present in the Taurus-Littrow sample suite. Distinct contrasts with the ilmenite basalt regolith 10084 are present in lower FeO (but TiO2 is lower as well), Sc, Ni, Hf, Th and U, suggesting different mantle source regions for basalts erupted at the two locations. Zone T+T* regolith therefore would provide a close representation of the partial melt produced by reheating the ilmenite basalt’s source region in the upper mantle, presumably a region that has not been affected by the hypothesized, impact induced overturn of the upper mantle beneath the Procellarum basin (§26.0).
3. Zone U 47.05-86.15 cm (39.10 cm) (Steno, Emory, Faust and Sputnik Craters: As previously noted in §4.3, zone U’s Is/FeO pattern is anomalous relative to other deep drill core zones. From its deposition on zone V+V* to final burial by zone T+T*, it shows a continuous, drawn-out decline in Is/FeO. Table 13.8c↓ gives the major element composition of zone U that appears to match what can be inferred about the pre-Steno-Emory-Faust-Sputnik regolith. This correlation is re-enforced by a Th content of 1.095 ppm and an U+Th content of 1.414 ppm that suggests a mix of some non-basaltic material with ilmenite basalt regolith (71501). Sculptured Hills-type regolith ejecta (78501) from older potential sources craters (WC, SWP, Cochise, Shakespeare Craters,) would have reached the area. In addition, as discussed below relative to zone W, there is the possibility that mass wasting avalanche deposits from the slope of the South Massif once covered the area, similar to the light mantle avalanche deposits (§17.0).

Links for Laul et al. (1978), Rhodes et al. (1974), Silver (1974), Edridge et al. (1974), and (§17.10).Table 13.8c includes a comparison of zone U’s reported bulk compositions with that of samples of ilmenite basalt 71501, Sculptured Hills 78501, and South Massif 73121. For Sculptured Hills regolith 78501, with 1.337 ppm Th, to raise Th in 71501 from 0.75 ppm to 1.095 would require the mix in zone U to be ~81% Sculpture Hills regolith. This percentage is highly unlikely, as it would distort the major element contents of zone U well beyond what is reported. On the other hand, only 15% of South Massif regolith 73121 with Th = 2.52 ppm needs to be mixed to 60% 71501 to give Th = 1.18 and nearly match zone U’s Th = ~1.095 ppm. This percentage, along with 10% VLT ash bead from 70007 (Vaniman and Papike (1977)) and 15% orange+black ash 74220 also gives appropriate adjustments to 71501 major oxide contents to match zone U’s (Column 6 in Table 13.8cc↓). The match is within half a percentage point except for FeO; however, Laul et al.’s (1978) FeO value for 46.8-47.3 cm depth (FeO = 19.0%) is from the top of zone U and may be mixed with the base of zone T* regolith (FeO =19.0%). Samples from zone U also are reported (as containing 20-24 modal-% orange+black ash (Taylor et al., 1977) and an estimated ~2 modal-%, yellow-green VLT(?) ash (Vaniman et al., 1979). (Note that significant amounts of either ash would have particle sizes less than 20 µ and some may have been lost during sieving before analysis.).
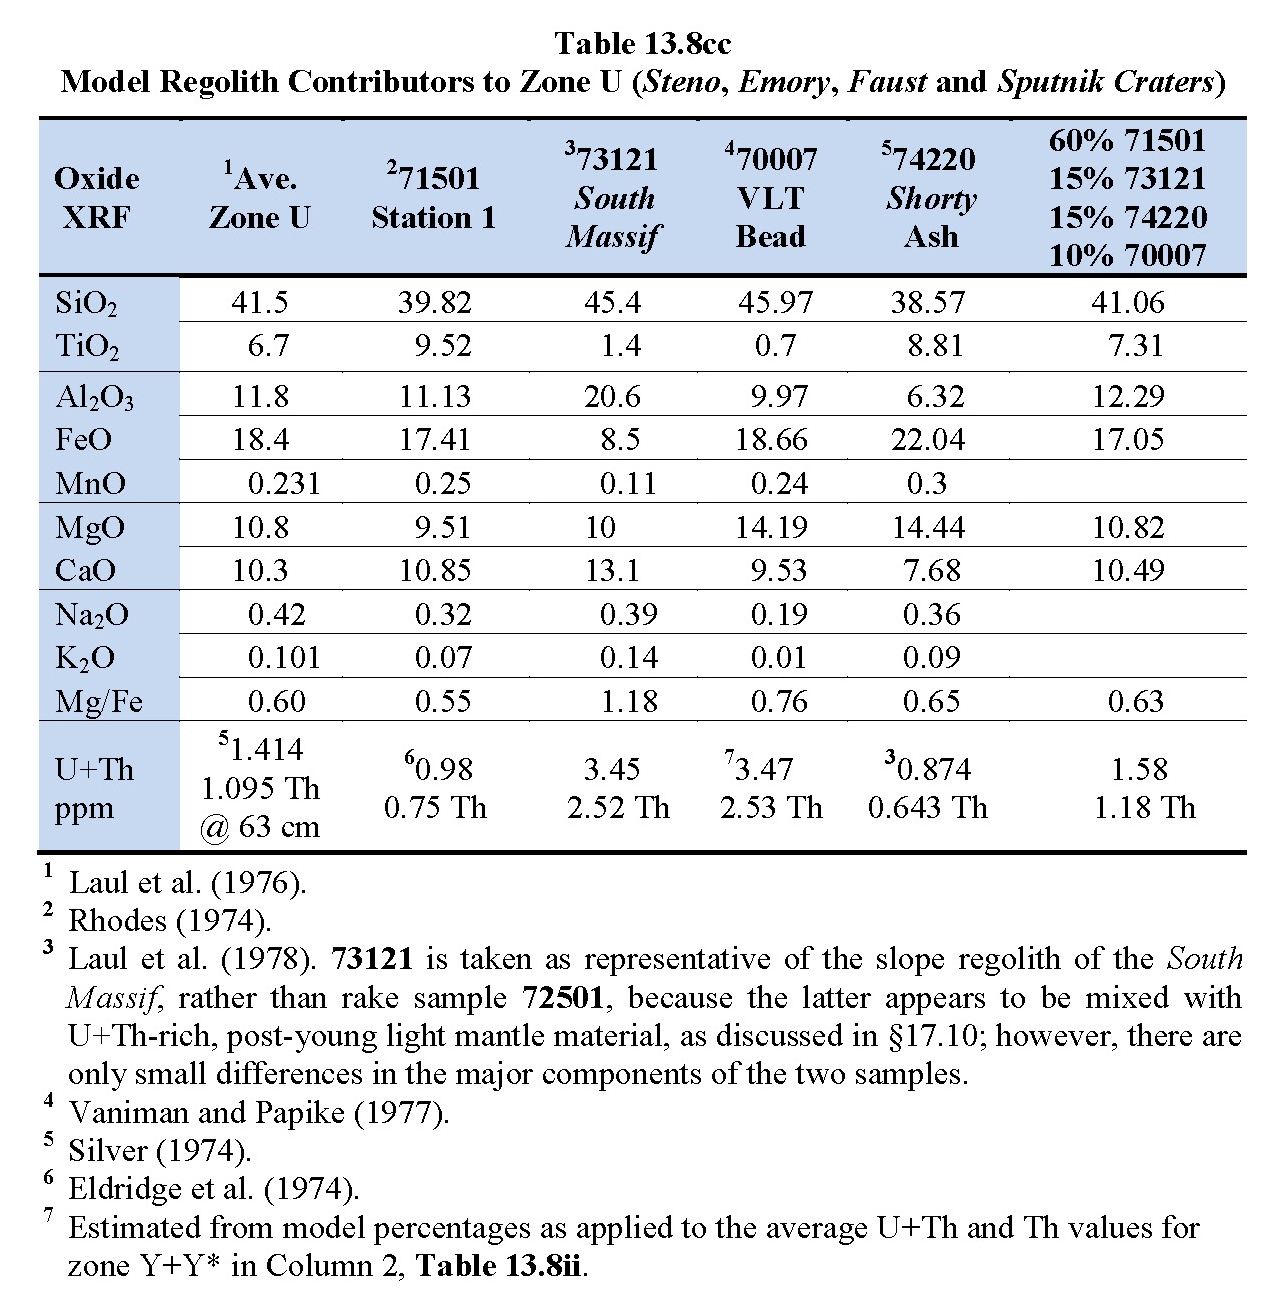
Links for Laul et al. (1978), Rhodes et al. (1974), Vaniman and Papike ((1977), Silver (1974), Eldridge et al. (1974), §17.10, and Table 13.8ii↓.It would appear that a South Massif avalanche deposit covered the pre-Crater Cluster area and became mixed with ilmenite basalt regolith to become the regolith ejecta now found in zone U as well as zones W (Hess) and Y+Y* (Mackin), as discussed below with source craters in the Crater Cluster area. As zone U, with its unusual Is/FeO pattern, may be related to regolith ejected from an area in which elliptical craters Steno, Emory, Faust and Sputnik had formed, one hypothesis suggested above is that these apparently simultaneous oblique impacts relate to impacts of a disaggregated, long-period comet. The elliptical shape and consistently northwest (320° ± 5°) orientation of the long axes of the four craters also distinguishes these four craters from other, circular Taurus-Littrow source craters, with the exception of the older, elliptical Hess Crater. Long-period comets also generally have a significant tail of related but much smaller objects. The high kinetic energy, cometary remnants in this tail would have been periodically encountered by the Moon in its orbit around the Sun, increasing the reset effects of small impacts recorded in zone U until the comet’s tail dissipated soon after zone T+T* was deposited. This possibility may be supported by the pattern in Fig. 13.3b↑ showing a decreasing modal-% of agglutinates In zone U with decreasing depth. Even at high velocities, the low-density cometary impactors may destroy fragile glassy agglutinates at a higher rate than they create them.
Remotely sensed data compiled in the Lunar Quickmap shows the following contrasts between the area of the Crater Cluster, including Steno, Emory, Faust and Sputnik Craters, and its surroundings:
1. Clementine color indication is significantly lighter than surrounding basaltic regolith suggesting mixing with South Massif regolith.
2. OMAT is brighter (less mature) than the close surroundings, although this is consistent with Station 1 Is/FeO indications of low Is/FeO values (35) for rake sample 71501 (Morris, 1978) which are, in turn, consistent with even lower values for regolith ejecta in zone T+T* derived from the post-impact regolith around Steno, Emory, Faust and Sputnik Craters in the Crater Cluster area.
3. Diviner H-Parameter is similar to the Taurus-Littrow massifs, suggesting different thermo-physical properties than the area’s close surroundings, consistent with images and samples obtained at and near Station 1 that show significant concentrations of rocks and boulders. Also, in the later discussion of zone W, synthesis of U+Th and Th contents suggest that 60-68% of regolith ejecta from W’s source crater, Hess, consists of light mantle-like regolith from the South Massif. Hess Crater is 2.7 km from the core site, near the optimum regolith ejecta distance of 2.6 km (Fig. 13.8↑). On the other hand, Hess is only about 2.2 km from the base of the South Massif, in contrast to the 6.5 km separation of Station 1 sample 71501 from that base, with the Steno, Emory, Faust and Sputnik group in between. A Th content comparison of zone W (Th = 1.535 ppm) with South Massif derived light mantle sample 73121 (Th = 3.45 ppm) in Table 13.8ff↓, a ratio of 0.49, when compared against an estimated 10.4 m pre-Hess regolith depth (Table 13.16↓, §8.8) suggests that ~5 m of a light mantle-like deposit could have been included in a thick portion of in situ regolith at Hess Crater’s location. This would be roughly consistent with the estimated >3 m thicknesses of the young light mantle (§17.2) at 2.2 km from the base of the South Massif.
4. UVVIS image is brighter than the close surroundings, indicating greater iron abundance than for those for close surroundings, consistent with the elevated FeO content shown in Fig. 13.1c↑ for zone T+T* whose regolith ejecta is interpreted as coming largely from ilmenite basalt regolith developed on bedrock ejecta blankets, whereas, surrounding areas have regolith that is less pristine basaltic regolith.
4. Zone V+V*: 86.15-111.45 cm (25.30 cm) (Camelot Crater): Initially, this 25.30 cm section of the core appeared in Fig. 13.1c↑ to be two zones of 11.80 and 13.50 cm. Laul et al.’s (1979) compositional analyses of the two potential zones, however, show very little distinction between them. The two initial zones, therefore, have been combined.
The wall rock boulders observed and sampled at Station 5 (Schmitt et al., 2017) initially suggested that the Camelot impact primarily excavated ilmenite basalt; however, in contrast with overlying zones U, T+T*, and S, the relatively low FeO and TiO2 (15.3% and 5.7%) and relatively high SiO2 (42.3%) of both zone V+V* analyses reported by Laul et al. (1979) indicate a contribution from another, non-basaltic source. The compositions of several regolith samples in comparison to analyses from zone V+V* are shown in Table 13.8d. The possibility of significant Sculptured Hills-like regolith being included in zone V+V* is suggested by the thorium (1.090 ppm) and uranium (0.341 ppm) contents that are significantly higher than measured in ilmenite basalt regolith samples such as zone T+T* (0.766 ppm Th and 0.233 ppm U).

Links for Laul et al. (1978), Rhodes et al. (1974), Silver (1974), and Eldridge et al. (1974).Station 5 data from the Apollo 17 Traverse Gravity Experiment indicate relatively low-density bedrock below the Camelot Crater area (Talwani et al., 1973). This, along with the existence of hills (kapukas) of Sculptured Hills-like material (M3 compositional data, Noah Petro, pers. comm.) elsewhere on the valley floor (Bear and Family Mountains), suggest that the composition of zone V+V* regolith ejecta might be consistent with pre-Camelot regolith having been developed in part on Sculptured Hills-like bedrock with only a thin basalt cover in this general area, now represented by Camelot’s rim boulders. Table 13.8dd indicates that a mix of 44% ilmenite basalt regolith 71501 and 30% Sculptured Hills regolith 78501, and 26% VLT ash (70007 bead) appears to reach a reasonable fit with the Laul et al. average for zone V+V*. Although not a perfect match with zone V+V*’s major element composition, all values for the mix fall within 0.5 percentage point. Using VLT scoria sample 78526 from the Sculptured Hills (col. 6 in Table 13.8dd) rather than the 70007 bead from the core would change the match slightly, particularly in SiO2 (higher) and MgO (lower).
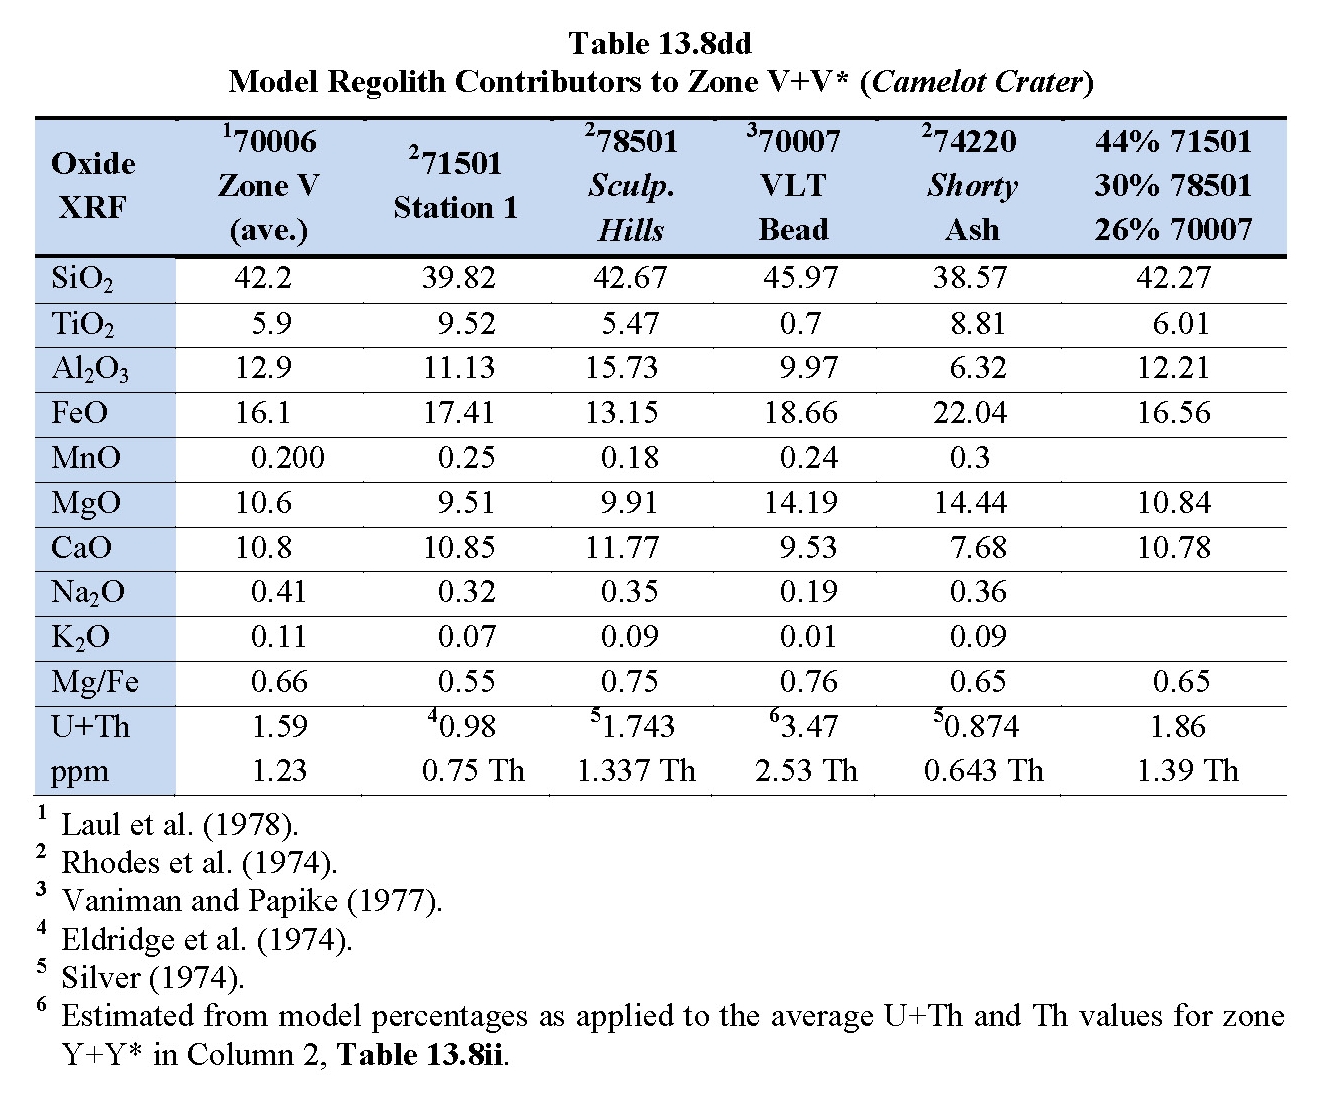
Links for Laul et al. (1978), Rhodes et al. (1974), Vanimann and Papike (1977), Eldridge et al. (1974), Silver (1974), and Table 13.8ii↓.[Schmitt (2014a) notes that there may have been a similar surface or near-surface exposure of Sculptured Hills-type regolith in the vicinity of Shorty Crater. The light gray regolith that overlies the orange+black ash deposit exposed at the rim of that crater, largely is comprised of non-basaltic regolith represented by samples 74240 and 74260 that also resemble Sculptured Hills regolith 78501. (§11.0)]
The high model abundance of VLT ash given in Table 13.8dd↑ is at odds with Vaniman and Papike’s (1977) report that thin-section analysis of the core at the equivalent depths for zone V+V* has about 5% VLT ash as well as about 18% orange+black ash (Taylor et al., 1979). That amount of orange+black ash would result in an imbalance in both SiO2 and TiO2 relative to the Laul et al. (1979) average.
Known potential sources for pyroclastic VLT and orange+black ashes are areas in the Sculptured Hills (Schmitt et al., 2017) and near Shorty Crater (Schmitt, 2014a; §10.0), respectively. In addition, a pyroclastic fissure has been identified on the flank of the North Massif (Schmitt et al., 2017) that is also a potential source of either ash type; although remote sensing data for the apparent debris flow from this fissure, relative to the composition of orange+black ash (74220), suggest there was a buildup of a now collapsed, lower titanium and higher silica ash cone on the slope above the debris flow (Petro and Schmitt, 2018). As Camelot Crater is within 2 km of the areas of both Shorty Crater and the North Massif fissure, the fissure is a likely source for ash in zone V+V*.
At a thickness of 25.30 cm, the correlation of zone V+V*’s regolith ejecta with Camelot Crater raises a question relative to §3.4.3’s quantitative verification of a close relationship of regolith ejecta thickness with source crater distance from the core site. This zone V+V* thickness makes it anomalously thick relative to most other zones; however, at a location that is slightly less than a crater diameter from Camelot (0.700 vs. 0.744 km, respectively), late stage, low energy regolith ejecta from just inside the current crater rim probably contributed to the thickness of the zone. This possibility is supported by the much higher percentage (62%) (Taylor et. al., 1979) of basaltic lithic clasts in the upper portion of zone V+V* than is present (32%) in the lower portion (Fig. 13.10a↑).
5. Zone W: 111.45-144.05 cm (32.60 cm) (Hess Crater): As discussed above relative to zone U, zone W’s apparent source crater, Hess Crater, resembles Steno, Emory, Faust and Sputnik Craters in having an elliptical shape; however, Hess has a long to short axis ratio of ~1.36 versus 1.03-1.16 for the other four craters. In addition, Hess Crater’s diameter to depth ratio indicates its relative age is significantly greater than those for Steno, etc. (Table 13.3a↑), the lack of a timing association between Hess Crater and Steno, etc. craters is further indicated by the orientation of its long axis at ~345° versus ~315°-325°, respectively, for Steno, etc. Hess Crater, therefore, is an older, low angle impact feature, but probably formed by an asteroidal impactor.
The relatively high U+Th content (1.985 ppm) of zone W (Silver, 1974) suggests that the very mature regolith ejected by Hess Crater near the South Massif had accumulated significant South Massif regolith ejecta like 73121 (U+Th = 3.995 ppm). Comparison of rake sample 71501 (U+Th = 0.98, Th = 0.70 ppm) from Station 1 (near Steno) and 73121 from Station 2 on the South Massif suggests that ~30% of zone W is derived from the South Massif (Table 13.8e, Column 6) as compared to 58% from ilmenite basalt regolith 71501 and 12% from VLT ash (70007 bead).
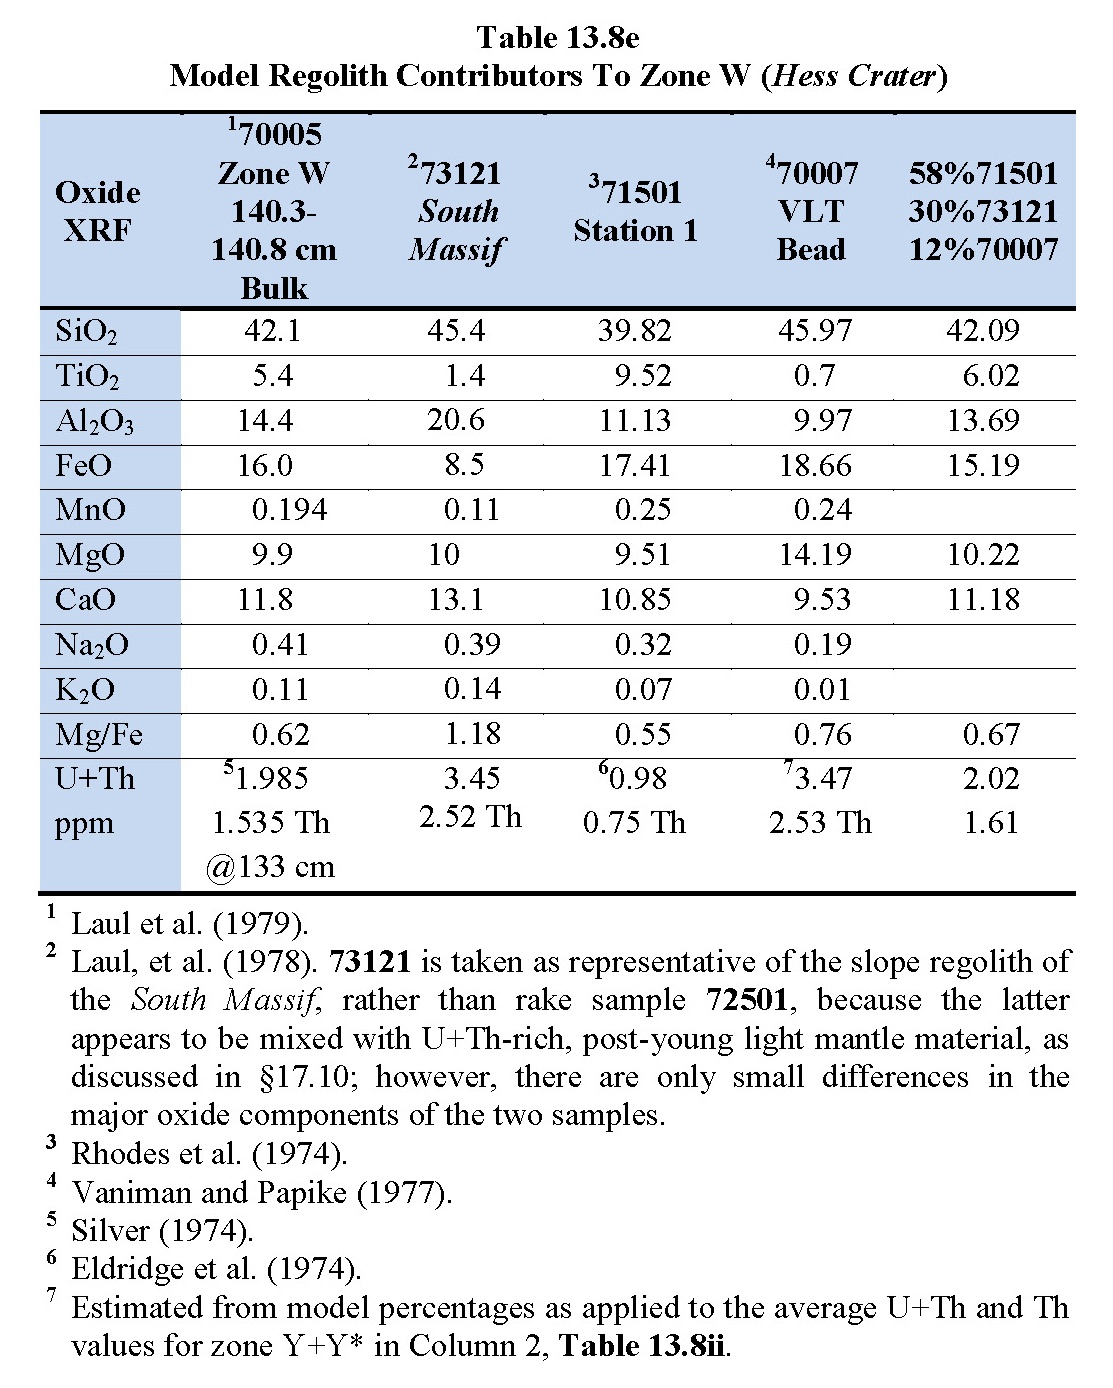
Links for Laul et al. (1978, 1979), §17.10, Rhodes et al. (1974), Vaniman and Papike (1977), Silver (1974), Eldridge et al. (1974), and Table 13.8ii↓.Although the combination of oxide equivalent analyses in Column 6 in Table 13.8e↑ correlates with that for zone W’s one analysis (Laul et al., 1979) within somewhat more than the desired 0.5 percentage point, the indicated combination nonetheless supports the probability that regolith ejecta from Hess Crater included material from a light mantle-like avalanche deposit from the South Massif (§17.0). Zone W has significantly more mature regolith than any of the deep drill core zones (Fig. 13.1c↑) with an Is/FeOm, averaging about 75. This fact probably indicates that the pre-Crater Cluster avalanche consisted of South Massif slope regolith that was more mature than that which formed the young light mantle deposit (Is/FeOm = 48). It may be that the accumulation of more mature regolith on the slope of the South Massif prior to the pre-Hess Crater avalanche indicates the relative age of movement on the Lee-Lincoln thrust fault preceded Hess Crater at 0.394 Ga as well as preceding zone Y+Y*’s Mackin Crater at 0.821 Ga (Table 13.15↓). Later sections of this synthesis will estimate absolute ages for zone (§6.0), and recent mass wasting (§17.0) depositions.
6. Zone W*: 144.05-163.55 cm (19.50 cm) (Horatio Crater): Zone W* appears to be regolith ejecta from Horatio Crater, based on relative age comparisons, the drill site’s distance from Horatio’s rim vs. zone W*’s thickness (Fig. 13.8↑), and its intermediate SiO2, TiO2 and Th contents (Table 13.8f↓). The center of Horatio lies about 700 m from the center of Camelot Crater for which the compositional modeling for zone V+V* (Table 13.8dd↓) indicates that the Camelot impact was into regolith containing both ilmenite basalt debris (71501) and Sculptured Hills-like regolith (78501). A better compositional fit for zone W*, however, comes from comparing zone W* with a mix (Table 13.8ff↓) of 53% ilmenite basalt regolith (71501) and 37% North Massif (76501) regolith with 10% VLT ash (70007 bead). This match suggests that the Horatio Crater impact encountered ilmenite basalt regolith mixed with a North Massif avalanche deposit.

Links for Laul et al. (1979, 1981), Rhodes et al. (1974), Elridge et al. (1974), and Silver (1974).
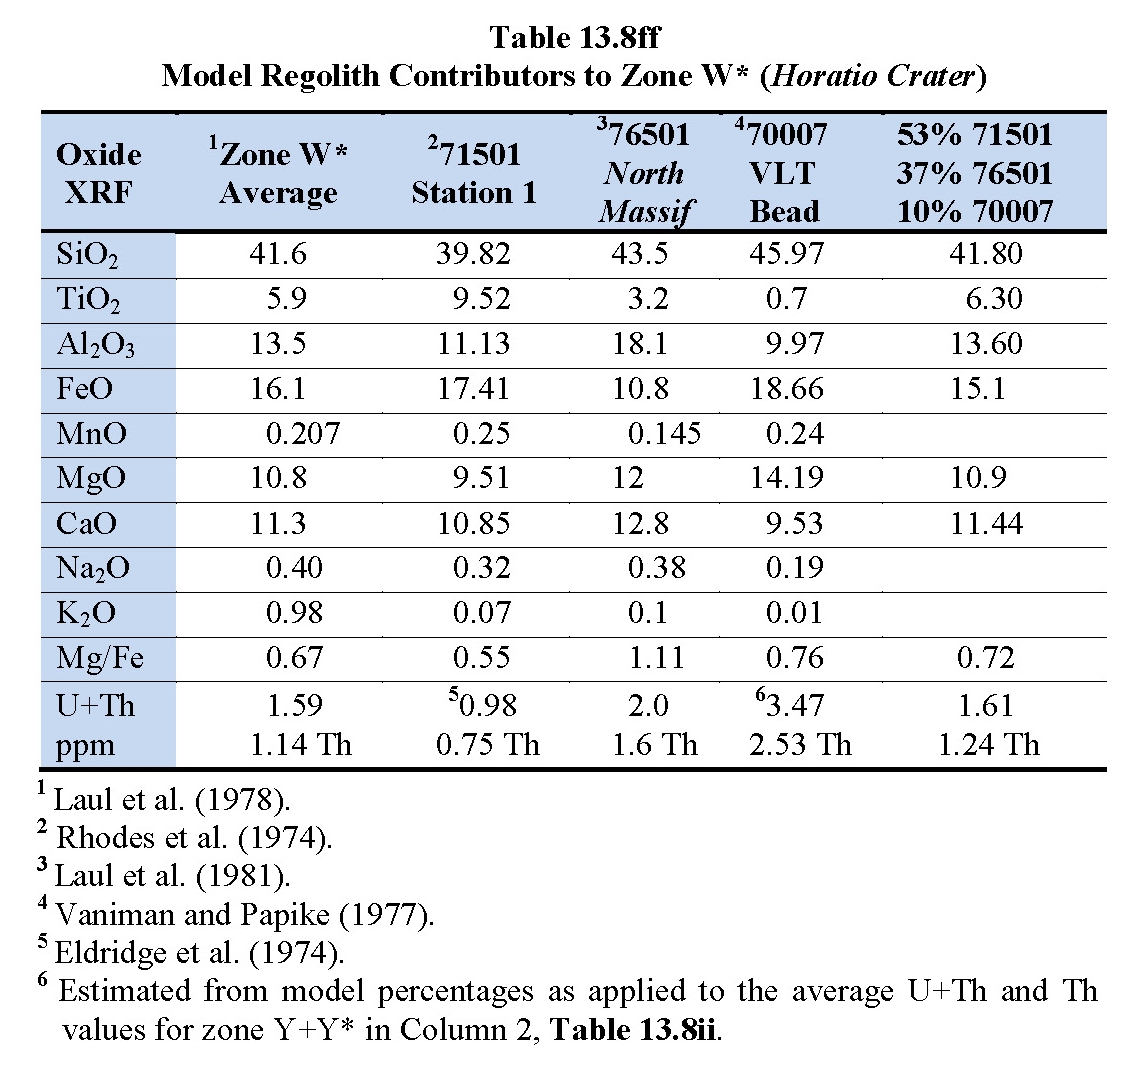
Links for Laul et al. (1978, 1981), Rhodes et al. (1974), Vaniman and Papike (1977), Eldridge et al. (1974), and Table 13.8ii↓.Horatio Crater also lies about 4 km from, and roughly orthogonal, to the base of the North Massif and where a pyroclastic fissure is located (Schmitt et al., 2017; Petro and Schmitt, 2018). Horatio is also in line with the head of a debris flow below that fissure that may be the remains of an unstable pyroclastic cone. The slope of the North Massif opposite Horatio Crater is 26°-27° (from LROC QuickMap), that is, about the same as the slope of the South Massif from which the light mantle avalanches originated (Schmitt et al., 2017; §17.0). The initiation of the fissure eruption on the side of the North Massif may have triggered an avalanche similar to the South Massif’s light mantle. The suggested >4 km run-out of such an avalanche would be comparable to that of the young and old light mantle avalanches from the South Massif (§17.0) and result in ~3 m of North Massif regolith being deposited on pre-Horatio ilmenite basalt regolith. Such an avalanche would appear to be a likely source of North Massif regolith in zone W*.
7. Zone X: 163.55-188.45 cm (24.90 cm) (Henry Crater): The SiO2 and TiO2 contents reported by Laul et al. (1979) for zone X (Table 13.8g), when compared with ilmenite basalt 71501, North Massif 76501, and Sculptured Hills 78421 regoliths, suggest a mix of all three such components. Zone X’s apparent source crater, Henry, is located on the valley floor near the base of the North Massif just west of Wessex Cleft where pre-Henry regolith ejecta could accumulate from all three of these geologic units. Table 13.8gg↓ shows the average zone X composition compared with a mix of 60% ilmenite basalt regolith; 20% Sculptured Hills regolith; 15% North Massif regolith; and 5 % VLT ash.

Links for Laul et al. (1979, 1981), Rhodes et al. 1974), Miller et al. (1974), Silver (1974), and Eldridge et al. (1974).

Links for Laul et al. (1979, 1981), Rhodes et al. 1974), Miller et al. (1974), Vaniman and Papike (1977), Silver (1974), and Eldridge et al. (1974), and Table 13.8ii↓.8. Zone X* 185.45 -200.45 cm (15.00 cm) (Nemo Crater): The SiO2 and TiO2 contents reported for zone X* (Table 13.8h↓), when compared with ilmenite basalt 71501 and South Massif 73121 regoliths, suggest an approximately equal mix with about 20% orange+black ash added (Table 13.8hh). This mix is also suggested both by the high proportion of basalt fragments in the lithic clast portion of the zone and by the location of Nemo Crater about 2 km northeast of the base of the South Massif, well within range of avalanches (§17.0). There is not a clear explanation for zone X*’s 15 cm thickness (Table 13.1a↑) in the core versus the relatively thin pre-Nemo regolith of ~6.5 m (Table 13.16↓) and Nemo’s 4.65 km distance from the core site (Fig. 13.8↑). This may be an indication of limited understanding of the structure of the parabolic sheath at large distances from a source crater.

Links for Laul et al. (1978, 1979), §17.10, Rhodes et al. (1974), Silver (1974), Eldridge et al. (1974).

Links for Laul et al. (1978, 1979), §17.10, Rhodes et al. (1974), Silver (1974), Eldridge et al. (1974).9. Zone Y+Y*: 200.45-252.75 cm (52.30 cm) (Mackin Crater): The 52.30 cm thickness of zone Y+Y* regolith ejecta suggests that its source crater is located near the 2.6 km range of maximum deposition after impact (Fig. 13.8↑). The relatively high SiO2 and U+Th contents indicate that significant South Massif-related regolith ejecta is contained in zone Y+Y*, with the intermediate TiO2 values also showing that significant ilmenite basalt regolith also is present. Only Mackin and Hess Craters meet these constraints; however, as previously noted in the discussion of zone W, the elliptical Hess Crater (~849 x 624 m) is the younger crater, its ejecta overlying the ejecta blanket of Mackin Crater (QuickMap; also Fig. 13.5), and is interpreted as being the source crater for zone W.

Links for Laul et al. (1978, 1979), §17.10, Rhodes et al. (1974), Silver (1974), Eldridge et al. (1974).Four analyses of zone Y+Y* regolith ejecta and the various other regolith sample analyses that might relate to these compositions are given in Table 13.8i↑. The average of the zone Y+Y* analyses and compositions of ilmenite basalt regolith 71501, South Massif regolith 73121, and the VLT bead from 70007 are compared in Table 13.8ii↓. Mixing these three samples in 50/35/15 proportions, respectively, comes within a half a percentage point of matching the average composition for zone Y+Y*. As with the similar match of these analyses with that of zone W, the presence of a few meters thick avalanche deposit from the South Massif in the pre-Mackin regolith is indicated.
[As discussed in §17.0, rake sample 72501 does not appear to reflect the U and Th composition of the slope of the South Massif prior to the young light mantle avalanche as indicated by young light mantle trench samples 73121 and 73221. These two samples indicate that U+Th at that earlier time equals ~3.45 ppm, Th = ~2.52 ppm, and U = 0.938, using a Th/U ratio equal to 3.70 (see Silver, 1974, analysis for 73221 mis-labeled as 73321). Enrichment of 72501 in U+Th has taken place since the young light mantle deposition (§17.10).
In addition, using the model percentages in Table 13.8ii, below, and equating the U+Th value for 70007 to the Y+Y* average U+Th in Column 2 of Table 13.8ii, the calculated U+Th and Th values for 70007 are estimated to be 3.47 and 2.53 ppm, respectively, values that have been used for 70007 in all relevant tables in this section.]

Links for Laul et al. (1978, 1979), §17.10, Rhodes et al. (1974), Vaniman and Papike (1977), Silver (1974), and Eldridge et al. (1974).Initially, zone Y+Y* was divided into two zones of 39.50 and 12.80 cm thicknesses, respectively, on the basis of ~1 wt% differences in the SiO2, MgO, TiO2 FeO and U+Th contents (Table 13.8i↑, Column 5). In various subsequent zone comparisons of various parameters, however, the graphical plots for Y* fell significantly outside the ranges of other zones. Combining the two zones brought zone Y+Y* into the trends represented by the other 10 zones. The differences in the compositions may indicate turbulent mixing in the regolith ejecta parabola was incomplete for this particularly thick zone. A suggestion of overturn of the source regolith and incomplete mixing also can be seen in the increase of SiO2, MgO and U+Th and decrease in TiO2 and FeO with depth (Table 13.8i), as would be expected with impact overturn of ilmenite basalt regolith overlain by avalanche regolith from the South Massif. Arguing against this hypothesis is the apparent decrease in Al2O3 with depth. (See further discussion of South Massif avalanches in §17.0).
10. Zone Z+Z*: 252.75-285.65 cm (32.90 cm) (Cochise Crater): Initially, zones Z and Z* also were considered as separate regolith ejecta deposits based on major variations in Is/FeO values in their combined portion of the deep drill core. Further investigation, discussed previously (§4.0), indicates that such variations can be better explained by significant impact induced resets of Is/FeO values and their subsequent variable increases due to maturation by continued U+Th alpha+beta and solar wind proton particle radiation. Further, the curves in Fig. 13.8↑ suggest that Cochise Crater at a distance of 2.45 km from the core site should have deposited more than 21.90 cm of regolith ejecta. Combining the previously indicated thicknesses of zones Z and Z* (21.90+11.00 cm = 32.90 cm) makes Cochise as a source crater consistent with the thickness vs. source crater distance curve shown in Fig. 13.8↑.
The location of Cochise Crater just on the valley side of the contact between ilmenite basalt and the Sculpured Hills suggests that regolith from both sources should be abundant in zone Z+Z* (Table 13.8j↓). A first modeling, using the Station 8 rake sample 78501, resulted in about 70% of Z+Z* being Sculptured Hills regolith with only about 10% of ilmenite basalt regolith 71501. This match was not consistent with the geological location of Cochise. A much more geologically supportable match to within half a percentage point of the average zone Z+Z* analyses (Table 13.8jj↓), with the exception of MgO, comes from 45% Sculptured Hills trench regolith (78421), 40% ilmenite basalt regolith (71501), 10% orange+black ash (74220), and 5% VLT ash (70007 bead).
The composition of 78421 is closely matched by that of 78220 obtained from beneath a large boulder higher up the slope of the Sculptured Hills from Station 8. The MgO and TiO2 discrepancies in this model may be the result of excess norite and ilmenite fragments in the analyzed regolith ejecta of zone Z+Z* relative to the very mature (Is/FeO = 92) Sculptured Hills regolith component, 78421. It is also plausible that the pre-Cochise impact regolith includes the remains of a Sculptured Hills avalanche deposit from the nearby slopes that was enriched in norite similar to 78235. Granular debris flows from a Sculptured Hills peak are present to the east.
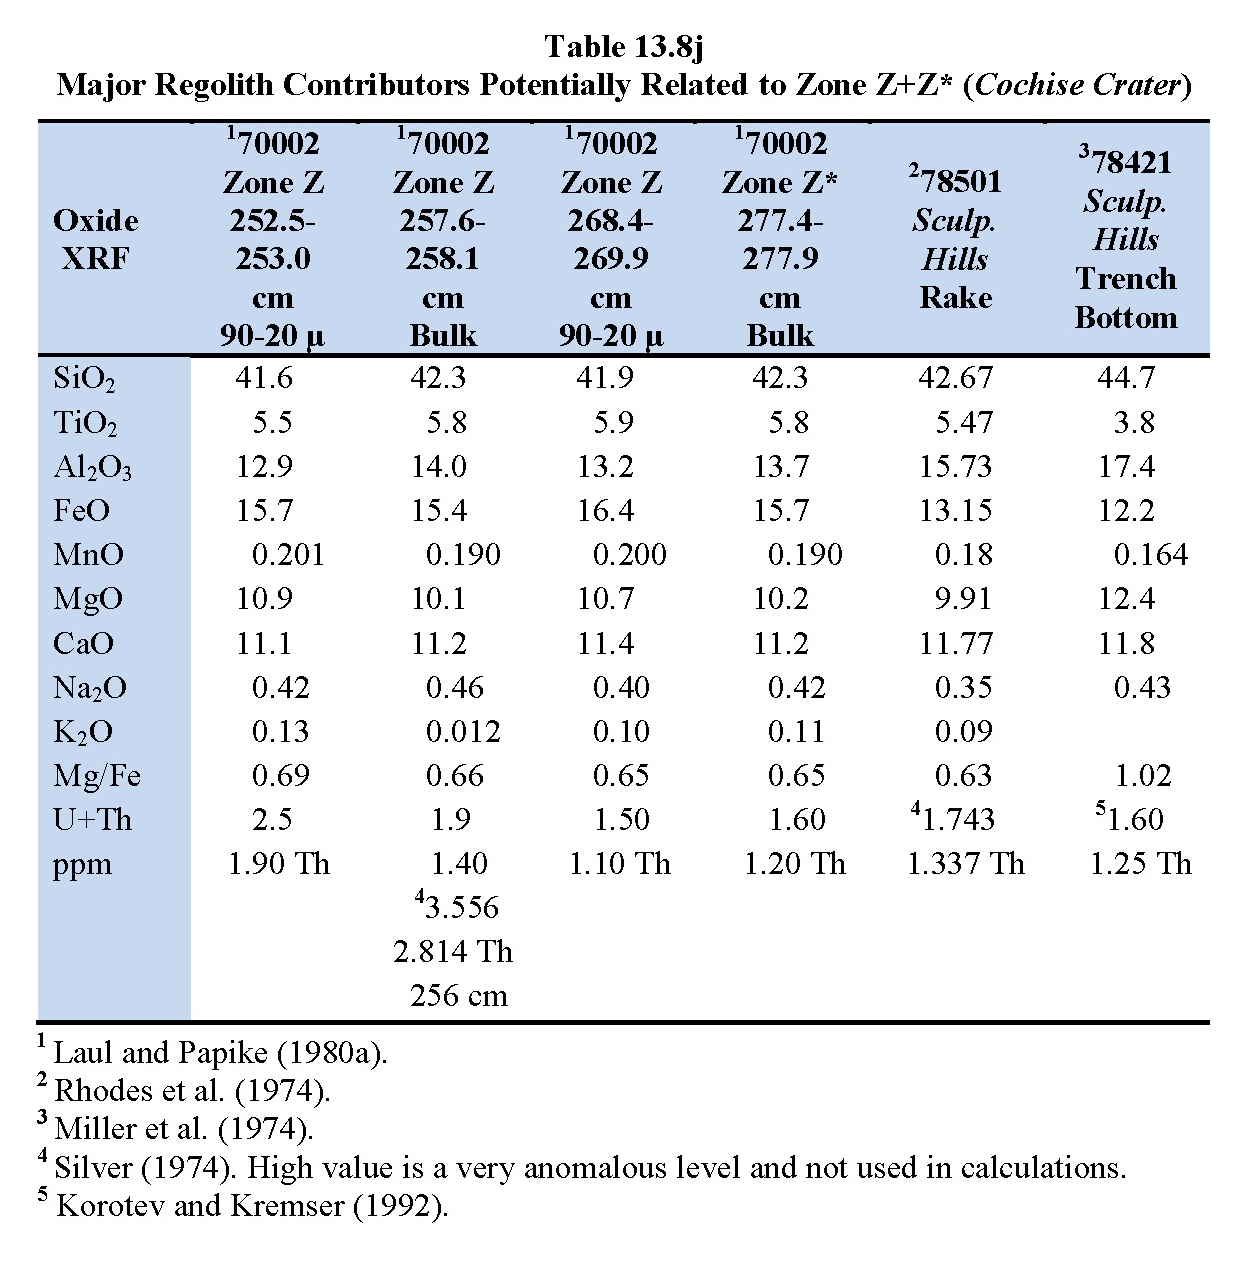
Links for Laul and Papike. (1980a), Rhodes et al. (1974), Miller et al. (1974), Silver (1974), Korotev and Kremser (1992).
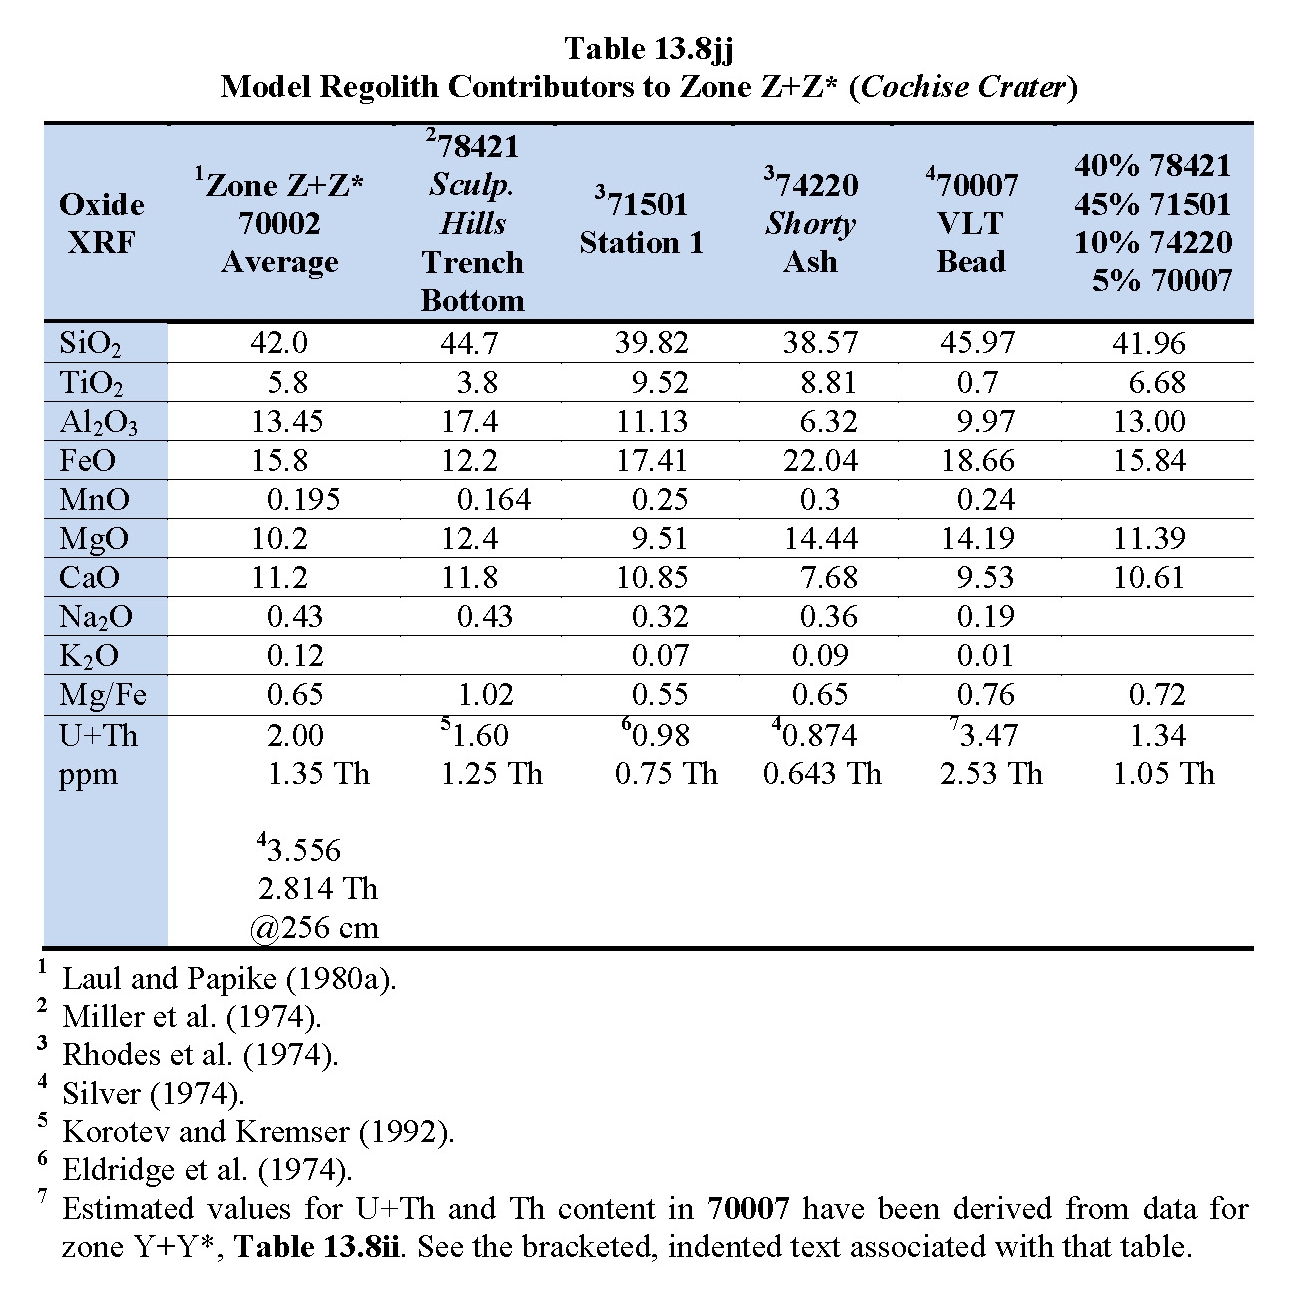
Links for Laul and Papike. (1980a), Rhodes et al. (1974), Miller et al. (1974), Silver (1974), Korotev and Kremser (1992), Eldridge et al. (1974) and Table 13.8ii.11. Zone Z**: 285.65-294+ cm (8.35+ cm) (Shakespeare Crater): Although reported Is/FeO values are not available below 285.65 cm in the deep drill core, Zone Z** is distinguished from zone Z+Z* primarily on the basis of a significantly lower original Is/FeOm (~40 vs. ~50). Only the top 8.35 cm of zone Z** is present at the bottom of the core; however, Fig. 13.8↑ indicates that for source crater Shakespeare, at a distance of 1.4 km from the core site, the total thickness of zone Z** would be close to 8 cm.
The composition of zone Z**’s regolith ejecta (Table 13.8k↓) closely resembles that of the average for zone Z+Z* (Table 13.8j↑). Shakespeare Crater appears to be zone Z**’s source crater and, as Shakespeare lies only ~2 km west of Cochise Crater this similarity would be expected, particularly if the pre-impact regolith included material from a Sculptured Hills avalanche. Table 13.8kk↓ shows a reasonable match with the zone Z** average composition by 55% 78421 (Sculptured Hills trench), 35% 71501 (Station 1 rake sample), and 10% 74220 (Shorty Crater ash).
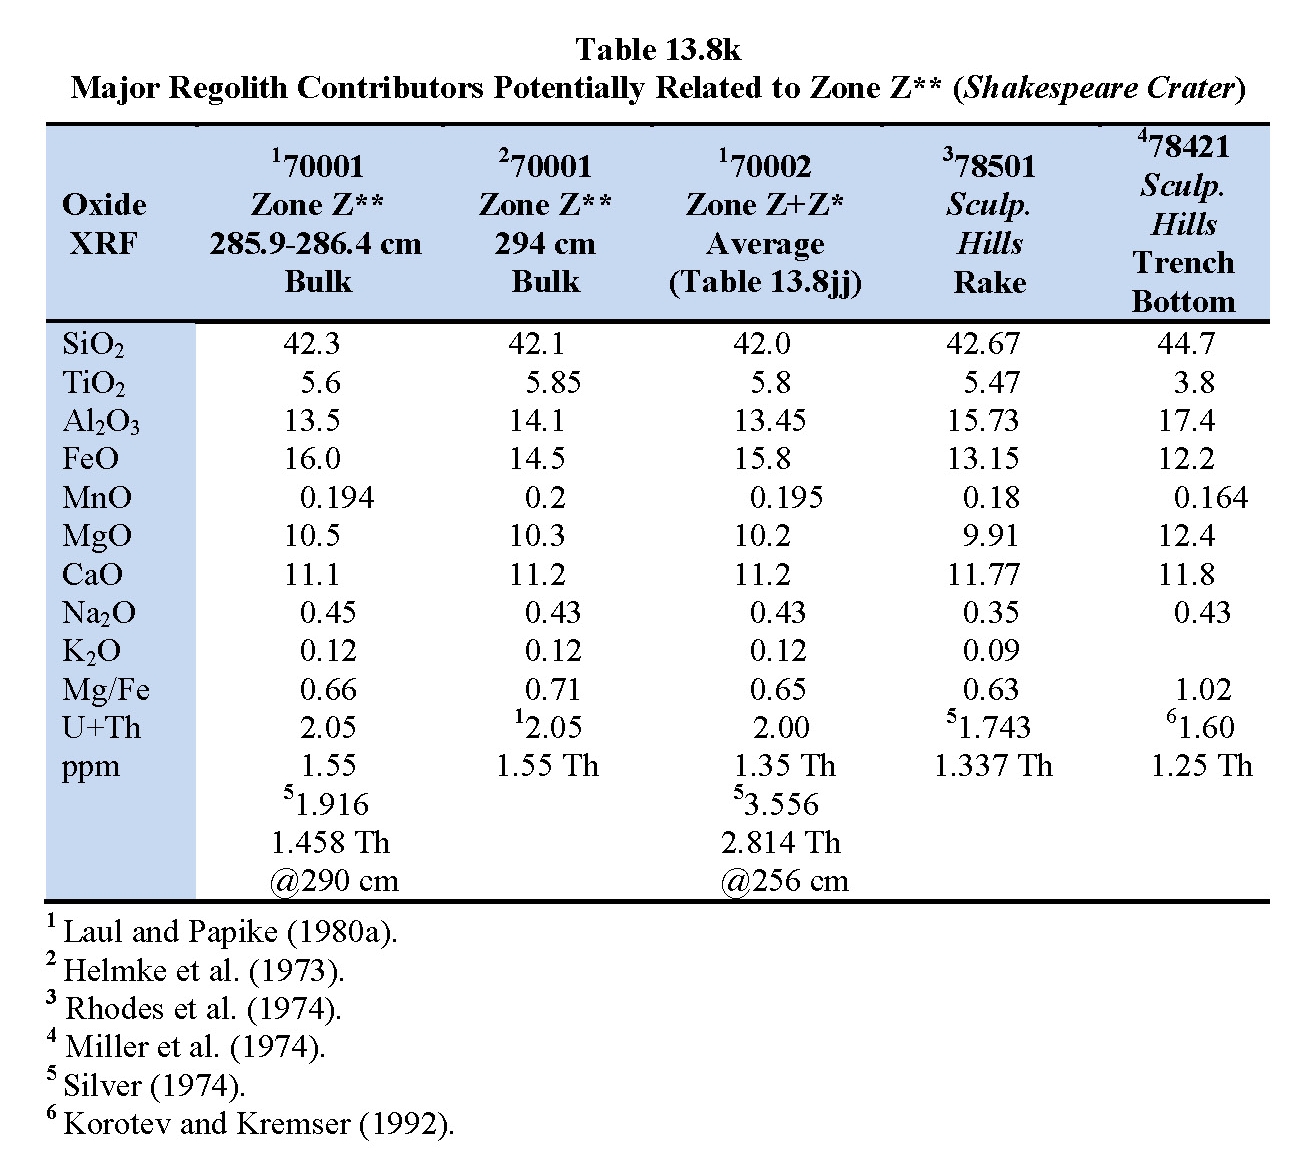
Links for Laul and Papike. (1980a), Helmke et al. (1973), Rhodes et al. (1974), Miller et al. (1974), Silver (1974), and Korotev and Kremser (1992).

Links for Helmke et al. (1973), Rhodes et al. (1974), Miller et al. (1974), Korotev and Kremser (1992), Eldridge et al. (1974), and Silver (1974).6.0 ∆Is/FeO-Based Ages of Source Crater Impacts and Zone Deposition
6.1 Introduction
The preceding stratigraphic synthesis of data related to the Apollo 17 deep drill core indicates that impacts resulting in 400-800 m diameter craters, and larger, have transported large quantities of regolith many crater diameters from their impact points to the inter-crater deep drill core site. This process has created a stratified, inter-crater accumulation of material representative of many previous such accumulations elsewhere in the valley. Each mass of regolith ejecta has been largely homogenized during transport, due to ballistic and internal volatile turbulence (§3.0) before being deposited as integrated new strata or zones that now comprise the inter-crater regolith sampled by the core.
The mixing of the pre-impact, also stratified regolith ejecta results in each new ejecta deposit’s composition and cosmic ray exposure values being essentially uniform throughout the newly deposited zone. As discussed in §3.0 and §4.0 the homogenization largely may have been confined to the fine size fractions of the ejected regolith; however, the size-frequency analyses reported in Graf (1993) show that about 75-80% of the mass of regolith ejecta zones is in the less than 150 µ fractions.
As discussed previously in §3.0, there exist 14, clearly definable, 400-800 m diameter craters in the Taurus-Littrow area, and one 1400 m diameter crater, ejected regolith from which could potentially reach the inter-crater location of the deep drill core (Fig. 13.1a↑, Fig. 13.1b↑; Fig. 13.5↑). Based on relative age, composition and thickness of their regolth ejecta in the core, 11 of these potential source craters have been identified with reasonable certainty as being associated with the 11 specifically defined zones in the core. After deposition, the regolith ejecta zones were each exposed at the lunar surface for long periods of time as indicated by the accumulation of significant evidence of total post-deposition maturation (Fig. 13.1c↑, Fig. 13.2↑, Fig. 13.3a↑, Fig. 13.3b↑).
If the post-deposition exposure ages of each regolith ejecta zone in the deep drill core can be calculated, their cumulative totals will date each of the 10 complete zones and their correlated impacts, as well as the total time of accumulation of material in the core down to 2.85 m. Comparison of the time for core deposition with the age of the youngest ilmenite basalt eruption (3.82 Ga) will provide an estimate of the total depth of local regolith. Cosmic ray exposure ages (Eberhardt et al., 1974) obtained from samples along the length of the core and on control sample 70180, however, cannot be used to estimate the post-deposition exposure ages of regolith ejecta zones as these cosmic ray data would include pre-source crater exposures.
6.2 Nitrogen Isotopic Ratios in the Deep Drill Core
6.2.1 Introduction
Early in this synthesis of Apollo 17 data from Taurus-Littrow, an initial review of nitrogen isotopic data for the deep drill core (Thiemens and Clayton, 1980), relative to reported maturity indices (Morris et al., 1979), indicated that the maturation energy of solar wind protons increased before the deposition and exposure of regolith ejecta zones S and T (Schmitt, 2019b). Further consideration of this relationship has emphasized the importance of this increase in solar wind energy in employing ∆Is/FeO values to estimate the deposition and exposure ages of deep drill core regolith ejecta zones.
In the 1960s, E. M. Shoemaker (pers. comm.) hypothesized that development of the lunar regolith over time has recorded the history of the Sun. The inclusion of core tubes on Apollo missions beginning with Apollo 11 (Apollo Field Geology Experiment with Shoemaker, G. A. Swann, and W. R. Muehlberger as Principle Investigators) was motivated, in large part, by this hypothesis. It is now clear that some of the Sun’s history is written in the systematics of isotopes delivered to the Moon by the solar wind. Beginning in the early 1970s, measurements of isotopic ratios began to provide insights into a variety of solar wind questions.
Only after Apollo 11 returned lunar samples was it confirmed that the concentrations of solar wind volatiles retained in the lunar regolith, particularly hydrogen, nitrogen and helium, constituted large potential resources for use in space and, in the case of the light isotope of helium, 3He, a resource with many potential applications on Earth (Wittenberg et al., 1986; Schmitt, 2006).
6.2.2 Detailed Relationships Between ∆Is/FeO and δ15N‰ in the Deep Drill Core
Nitrogen constitutes one of the most abundant solar wind volatiles in lunar regolith (>200 ppm) (Heiken et al., 1992). To study nitrogen’s isotopic variability in the lunar regolith, Thiemens and Clayton (1980) measured δ15N‰ values at points within 8 of the 11 defined regolith zones in the deep drill core (Table 13.9, Column 5). Plotting these δ15N‰ values against the zone’s ∆Is/FeO (Fig. 13.12a↓) shows a direct and tightly controlled isotopic mixing trend that correlates δ15N‰ with ∆Is/FeO values in the 5 oldest zones (W* to Z+Z*). Along this mixing trend, δ15N‰ decreases with increasing ∆Is/FeO along a slope of about –0.77‰ per ∆Is/FeO, indicating that fractionation loss of 14N vs. 15N due to maturation was taking place relative to a solar wind reservoir of very negative δ15N‰ values. (Fig. 13.12b↓ shows the Is/FeO-based deposition ages (Table 13.15↓) of zones plotted in Fig. 13.12a↓ that will be derived in §6.4 and §7.3.) This mixing trend extrapolates back to zero ∆Is/FeO at δ15N‰ = +80‰ (15N-rich); however, the extrapolation of this trend to higher values of ∆Is/FeO indicates that solar wind δ15N‰ at the time of zone deposition of the plotted zones was <<–170‰ and, as discussed below in §13.4, probably <–200‰ (very 15N-poor). It would appear from these data that, until about 0.514 Ga, the Sun was producing little or no 15N.

Link forThiemens and Clayton (1980).Although the local regoliths ejected by their source crater impacts would have already begun equilibration with the extant, highly negative δ15N‰ solar wind, additional exposure to fractionation subsequent to deposition at the deep drill core site continued to drive their individual δ15N‰ numbers toward increasingly higher values.
[The δ15N‰ = +80‰ at zero ∆Is/FeO in Fig. 13.12a↓ probably indicates that the lunar magma ocean from which the crustal units represented in Taurus-Littrow were derived had a similarly high positive δ15N‰ value. That value probably is a combination of an inherited accretionary value and thermal fractionation during the active lifetime of the magma ocean.]
 Fig. 13.12a. Plot of δ15N‰ vs. ∆Is/FeO at the point of analysis in deep drill core that shows older zones W to Z+Z* have a fractionation trend from negative to positive (δ15N‰ / (∆Is/FeO) = –0.77‰). An increase in solar production of 15N is shown by a trend line (green) from zone W* to –118‰ that also includes zones U, V+V*.and T+T*.
 Fig. 13.12b. Previous Fig. 13.12a with added zone deposition ages from Table 13.15↓, §7.3.
The positions of zones V+V*, U, and possibly T+T* in Fig. 13.10a↑, when combined with the two youngest of the five oldest zones (W* and W), suggest a major change in the solar wind’s δ15N‰ toward higher values after zone W* deposition at ~0.514 Ga and prior to zone W’s deposition at ~0.394 Ga. At ∆Is/FeO = 0, Fig. 13.10b↑ shows that a W*+W-V+V*-U-T+T* trend line (green) suggests a value for δ15N‰ of about –118‰ for the post-zone W* solar wind and implies that 15N content had increased.
The indicated increase in the solar wind’s δ15N‰ after ~0.514 Ga, that is, an increase in 15N production, may have been associated with an increase in energy production in the Sun that, in turn, may have been the major contributor to warming associated with the Earth’s Cambrian Explosion of ocean life initiated about 0.538 Ga (Whittington, 1985; Gould, 1989; Maloof et al., 2010). The difference of ~26 Myr is probably within the error limits in this synthesis of deposition ages for deep drill core regolith ejecta zones. In fact, the start of the Cambrian Explosion at 0.538 Ga may provide a calibration point for the deposition ages given in Table 13.15↓, that is, zone W* may have been deposited prior to 0.538 Ga rather than at about 0.514 Ga.
The question remains as to whether the two phenomena recorded on the Moon and the Earth actually are physically related. It also would be of important to know if the physics of solar evolution is consistent with changes indicated by lunar nitrogen isotopic variations.
6.2.3 Second Change in the Energy of the Solar Wind Late in Lunar History
When the available δ15N‰ / ∆Is/FeO values of surface regolith samples (red points in Fig. 13.13↓) are plotted, the general elongate area in which they fall incorporates deep drill zones S and T+T* to give a isotope fractionation trend line consistent with a current solar wind δ15N‰ value of about –118‰. This red fractionation trend has a slope of negative to positive δ15N‰ trend of about +3.00‰ / ∆Is/FeO.
 Fig. 13.13. Fig. 13.12a↑ (black circles, o) with surface sample δ15N‰ vs. Is/FeO data plotted (red circles, o) that correlate with younger zones S and T+T* to show a fractionation trend that intersects δ15N‰ at about –118‰ at zero ∆Is/FeO. This fractionation trend has a slope of from negative to positive δ15N‰ of about +3.00‰ / ∆Is/FeO.
The additional surface regolith samples, their data sources, and δ15N‰ values plotted in Fig. 13.13 are as follows (Is/FeO values from Morris, 1978):
1. 70011 (Becker and Clayton, 1977; Norris et al., 1983; Petrowski et al., 1974)
♦ Is/FeO = 54; δ15N‰ = +27
2. 71501 (Petrowski et al., 1974; Frick et al., 1988)
♦ Is/FeO = 35; δ15N‰ = +25.4 (Ave. of +26.0 and +24.7)
3. 72501 (Norris et al., 1983)
♦ Is/FeO = 81; δ15N‰ = +63
4. 72701 (Petrowski et al., 1974)
♦ Is/FeO = 61; δ15N‰ = +0
5. 73121 (Becker, 1980)
♦ Is/FeO = 78; δ15N‰ = +9
6. 75061 (Becker and Clayton, 1975; Norris et al., 1983; Petrowski et al., 1974)
♦ Is/FeO = 33; δ15N‰ = +33.4
7. 75081 (Norris et al., 1983; Becker, 1980😉
♦ Is/FeO = 40; δ15N‰ = +45
8. 76240 (Norris et al., 1983)
♦ Is/FeO = 56; δ15N‰ = +34
9. 76501 (Becker and Clayton, 1975)
♦ Is/FeO = 51; δ15N‰ = +29.2
10. 78501 (Becker and Clayton, 1975)
♦ Is/FeO = 36; δ15N‰ = -6.1
(Underlined data source is that chosen for δ15N‰ values based on the present author’s judgment where more than one such source is available.)
[The close correlation of the surface sample trend with zones S and T indicate that Morris’s (1978) reported Is/FeO values are very close to their true ∆Is/FeO values. The scatter in the surface sample plots in part is due to variations in the amount of geologically recent partial resets of Is/FeO by nearby small impacts, as well as the extensive resets of Is/FeO at deposition by the source crater impacts (see §8.0.)]
Sometime after the deposition of zone U (~0.197 Ga), the energy of the solar wind increased again, but with no change in its embedded δ15N‰ value, so that a new isotope fractionation trend of δ15N‰ vs. ∆Is/FeO (red trend) was established. This new trend includes data from zones S and T as well as all analyzed regolith surface samples. It is likely that any terrestrial effect of this increase in solar wind energy began prior to 0.096 Ga, the deposition age of zone T+T*. If the change in slope between the red and green δ15N‰ vs. ∆Is/FeO trends in Fig. 13.13↑ is used as a measure of the change in solar wind maturation energy, the increase was by a factor of ~3.4 (3.00 / 0.88). As internal alpha+beta particle maturation effects would be nearly constant during this period, this increase in maturation energy would be related to the solar wind.
The correlations discussed in this section may be the first confirmation that the lunar regolith records the history of the Sun, as predicted by E. M. Shoemaker in the early 1960s (pers. comm.).
The close match of the measured δ15N‰ and ∆Is/FeO values to the black, green and red trend lines for regolith ejecta zones in Fig. 13.13↑ indicates highly efficient, post-ejection, isotopically proportional loss of solar wind nitrogen in the regolith ejecta sheaths. Otherwise, a significantly greater scatter of the plotted points would be expected. This process of isotopic fractionation by volatilization may be attributed in part to ballistic and volatile turbulence in impact ejecta sheaths discussed in §3.3 as well as to continuous gardening during zone exposure.
6.3 Solar Proton and Uranium+Thorium Alpha+Beta Decay Particles Contributions to ∆Is/FeO / Myr
6.3.1 Introduction
Through most of the six decades after lunar regolith was first closely examined by Surveyor III’s camera and trenching tool (Shoemaker et al., 1967), the main agents of its development and maturation over time were considered to be macro- and micro-meteor impacts and solar wind proton radiation. The development of a means to quantitatively measure a maturity index, or Is/FeO (Morris et al., 1975; Morris, 1976), the abundance of impact produced agglutinitic glass in Apollo 11 regolith samples (Duke et al., 1970; McKay et al., 1970), and the discovery of glassy patinas on regolith grains that contained nano-phase iron particles (Taylor, 1988) were initially consistent with these ideas.
The synthesis of Apollo 17 data presented here has added several amendments to this paradigm, particularly with respect to (1) the formation of nano-phase iron by alpha+beta particle radiation from uranium and thorium decay, (2) the importance of micro- and small macro-impacts in continuously commutating and mixing regolith ejecta zones during their long periods of exposure at the surface, and (3) the resistance to increases in Is/FeO values (maturation) arising from the presence of volcanic glass and oxide minerals, particularly ilmenite. The effects of volcanic glass and possibly oxide minerals will be discussed in §7.0.
[The extremely high temperatures generated at the impact points of micro-meteors in a hydrogen-rich, reducing environment may or may not be a significant factor by themselves in the creation of nano-phase iron and increases in Is/FeO values. No direct evidence of this happening has been discovered during this synthesis, however, as said in forensic investigations, “the absence of evidence does not mean the absence of guilt.” The intimate association of glass patinas with nano-phase iron on regolith particles (Taylor, 1988; Taylor et al., 2005; Burgess and Stroud, 2018) does not eliminate a mixing of glass deposited by solar wind sputtering with micro-meteor impacts along with simultaneous reduction of Fe++ by both processes. The presence of apparent fine-scale layering in the patinas suggest the occurrence of pulses of glass with nano-phase iron deposition, as would be expected if impacts are involved along with solar flares and coronal mass ejections (CME) rather than just a “steady” low energy solar wind. An investigation of the impact glass in and around micro-meteor craters on exposed rock surfaces (”zap pits’) might provide evidence of this mixing of the effects of sputtering and impacts. On the other hand, there is strong evidence that impacts partially reset Is/FeO values (§4.2) by affecting the ferromagnetic resonance (Is) of previously formed nano-phase iron particles. Impact induced resets, however, could be associated with simultaneous plasma formation of new nano-phase iron. In following discussions of “solar proton-only” production of nano-phase iron, as that is directly related to surface exposure, solar proton increases in ∆Is/FeO will be assumed to include any increases in ∆Is/FeO resulting from similarly surface exposure associated impacts. No method of quantitatively separating the two contributions from the total of measured ∆Is/FeO has been discovered.
Micro-meteor impacts are very important in the formation of glassy agglutinates and, as discussed, in partial resetting of Is/FeO values (§3.2.1 and §4.0), respectively. As documented in §4.0, the shock and/or heat generated at the point of impact partially resets the “Is” values in Is/FeO indices. It is conceivable that oxidation of nano-phase iron by oxygen-rich plasmas contributes to Is/FeO resets.
Further, micro-meteor impacts are very important in the gradual generation and continued comminution and mixing of regolith (gardening), a process that maintains alpha+beta particle access to Fe++.]
6.3.2 Alpha+Beta-only ∆Is/FeO / Myr
Silver (1974), Laul et al. (1978, 1979, 1981), Meyer (2012) and others have documented the presence of significant quantities of uranium and thorium (1-3.9 ppm). in Apollo 17’s deep drill core regolith zones. Isotopes of 238U, 235U and 232Th emit alpha and beta particles as they undergo radio-isotopic decay. Further, Bower et al. (2015) have shown that alpha+beta radiation from uranium and thorium in zircon inclusions in biotite reduces Fe++ and Fe+++ to Fe°, that is, to nano-phase iron.
Current uranium and thorium contents in the deep drill core zones, plotted against ∆Is/FeO (Fig. 13.14), indicates a linear relationship with increasing U and Th. This confirms thaturanium and thorium decay particles play a significant role in regolith maturation.
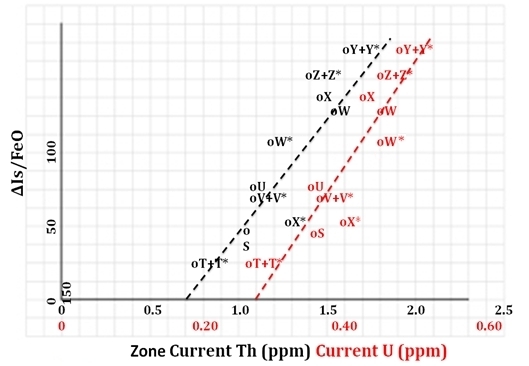 Fig. 13.14. Relationship between ∆Is/FeO and current uranium (red cricles, o) and thorium (black circles, o) content of deep drill core regolith ejecta zones. The slopes of both these trends will decrease when higher Th and U values at the mean age of zone exposure are considered.
The continuous, although gradually decreasing, effect of 238U and 232Th alpha decay on nano-phase iron production in surface regolith would be present through most of the history of the Moon. Finally, the energy levels for alpha particles from 238U and 232Th (4.196 MeV and 12 MeV, respectively) are routinely much higher than for protons in the continuous solar wind (0.5-0.3 x 10⁻³ MeV); however, during solar energetic particle (SEP) events, solar wind protons reach energy levels of 10 x 10-3 MeV to ~10 GeV (Reames, 2021).
The relevant half-life and energy constants related alpha+beta decay of uranium and thorium are as follows (Dragoset (NIST), 2001):
♦ 238U half-life = 4.47 Byr with 4.196 MeV alpha+beta particles,
♦ 235U half-life = 2.45 Byr with 4.776 MeV alpha+beta particles;
♦ 232Th half-life = 14 Byr with 12 MeV alpha+beta particles.
The ratio 238U / 235U = ~138 in chondrites (Brennecka et al., 2010a), so the dominant source of alpha+beta particles in the regolith ejecta zones is from uranium is 238U. The lunar regolith thorium/uranium ratio is between 3.1 and 3.8 (Silver, 1974), and, even though 232Th has over 3 times the half-life of 238U, the higher energy alpha particles from thorium will be more deeply penetrating than those from 238U. Bower et al. (2015), Nasdale et al. (2006), and others report that alphas from uranium and thorium decay penetrate 30-50 µ into the hydrous silicates studied (biotite, cordierite, chlorite).
Alpha+beta particle penetration is also a function of the density of the target. Although the specific gravity of the regolith is ~1.9 g/cm3 vs. 1.5-3.3 for the minerals studied by Bower et al. and Nasdale et al., the specific gravity of the individual silicate particles in the regolith are comparable to those studied. With the emitters being in vacuum, it is reasonable to consider 30-50 µ to be the penetration range for alpha particles emitted in the regolith. For perspective, 30-50 µ is roughly the thickness of the glassy patinas on regolith particles.
The radiation effects noted in terrestrial silicate minerals surrounding alpha+beta emitters (zircon, monazite, etc.) show discrete color variations as function of distance from the emitter (i.e., pleochoric halos), reflecting the specific differences in particle energies in the two decay chains. In the case of the lunar regolith, however, impact gardening (macro- and micro-meteor mixing) will produce a relatively uniform distribution of these energy variations. These considerations suggest that the concentrations of uranium and thorium (U+Th) can be combined as a proxy for alpha+beta particle induced increases in Is/FeO.
The above discussion and related figures do not take into account the other necessary component of alpha+beta particle maturation, namely the amount of the target Fe++ available within 30-50 µ. Table 13.10 gives the FeO content of the various zones as related to Th content. Normalizing Th content to FeO and plotting against ∆Is/FeO is shown in Fig. 13.15↓.
The relatively tight trend for the zones plotted in Fig. 13.15↓ further indicates that increases in ∆Is/FeO track increases in Th contents of zones, and by inference, track U+Th, as well. Additionally, the intercept of Th/FeO = ~0.035 at ∆Is/FeO equal zero indicates that, at Th/FeO values below ~0.035, Th-related alpha particle contributions to ∆Is/FeO cease. It is not clear why this would be the case, but there are no regolith samples from Taurus-Littrow with reported Th/FeO values lower than 0.035 that would confirm such a conclusion.
 Fig. 13.15. Relationship between current thorium content, normalized to zone FeO content, and alpha+beta-only ΔIs/FeO. (Table 13.10↑).
A straightforward means of calculating the alpha+beta-only contribution to the total value of ∆Is/FeO/Myr in lunar regolith is provided by samples related to the large boulder of impact melt-breccia investigated at Station 6. This boulder, originally about 18×10×6 m in size (Wolfe et al., 1981), had come from an identified location on the slope of the North Massif. Shaken loose by an impact or seismic event, the boulder had bounced rather than rolled about 1.5 km down the slope, leaving a track of shallow craters until it came to rest at a point where the slope changed from about 26º to about 11º (Lunar QuickMap). At its last impact, the boulder broke into 5 fragments (Figs. 13.16a,b), with Fragment 4 creating a continuous shadow over regolith splashed from the last impact. Cosmic ray exposure ages from the abraded surfaces of the boulder range between 17 and 22 Myr (Corzaz et al., 1974; Turner and Cadogan, 1975; Cadogan and Turner, 1976), with the average being about 19.5 Myr. This average gives a good estimate of the age for the boulder’s arrival at the base of the North Massif.
Given the above considerations, a sample pair from Station 6 also provides a means to estimate a value alpha+beta-only ∆Is/FeO/Myr. This sample pair (Fig. 13.16a↓, Fig. 13.16b↓) is shaded 76240 (Is/FeO = 56, U+Th = 2.801 ppm (Silver, 1974)) and splash buried 76280 (Is/FeO = 45, U+Th = 1.83 ppm (Meyer, 2012)), both removed from solar proton exposure at ~19.5 Myr. Using the following relationship:
∆Is/FeOR (2.80 ppm) (19.5 Myr) – ∆Is/FeOR (1.83 ppm) (19.5 Myr) = 11
(where ∆Is/FeOR is ∆Is/FeO / Myr / ppm U+Th),
a value for alpha+beta-only ∆Is/FeO per ppm U+Th per Myr can be calculated.
Solving for ∆Is/FeOR, gives ∆Is/FeO / Myr / ppm U+Th = 0.58.
Unfortunately, no other appropriate pair of shaded or buried samples was obtained that independently would verify the above value of ∆Is/FeO / ppm U+Th = 0.58.
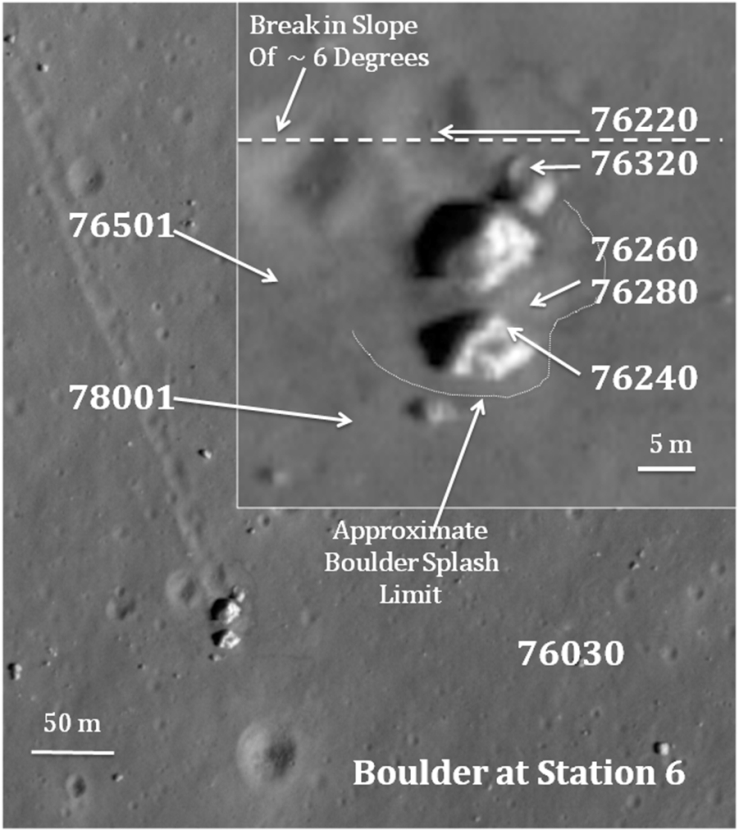 Fig. 13.16a. Plan view of Station 6 boulders and craters, showing location of samples referred to in the text (after Le Mouélic et al., 2024).
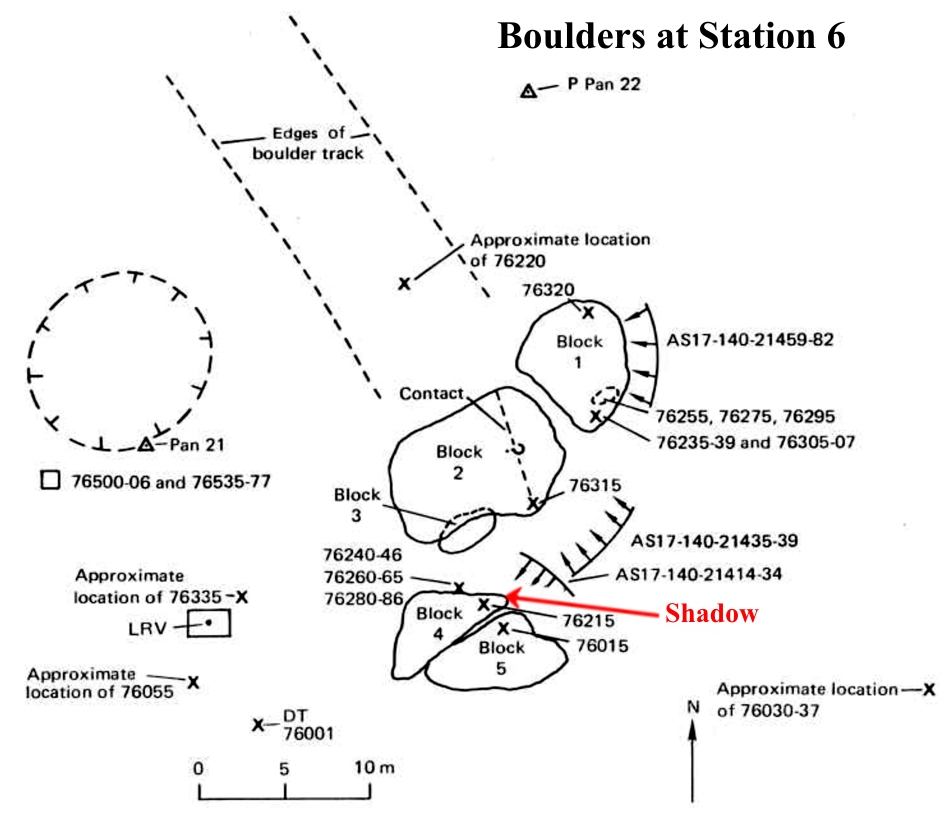 Fig. 13.16b. Plan view sketch of Station 6 boulders, showing boulder fragment designations and location of samples referred to in the text as well as photograph locations (after Wolfe et al., 1981).
6.3.3 Solar Proton and Impact Plasma ∆Is/FeO / Myr
At the initiation of this synthesis of field, photographic and analytical data related to the regolith present in the valley of Taurus-Littrow, it generally had been concluded (Taylor et al., 2001a; Morris, 1978; Pieters et al., 2010) that, in addition to meteor and cometary impact gardening processes, the major factor in the maturation of lunar regolith was the flux of the solar wind protons (H+) at energies reaching 1 × 10⁻³ MeV to ~10 GeV for flares and mass ejections (Reames, 2021). Indeed, the existence of npºFe (nano-phase iron) in thin patinas of alumina-silicate glass on regolith particles (Taylor, 1988) appeared to document the solar wind effect. As discussed in the bracketed text in §6.3.2, “solar wind proton-only” ∆Is/FeO would include contributions resulting from micro-meteor impact generated plasmas.
The samples from Station 6 (Fig. 13.16a↑, Fig. 13.16b↑) also provide a means of calculating the solar proton-only contribution to the total value of ∆Is/FeO / Myr. A 10-point difference between the Is/FeO (Morris, 1978) of the sunlit regolith 76220 (Is/FeO = 66) from the floor of the next to last shallow impact crater caused by the boulder and the Is/FeO of the nearly simultaneously shadowed sample 76240 (Is/FeO = 56), from under Fragement 4 is a measure of the total ∆Is/FeO / Myr. U+Th for sunlit 76220 equals 2.10 ppm (Korotev et al., 1992) and for shadowed sample 76240 equals 2.80 (Silver, 1974). The 19.5 Myr maturation relationship between samples 76240 and sunlit 76220 can be expressed as follows:
(∆Is/FeOA / Myr) (76240 U+Th) (19.5 Myr ) – [(∆Is/FeOA / Myr (76220 U+Th) (19.5 Myr) + (∆Is/FeOP / Myr) (19.5)] = 10
where subscript “A” is for “alpha+beta” and subscript “P” is for “proton” and (∆Is/FeOA / Myr / U+Th) = 0.58 from §6.2, above.
Solving for ∆Is/FeOP / Myr:
0.58 × 2.80 × 19.5 – [0.58 × 2.10 × 19.5] + (∆Is/FeOP / Myr) × 19.5 = 10
31.7 – [23.8 + (∆Is/FeOP / Myr)] × 19.5 = 10
– 23.8 – (∆Is/FeOP / Myr) × 19.5 = 10 – 31.7
– ∆Is/FeOP / Myr = (10 – 31.7 + 23.8) /19.5
∆Is/FeOP / Myr = 0.11
The indication in Fig. 13.13↑ of §6.2.3 of a close correlation between greater ∆Is/FeO and greater fractionation of 14N relative to 15N suggests that this is the result of an increase in the average energy of the solar wind and/or an increase in the energies or frequencies of major solar events. Such an increase likely is due to an increase in proton flux rather than an increase in the energy of the individual protons, as an increased proton flux would produce more interactions with embedded nitrogen. It is concluded here, therefore, that solar proton-only ∆Is/FeO / Myr for zones U through Z+Z* is about 0.032.
[Two other boulders (data from Meyer, 2012) provided potential opportunities to test the above solar proton-only value of ∆Is/FeO/Myr = 0.11, namely, Boulder 3 at Station 2 and the norite boulder at Station 8. Samples from beneath both these boulders were obtained (72441 and 72461 from Boulder 3 at Station 2 and 78221 from the norite boulder at Station 8). Pairing of ∆Is/FeO values of these covered samples with those of local sunlit regolith is possible, however, post-arrival cosmic ray exposure ages for neither boulder are available. A cosmic ray exposure age for Boulder 3 at Station 2 (72414 or 72435) has not been reported and that reported for the norite in the boulder at Station 8 (78235) is 292 ± 14 Myr is not compatible with an ∆Is/FeO = 12 for the covered vs. sunlit sample pairing (78221 vs. 78231). The 292 ± 14 Myr exposure age for the impact glass-covered norite boulder must reflect exposure on the Sculptured Hills prior to its arrival near Station 8. An exposure age for the impact glass covering the norite would be useful in this regard.
Pairing covered samples 72441 and 72461 (having similar U+Th contents near 3.8 ppm), with an average Is/FeO = 69.5, with sunlit rake sample 72501 (Is/FeO = 81) gives a ∆Is/FeO = 11.5. With a combined ∆Is/FeO/Myr = 2.31 (ΔIs/FeO/Myr/ppm = 0.58 × 3.8 ppm = 2.20 + 0.11), the exposure age (roll age) of Boulder 3 at Station 2 would be ~5 Myr (11.5/2.31). A similar comparison between buried 78221 and sunlit 78421 (∆Is/FeO = 1 / 1.04 + 0.11) suggests that the norite boulder arrived at Station 8 less than one million years ago.]
Buried sample 76280 (Is/FeO = 45, U+Th = 1.83 ppm) and sunlit sample 76030 (Is/FeO = 64, U+Th = 1.83 ppm) obtained at Station 6 (Fig. 13.16a↑, Fig. 13.16b↑) provide a possible check on this calculation of solar proton-only and alpha+beta-only ∆Is/FeO/Myr = 0.11 and 0.58/ppm, respectively. There is a 19-point difference (64 – 45) in the Is/FeO values between the two samples. The combined ∆Is/FeO / Myr = 1.17 (0.58 × 1.83 + 0.11) and that value times 19.5 Myr gives a predicted ∆Is/FeO = 22.8 vs. the measured 19. This is a fairly good check on the two calculated ∆Is/FeO/Myr values, particularly when it is recognized that sunlit 76030 was taken from the surface of an open, ~11º slope where continued down-slope mass-wasting would have lowered its current Is/FeO with the introduction of younger regolith. Other slope samples that were not affected by the boulder’s arrival, indeed, have Is/FeO values less than the 64 for 76030, i.e., the Is/FeO for rake sample 76501 is 58 and the lowest value in core 76001 is 60.
6.3.4 Regolith Particle Patinas Possible Role in Attenuation of Proton-only ∆Is/FeO
The identification of 50-100 µ thick, low Fe++, alumino-silicate glass patinas on regolith particles (Taylor, 1988; Taylor et al., 2001b; Taylor et al., 2005; Burgess and Shroud, 2018; Cymes and Burgess, 2022; Cymes et al., 2022; and Li et al., 2022), containing nano-phase iron partiles and vesicles, but no structural Fe++, raised the possibility that solar proton maturation of regolith would be attenuated as the concentration of patina-covered particles increased. It is anticipated, however, that a steady state impact gardening environment in the regolith would prevent the development of this patina from completely coating most particles.
6.4 ∆Is/FeO Derived Exposure and Deposition Ages for Deep Drill Core Zones
6.4.1 Introduction
A major objective of this synthesis of data related to the geology of Taurus-Littrow is the determination of the exposure ages and, by summation, the deposition ages of the regolith ejecta zones in the deep drill core. This, in turn, would date the impacts that formed their 400-1400 m diameter source craters and would allow a graphical correlation between source crater’s diameter to depth ratios (a measure of relative age) and their total, post-impact exposure.
Many craters less than 400 m in diameter would have contributed ejecta to the deep drill core; however, close examination of the raw Is/FeO data reported in §4.0 and in Table 13.1a↑ indicate that the larger craters are the primary sources of regolith ejecta deposited in inter-crater areas. The focus here, therefore, will be on identified source craters 400-800 m in diameter as well as the ~1451 m diameter, MOCR Crater.
The two preceding sections (§6.3.2 and §6.2.4, respectively) used Apollo 17 pairs of samples to make ∆Is/FeO / Myr estimates for (1) alpha+beta-only ∆Is/FeO / Myr = 0.58 / ppm U+Th for all zones and (2) solar proton and impact plasma ∆Is/FeO / Myr = 0.11 for zones S and T and ∆Is/FeO / Myr = 0.032 for zones U through Z+Z*. Table 13.11↓ combines these ∆Is/FeO / Myr values, ∆Is/FeO values from Table 13.1a, current U+Th contents, and a linear extrapolation of U+Th contents at each zone’s mean age of exposure to calculate estimates of zone exposure ages. The impact ages for each zone’s source crater (zone’s deposition age) are provided by the summation of preceding zones’ exposure ages, including that of the zone in question. In making the age estimates given in Column 7 of Table 13.11, an initial iterative step was made using current U+Th contents in order to calculate a preliminary exposure “age” for each zone (Column 5). This preliminary “age” was then used to obtain a better estimate the mean age of exposure for each zone. This latter mean age estimate, in turn, was used to calculate estimates of mean U+Th values that account for uranium and thorium alpha+beta decay and that then were used to improve the estimate of total ∆Is/FeO / Myr of the zone.

Links for Silver (1974) and Meyer (2012).[Note: To preserve the methodology for developing Table 13.11, conclusions related to it can be found after Table 13.15↓, §7.3. This has been done in order to account for small additions to exposure ages given in Table 13.15, totaling ~61 Myr for 10 zones, necessary to compensate for ∆Is/FeO attenuation of nano-phase iron production (decreased measured ∆Is/FeO values) due to the presence of pyroclastic glass and ilmenite+oxides in deep drill core zones.]
Another issue related to alpha+beta reduction of Fe++ as a contributor to ∆Is/FeO is the question of how long does that contribution continue after a given zone is buried. Once new regolith ejecta buries a previously deposited zone, effects of solar wind proton radiation, impact plasma generation, and small meteor impact mixing (gardening) ceases; however, the maturation effects of alpha+beta particle radiation from disseminated uranium and thorium would continue until all Fe++ within ~30-50 µ of alpha+beta particle sources has been converted to Fe° (nano-phase iron). Once gardening ceased and static conditions prevailed due to burial of each deep drill core zone, except surface zone S, the rate of Is/FeO increase would decline both due to shielding from solar protons and micro-meteor impact plasmas as well as the progressive conversion of nearby Fe++ to Fe° by alpha+beta particles. The question is “How significant is this post-burial maturation?”
5.5 MeV alpha particles from 238U have limited penetrating range, measured as ~50 µ in silicate glass for a density of ~2.5 g/cm3 (Harvard, 2022). 12 MeV alpha particles from 232Th will penetrate somewhat further. Nonetheless, some finite increase in ∆Is/FeO values will occur after burial, as it is likely that some Fe++ is within reach of the radiation. The absence of unusually high values of ∆Is/FeO for the deeper (older) portions of the deep drill core in Table 13.1a↑ shows that the effects of alpha+beta particle radiation ceases relatively soon once a regolith ejecta zone is buried.
Additionally, in the half-centimeter logging of deep drill core Is/FeO data provided by Morris (pers. comm.), the average increase in Is/FeO in buried zones’ top half-cm is 4.8 ± ~4 points. (This average does not include an increase of 18 points in a half-cm at the top of zone X that is apparently due to mixing with a more mature base of zone W*.) After applying each buried zone’s alpha+beta-only ∆Is/FeO / Myr (Table 13.11↑, Column 4) to each increase, the average increase in exposure age would be 5.2 ± ~4 Myr. As there are other unknowns, such as depositional mixing associated with burial, related to this top half-cm, this low possible effect of post-burial maturation is close to the estimated error limit of ~4% and is not considered to be significant.
As a further test of this conclusion, Table 13.12↓ shows estimates of a hypothetical post-burial increase in ∆Is/FeO, using the value of 0.58 for ∆Is/FeO / Myr / ppm U+Th derived above (5 times greater than that for proton and impact plasma ∆Is/FeO / Myr). The hypothetical added ∆Is/FeO values in Column 6 are increasingly unrealistically high as compared to the measured ∆Is/FeO in Column 2, indicating that post-burial maturation ceases significantly below the hypothetically added ∆Is/FeO = 13 for zone T+T*. This addition would be ~0.27 per cm (13 / 47 cm) for the zone. Within zone T+T*, there are 14 cm with a constant Is/FeO = ~10, whereas if alpha+beta maturation had continued at 0.27 per cm, it would be expected to see an additional increase of almost 4 Is/FeO points over that 14 cm core length and this is not present in the half-cm logged data. Post-burial alpha+beta particle ∆Is/FeOA effects would show a steady increase throughout that part of the zone of which there is no sign, unless it were coincidentally included in the previously discussed balance between impact resets and ∆Is/FeO increases (§3.0). Possibly even more illustrative is the fact that zone U’s Is/FeO steady stepwise decrease is from 53 to 12 (see Fig. 13.1c↑), while the hypothetical ∆Is/FeO post-burial increase would be 39 in Table 13.12.
The above approach to using sample derived ∆Is/FeO / Myr to estimate zone exposure ages seems logical; however, as a test of the exposure ages, they can be compared with the cosmic ray exposure ages determined by Eberhardt et al. (1974) for zones in the deep drill core. Before doing so, several detailed issues may need to be resolved before this ultimate goal can be reached. These issues include:
- How accurate is the core cosmic ray exposure data?
- How can the cosmic ray exposure of source crater pre-impact regolith be separated from that experienced post-deposition?
- How can ∆Is/FeO / Myr comparisons be made for zones W* and X* for which no cosmic ray exposure age is reported?
6.4.2 Evaluation of Deep Drill Core Cosmic Ray Exposure Ages
The determination in §6.2 that nitrogen isotopes in the deep drill core have been fractionated as a function of zone total maturity raised the possibility that noble gas isotopic fractionation might affect reported cosmic ray exposure age calculations. Further, as cosmic rays penetrate up to 40 ± 5 cm below the surface of the regolith (see Eugster et al., 1981a), depending on regolith density, a modest correction for some exposure age data will be required. Both these potential adjustments are examined below.
6.4.3 Potential Fractionation of Light Isotopes of Noble Gas Spallation Products During Regolith Maturation
Cosmic ray induced spallation affects the concentrations of noble gas isotopes of helium, neon, argon, krypton and xenon, produced from spallation of barium (Ba), rubidium (Rb) strontium (Sr), yttrium (Y), and zirconium (Zr) parent isotopes (David and Leya, 2019). Indigenous sources of 4He and Ar isotopes, however, exist in the regolith, complicating their use in exposure age determinations. 4He is a component of the solar wind and also is produced as alpha particles through decay of uranium and thorium. Further, some 39Ar comes from the decay of 40K. Given these facts, the spallation production of isotopes of neon, krypton and xenon are generally selected for exposure age dating.
A full discussion of these issues is beyond the scope of this Chapter, and the reader is referred to the review paper of David and Leya for additional information. Eugster et al. (1969) and Eberhardt et al. (1974) discuss the methodology for using noble gas spallation isotopes for exposure age dating in meteorites and lunar samples. Unfortunately, with the exception of Sr, analyses of the parent elements in the deep drill core 70001/9 are not available.
Eberhardt et al. (1974) reported cosmic ray isotopic ratios and exposure ages at specific depths of measurement for 9 of the 11 regolith ejecta zones in the deep drill core, if their age for 70181 is considered a surrogate for zone S, as discussed previously in §5.0. Only zones W* and X* have no corresponding cosmic ray age data.
A plot of the ratios 126Xe/132Xe (black points) and 124Xe/132Xe (red points) (Eberhardt et al., 1974) versus the Sr values (Meyer, 2012) given in Fig. 13.17a↓ shows a possible linear correlation; but this possibility is very dependent on data from zone V+V*. Further, if Eberhardt et al.’s values for 126Xe / 132Xe are plotted against the Sr values given by Laul et al. (1978, 1979, Laul and Paipike, 1980a) (Fig. 13.17b↓), a relatively close match of Sr values is found, indicating little or no fractionation during maturation.
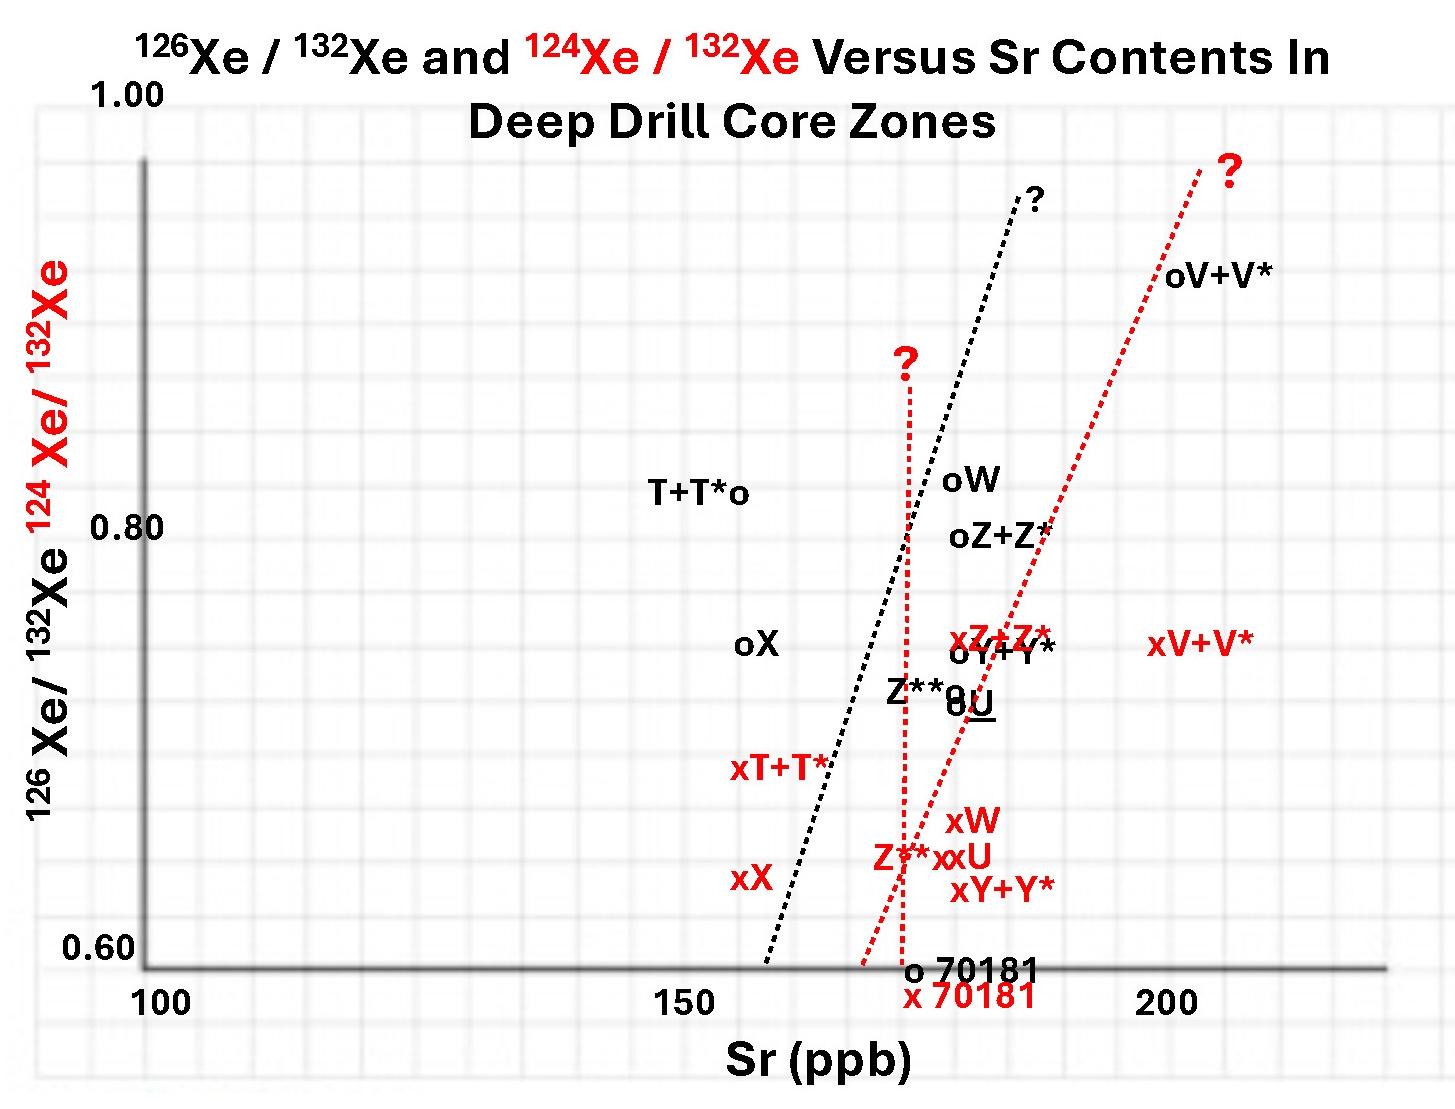 Fig. 13.17a. Deep drill core correlation of 126Xe/132Xe (black o) and of 124Xe/132Xe (red x) (Eberhardt et al. (1974) with Sr concentration from (Meyer, 2012).
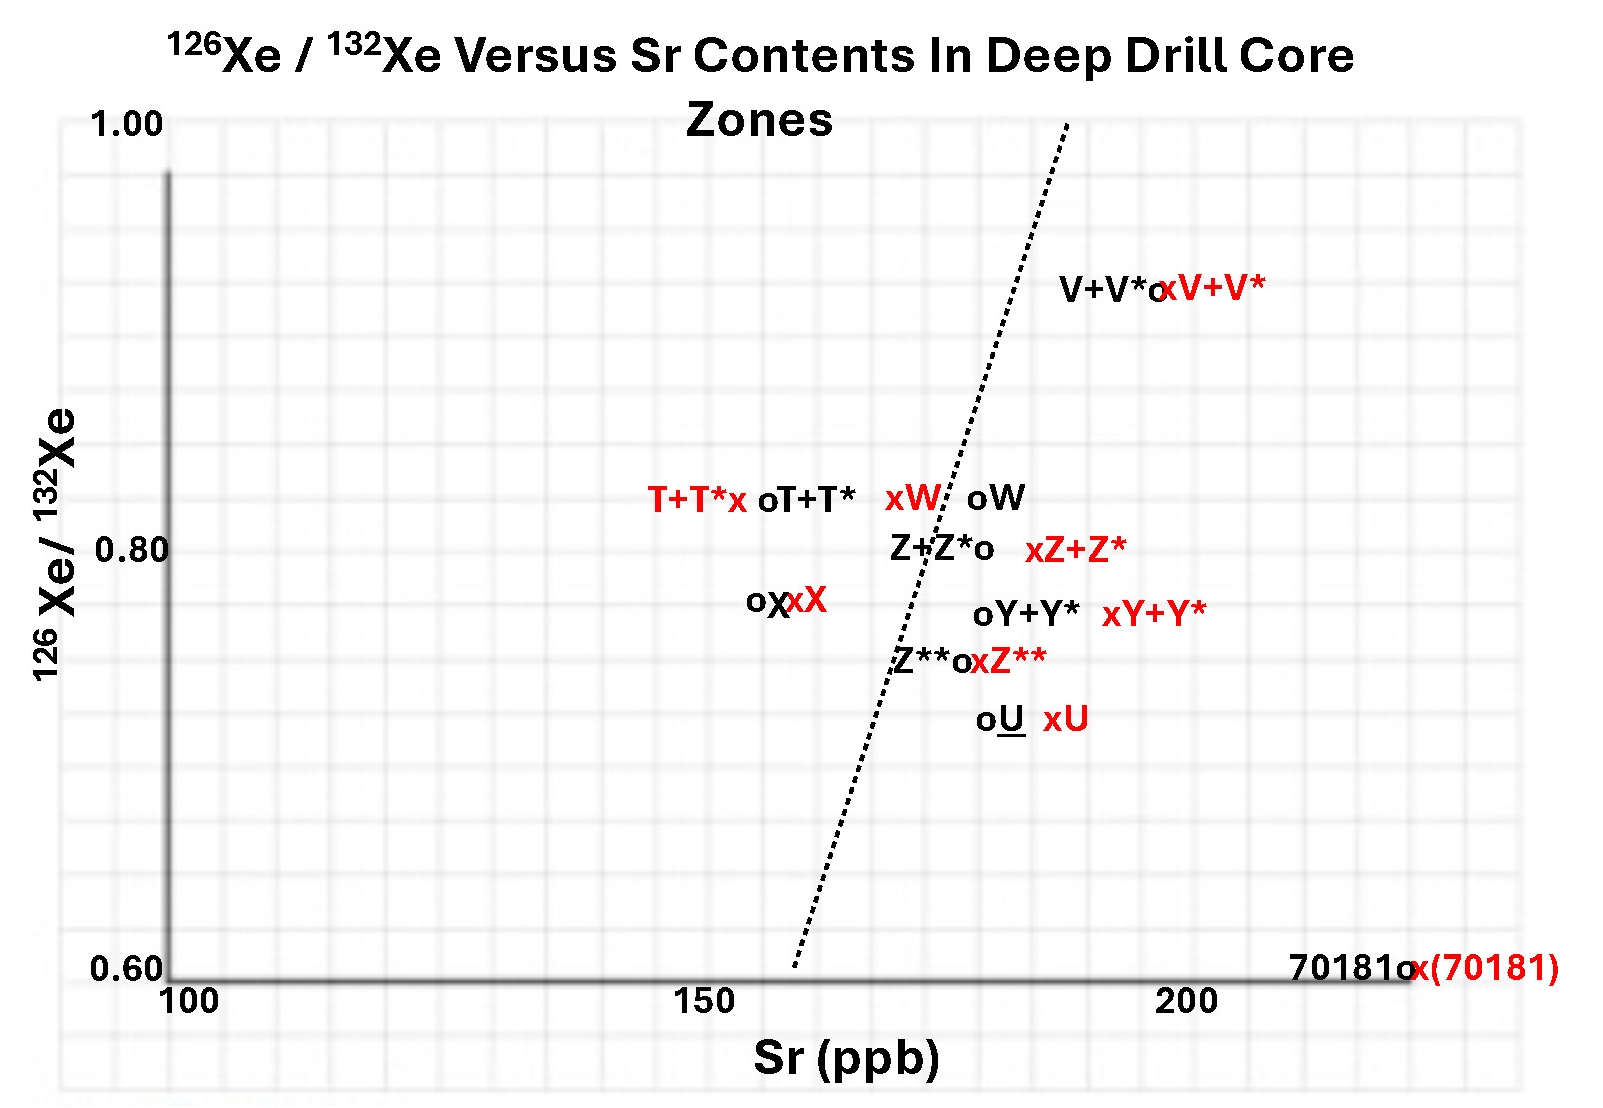 Fig. 13.17b. Deep drill core comparison of 126Xe/132Xe (Eberhardt, et al. (1974) with Sr concentration from Meyer (2012) (black o from Fig. 13.17a) against Sr concentrations from (Laul et al., 1978, 1979, Laul and Papike, 1980a) (red x).
A plot of 124Xe/132Xe versus total Is/FeO in Fig. 13.17c↓ further indicates that 132Xe increases with maturity, but the 124Xe/132Xe ratio remains constant. Similar relationships are apparent relative to 20Ne/22Ne v. total Is/FeO in Fig. 13.17d↓, although the scatter of points for the youngest regolith ejecta zones S and T to the right of the constant ratio line raises the possibility that the 20Ne/22Ne ratio in the solar wind has changed in the last hundred million years (see Table 13.15 for ages). The ratio of 20Ne/22Ne should be useful in determining exposure ages as there is no indication of the loss of 20Ne during maturation, as shown in Fig. 13.17d↓. (The indication of a constant 20Ne/22Ne ratio in Fig. 13.17d↓ also suggests that the concentration of 25Mg (Caldwell, 2004) is so low that few alpha particle reactions with it occur that would produce 22Ne.)
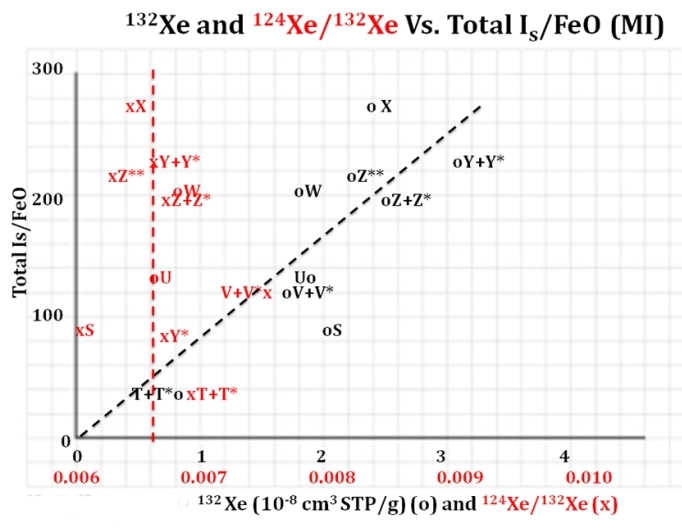 Fig. 13.17c. Correlation of 132Xe and 124Xe/132Xe (Eberhart et al., 1974) with deep drill core zones total Is/FeO from Table 13.1a. Solar wind derived 132Xe content (black o) increases with Is/FeO (exposure) while cosmic ray spallation produced 126Xe scatters around a roughly constant 124Xe/132Xe ratio (red x) vs. Is/FeO.
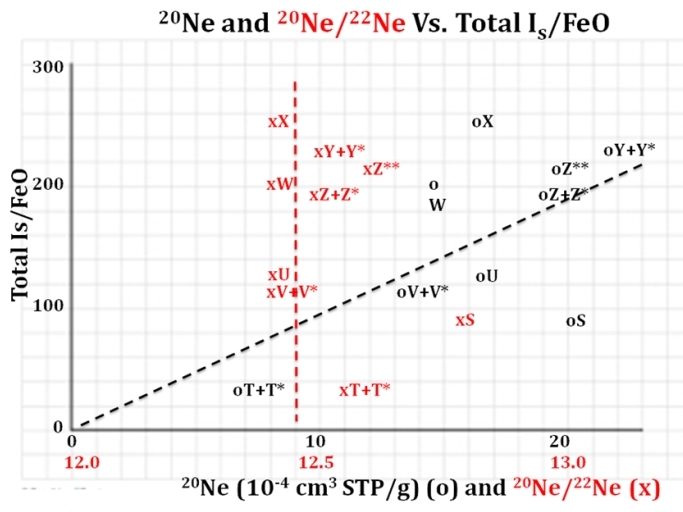 Fig. 13.17d. Correlation of 20Ne and 20Ne/22Ne (Eberhardt et al., 1974) with deep drill core zones total Is/FeO from Table 13.1a. Solar wind derived 20Ne content (black o) increases with Is/FeO (exposure) while cosmic ray spallation produced 20Ne/22Ne scatters around a roughly constant ratio (red x) vs. Is/FeO.
78Kr, however, appears to be behaving differently from Xe and Ne isotopes. Fig. 13.17e↓ shows that the ratio of spallation 78Kr versus 86Kr decreases with maturity and its integration with 126Xe/132Xe to get exposure ages, as apparently done by Eberhardt et al. (1974) would need to be evaluated further.
 Fig. 13.17e. Correlation of 86Kr and 78Kr/86Kr (Eberhart et al., 1974) with deep drill core zones total Is/FeO from Table 13.9. Solar wind derived 20Ne content (black o) increases with Is/FeO (exposure) while cosmic ray spallation produced 20Ne / 22Ne scatters around a roughly constant ratio (red x) vs. Is/FeO.
86Kr content increases with total Is/FeO (age) while the 78Kr/86Kr ratio decreases with Is/FeO, scattering around an Is/FeO / 78Kr/86Kr trend of about –6 × 10³. Based on this Is/FeO / 78Kr/86Kr trend, it would take a decrease of about 6 × 10³ in 78Kr/86–Kr to be equivalent to an increase in Is/FeO = 1. In spite of the loss of minor 78Kr indicated by the plots in Fig. 13.17e↑, the loss of 78Kr with maturation would not have an appreciable effect on cosmic ray exposure ages considered here.
The loss 78Kr during maturation, taken in the context of §6.2’s discussion of 14N loss relative to 15N, indicates that there are questions yet to be answered relative to loss (or gain) of volatile elements by the lunar regolith, especially taking into account the hundreds of millions of years involved in regolith ejecta zone maturation. Some of those issues may relate to affinities of some noble gases to form real or quasi-compounds with other elements exposed on the surfaces of regolith particles. For example, the apparent small 78Kr loss during maturation may relate to the formation and subsequent volatilization of a temporary, pressure stabilized, van der Waals compound, krypton hydride [Kr(H2)4] (Kleppe et al., 2014), possibly formed as a transient phase under the very local high pressures generated by macro- and micro-meteor impact. On the other hand, the absence of loss of 126Xe relative to 132Xe during maturation largely may be a simple consequence of the relatively large relative masses of Xe isotopes.
6.4.4 Depth Corrections for Post-Burial Additions to Apparent Cosmic Ray Exposure Ages
The decrease in the effects of cosmic ray spallation with depth in buried, un-gardened lunar regolith must be considered in the use of reported cosmic ray exposure ages. Eugster et al. (1981a) conclude that this effect becomes minor at more than 80 g/cm2 (40 ± 5 cm), depending on density. This relationship is shown in the y = 1/t plot in Fig. 13.18, where “y” equals the effect of a continuous spallation process and “t” equals the thickness of overlying regolith that attenuates that effect.
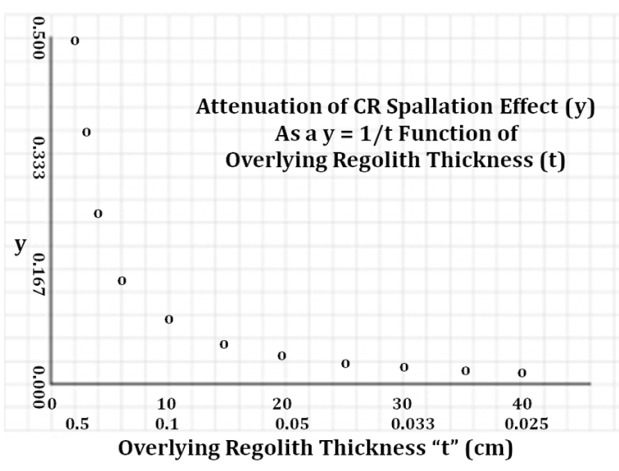 Fig. 13.18. A y = 1/t plot related to attenuation of cosmic ray effects by overlying regolith, where “y” equals the effect of a continuous spallation process and “t “equals the thickness of overlying regolith.
Multiplying the measured exposure age by the value of “y” from Fig 13.18, for a given overlying thickness, gives the correction necessary for a given value of “t” less than 40 cm (core density = ~2.0; Carrier, 1974). The ages in Column 2 of Table 13.13 are the reported cosmic ray exposure ages and those in Column 5 are corrected for their post-burial depth of exposure as indicated in Column 4.
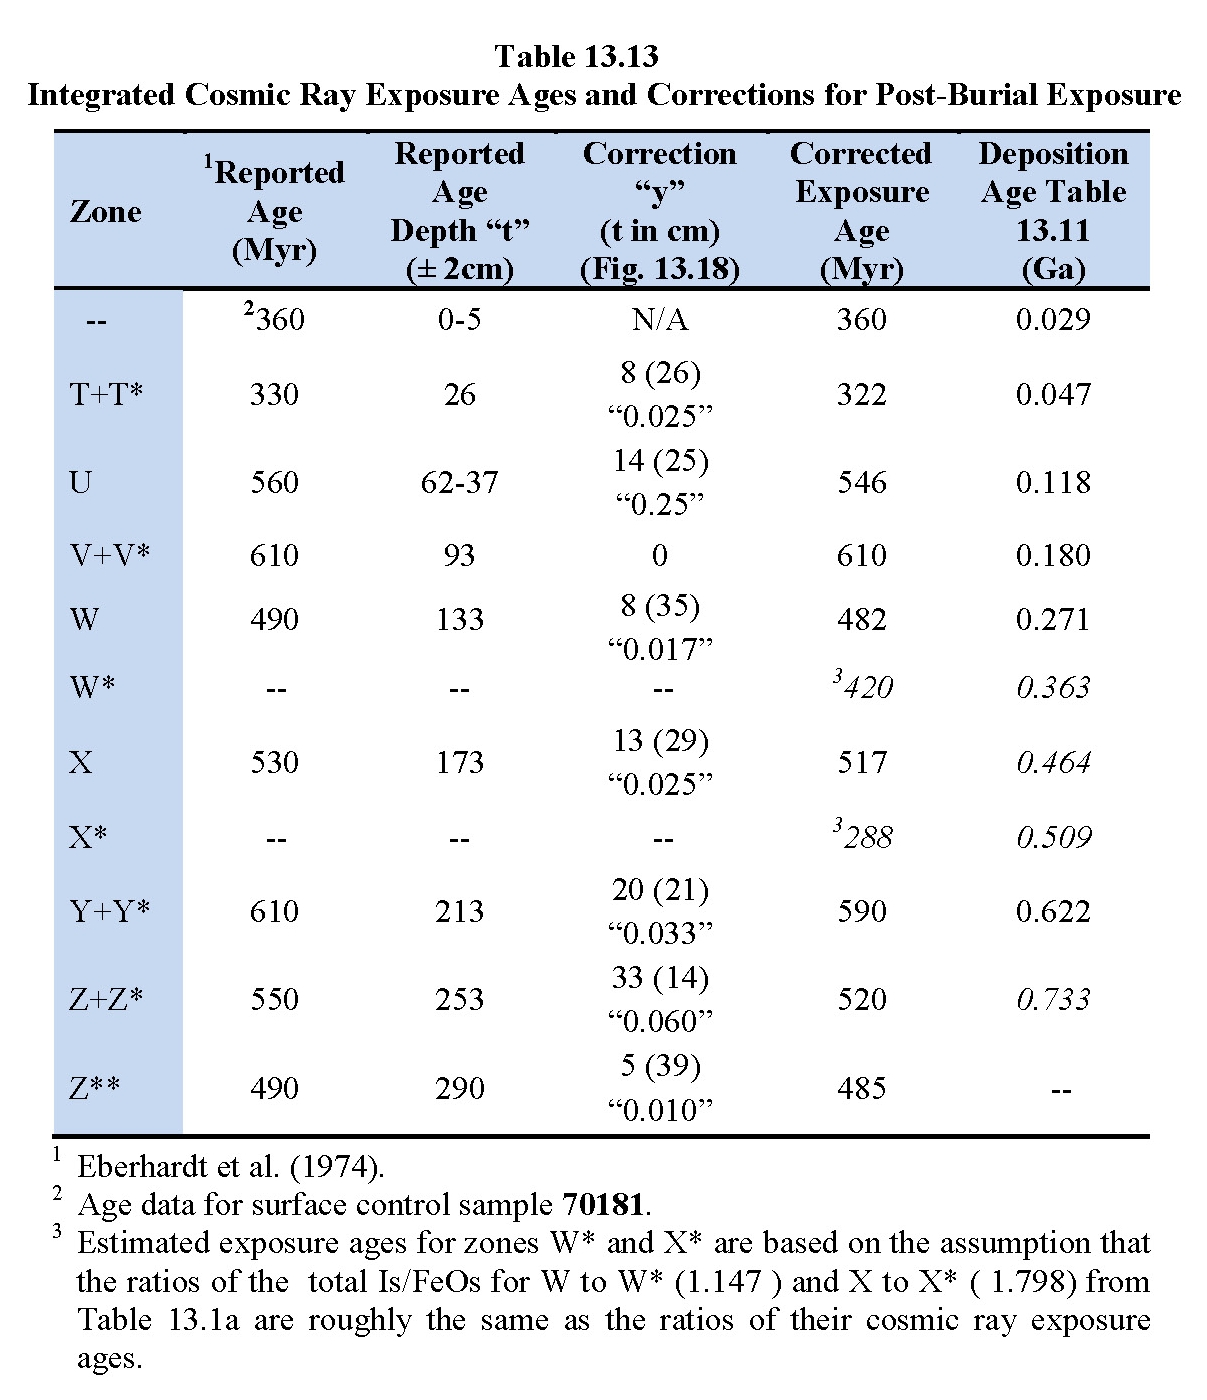
Links for Eberhardt et al. (1974); Table 13.1a↑.Subsequent synthesis (Table 13.16↓) determined that source crater impacts significantly reset pre-impact Is/FeOm values for regolith ejecta in deep drill core zones. With respect to Footnote 3 in Table 13.13, if total Is/FeOs, corrected for impact resets calculated in Table 13.16↓, are used W to W* becomes 1.250 and X to X* becomes 1.717 and the corrected exposure age for W* becomes 386 Myr (8% less than 420 Myr) and for X* becomes 301 Myr (5% more than 288 Myr). Further iteration of these two sets of ages for W* and X* between Tables 13.13 and 13.16 would be possible, however, any improvement over the 420 and 288 Myr in Table 13.13 (also used in Table 13.16) probably would be well within the overall error limits of their respective calculations.
7.0 Ilmenite and Volcanic Ash Attenuation of Nano-Phase Iron Formation During Regolith Maturation
7.1 Introduction
The synthesis provided by Schmitt (2014b) for Taurus-Littrow TiO2 vs. Is/FeO, and the absence of ∆Is/FeO values more than two (Morris et al., 1978) in all but the upper 5 cm of the 5-7 zones of pure orange+black ash in core 74002/2, very strongly suggests that both ilmenite and glass-rich ash attenuate the formation of nano-phase iron and corresponding increases in ∆Is/FeO. Regrettably, the author has been unable to fully quantify the indications of these effects in the deep drill core, both of which would bias the ∆Is/FeO-based exposure ages calculated in Table 13.11↑ to lower than actual values. An attempt to determine this bias detailed below suggests the attenuation might have reduced the estimated 0.890 Ga (Table 13.11↑) for the total depositional age of the upper 2.85 m of the deep drill core by as much as 0.061 Ga (Table 13.15↓).
In the following attempt at quantifying the ilmenite (oxide) and pyroclastic glass attenuation, it became clear that pyroclastic glass is the major factor. As drive tube core 74001/2 ash contains 0.605 ppm U+Th (Nunes et al., 1974, with Th/U = 3.25), the extremely low Is/FeO values in the core (Morris et al., 1978) indicate that disseminated Fe++ and sources of alpha+beta particles in glass (or solar protons, if ash is exposed at the surface as it appears it has been several times) cannot interact for reduction of Fe++ to Feo.. The ash in the deep drill core 70001/9 consists of (1) orange+black, high TiO2 quenched glass (74220, FeO = 22 wt%); (2) residual clear glass in partially devitrified orange+black glass in which U and Th remain isolated from structural Fe++; (3) yellow/green, VLT glass bead in 70007 (Vaniman et al., 1979), VLT glass bead in 71501 (Zellner et al., 2009), and VLT scoria 78526 (Meyer, 2012); and (4) small amounts of brown/grey glass (origin unknown, but possibly ejected non-agglutinate impact melt). Unfortunately, data on the volume percent of pyroclastic glass in the 10 complete zones of the deep drill core are not precise enough to make close estimates of its effects on the measured values of ∆Is/FeO; however, modeling estimates (§5.0) provide rough estimates of the wt% of ash for each zone
7.2 Ilmenite Attenuation of Nano-Phase Iron Formation
Schmitt’s comparison of the maturity indices determined by Morris (1978) and corresponding TiO2 contents (Meyer, 2012) in 31 regolith samples from the valley of Taurus-Littrow (Fig. 13.19a↓) suggested to him that ilmenite (FeTiO3) has the effect of reducing the rate of regolith maturation. The total Is/FeO used in that comparison, however, included the assumption that the logged value of Is/FeOm (Table 13.1a↑) was the correct pre-deposition value for each zone. In §8.0, where deep drill core cosmic-ray exposure ages are compared with logged Is/FeOm values, it is shown than these values have been reset by 76-96% (Table 13.16↓) by the impact shock of source crater formation. Not knowing the true value of the total exposure Is/FeO for the surface samples included in the Schmitt (2014b) synthesis invalidates its conclusion that ilmenite attenuates maturation.
 Fig. 13.19a. Plot of maturity indices (Morris, 1978) vs. TiO2 content (Meyer, 2012) of surface regolith samples from the valley of Taurus-Littrow, showing a strong influence of TiO2 content over 7 wt% over the measured amount of maturation (Is/FeO) (Schmitt, 2014b).
On the other hand, the plot of ∆Is/FeO vs. TiO2 for the deep drill core zones in Fig. 13.19b↓ suggests, but does not prove, that Schmitt may have stumbled onto something. The problem in Fig. 13.19b is that the high TiO2 zones S, T+T* and U are also low exposure zones (less than 100 Myr each from Table 13.11) relative to the low TiO2 zones W through Z+Z*. The possible correlation with low exposure age might break down with low exposure zones V+V* and X*, however, these two zones, along with all the zones with higher exposure ages, have less ilmenite. They have reported modal% “opaques” at 2.7% or less versus modal% “opaques” = 3.0-4.0% for zones S, T+T* and U (Vaniman et al., 1979). (“Opaques” in lunar materials would be almost entirely ilmenite (Heiken et al., 1992).
In light of these various hints, it may be justified to assume that ilmenite attenuates maturation at some level, if only due to its high density (4.2 g/cm) relative to other minerals and agglutinate components of the regolith. Another factor may be that early crystallizing ilmenite in lava may contain very minor amounts of uranium and thorium that would reduce the ∆Is/FeO / Myr within the mineral. No analytical data on lunar ilmenites that support this latter possibility has been located. Final confirmation of these assumptions must await more detailed data and its synthesis.
[As the TiO2 content of pure ilmenite is ~53 wt%, the maximum vol.% of ilmenite in a sample can be estimated by multiplying the measured TiO2 by 1.89, assuming titanium incorporated in other minerals, particularly clinopyroxene, is less than 5.8 wt%. Thus, with a TiO2 = 7.5 wt% (Laul and Papike, 1980b) the type regolith sample from Apollo 11, 10084, could contain ~3.2 vol% ilmenite vs. the reported modal% of “opaques” = 1.1 reported by Simon et al. (1981). The same calculation applies to zone S.]
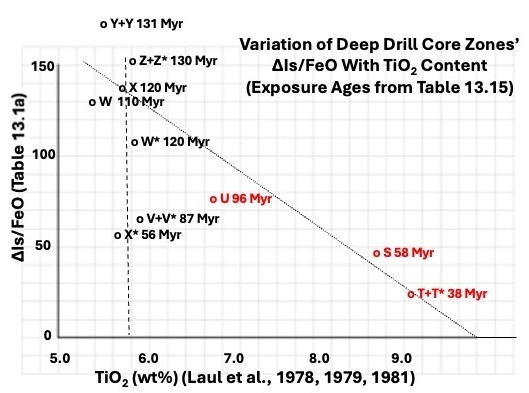 Fig. 13.19b. Plot of TiO2 concentration (Laul et al., 1978, 1979, 1981) (Table 13.8aa↑–Table 13.8kk↑) versus ∆Is/FeO from Table 13.1a↑ for samples of deep drill core zones. Exposure ages from Table 13.11↑.
7.3 Pyroclastic Ash Attenuation of Nano-Phase Iron Formation and Corrected Deep Drill Core Ages
Is/FeO values are less than 2 below 5 cm in 100% pyroclastic ash sampled by drive tube 74001/2. As this ash contains 0.605 ppm U+Th (Nunes et al., 1974, with Th/U = 3.25), these data indicate that disseminated Fe++ and alpha+beta particles in glass cannot interact for reduction to Feo. Lack of interaction with solar protons would also be the case for glassy ash exposed at the surface. The ash in this core consists of (1) orange+black, high TiO2 quenched glass (74220, FeO = 22 wt%) and (2) residual clear glass in partially devitrified orange+black glass in which uranium and thorium remain isolated from structural Fe++ in crystallites. Also, other regolith samples and the deep drill core contain yellow/green, VLT glass (70007 VLT bead and 78526 VLT scoria), and small amounts of brown/grey glass (origin unknown, but possibly non-agglutinate impact melt).
The methodology used to estimate the exposure ages in Table 13.11↑ includes the use of ∆Is/FeO / Myr / U+Th = 0.58 plus the solar proton only ΔIs/FeO / Myr = 0.11 (zones S and T+T*) or 0.032 (zones U to Z+Z*), derived in §6.3. U+Th values are corrected for age-related decay. As per the evidence from drive tube 74001/2, however, alpha+beta radiation from the U+Th contained in the pyroclastic ash was almost fully attenuated relative to any alpha+beta contribution to an increase in ∆Is/FeO. The calculated zone exposure ages in Column 7 of Table 13.11, therefore, are lower than their actual exposures by an amount proportional to the ash content (wt%) in a given zone, that is, actual ∆Is/FeO / Myr values are less than the calculated values of ∆Is/FeO / Myr given in Column 7 of Table 13.11 because of the presence of the effectively inert U+Th in pyroclastic ash.
[The primary, quenched glass in the orange pyroclastic ashes would have uranium, thorium and iron disseminated in solution rather than concentrated in crystals, and it largely would have prevented alpha+beta particles from interacting with Fe++ to produce Fe°. The glass also would limit solar proton access to dissolved Fe++ at grain surfaces exposed to solar protons. The secondary, residual glass in the black, partially devitrified ashes would be depleted of Fe++ due to mafic crystallite formation; however, incompatible uranium and thorium atoms would remain dispersed in the glass matrix.]
The graphical effect of the attenuation of ΔIs/FeO / Myr as a function of the estimated wt% of pyroclastic ash in each zone is shown in Fig. 13.20↓, where the §5.0 modeled ash weight percentages (Table 13.8aa↑–Table 13.8kk↑) are plotted against zone ∆Is/FeO / Myr (Table 13.11↑). The trend line of the plotted modeled data in Fig. 13.20↓ is “∆Is/FeO / Myr per Ash wt% = −0.025”, and that trend is used in Table 13.14↓ to calculate the reduced ΔIs/FeO / Myr resulting from attenuation by pyroclastic ash, primarily due to the fact that significant uranium and thorium have been made inert by dissemination in glass in the ash. Estimates of the modeled ash contents (wt%) have been improved in Column 2 of Table 13.14 by their projection to the trend line in Fig. 13.20↓. The scatter of points around this trend suggests that there is about a ± 5 wt% error in the addition of ash to the compositional models in §5.0 (Tables 13.8aa-kk).
As in the case of TiO2 (ilmenite) related attenuation, statistics underlying Fig. 13.20↓ are poor and the scatter of points is significant. This scatter probably relates to inaccuracy in modeling ash content of the various zones; however, a rough trend line of about ∆Is/FeO / Myr Ash % = −0.025 is indicated. Projecting that trend line to zero ∆Is/FeO / Myr indicates that no nano-phase iron would be produced above an ash content >58 wt%. Such a concentration of ash would appear to be sufficient to prevent alpha+beta and solar proton radiation reaching the Fe++ in partially crystallized particles.
A comparison of Taylor et al.’s (1979) modal percentages (thin section point counts) of partially devitrified “black glass” (Fig. 13.10b↑) and Vaniman et al.’s (1979) modal percentages “orange/black glass” and “yellow/green glass” do not closely track those estimated in the §5.0 modeling plotted in Fig. 13.20↓. Taylor et al.’s modal percentages, however, only represent grain sizes between 0.02 and 0.2 mm (20-200 µ) and do not include about 30% of the ash present in samples, specifically ash particles below 0.02 mm (20 µ) (Graf, 1993). The modeled ash contributions in Table 13.8aa↑–Table 13.8kk↑ of §5.0, on the other hand, reflect bulk compositions that would include the particles below 0.02 mm.
 Fig. 13.20. Variation of ∆Is/FeO / Myr values from Table 13.11↑, col. 4, relative to compositionally modeled pyroclastic ash contents (black trend line) (§5.0, Table 13.8aa↑–Table 13.8kk↑).
Evaluation of the effect of inert pyroclastic ash on the calculations given in Table 13.11↑, largely depend on the U+Th content that did not contribute to maturation through alpha+beta decay. The U+Th content of orange+black ash 74220 is reported as 0.874 ppm (Silver, 1974). Unfortunately, specific analyses for uranium and thorium in the 70007 VLT ash bead use in §5.0 modeling have not been found, nor do such analyses appear to be available of potential VLT surrogates such as green glass scoria 78526 (Meyer, 2012) and the VLT ash bead in 71501 studied by Zellner et al. (2009). A potential surrogate green glass ash from Apollo 15, 15426, has “handpicked” green glass analyses that suggest very low U+Th contents of 0.2-0.3 ppm (Meyer, 2012).
Haggerty et al. (2006), however, report analyses for green ash glasses from regolith breccia 79135 obtained at the rim of Van Serg Crater. They indicate Th content varies from 0.42 to 0.73, ppm, from which they derive U content as 0.11-0.20 ppm, indicating an Th/U ratio of 3.82 to 3.62. As the highest Th value they report is consistent with the hypothesis (§10.6) that Apollo 17 VLT magma was a late differentiate of ilmenite basalt magma (Th = 0.766 ppm for ilmenite basalt-rich zone T+T*; Silver, 1974), the use of Silver’s Th/U ratio of 3.29 may be more appropriate. This would give a U content of 0.13 to 0.23. These results give a VLT U+Th value of 0.55 – 0.96 ppm or a mean of ~0.75 ppm for sample 70007.
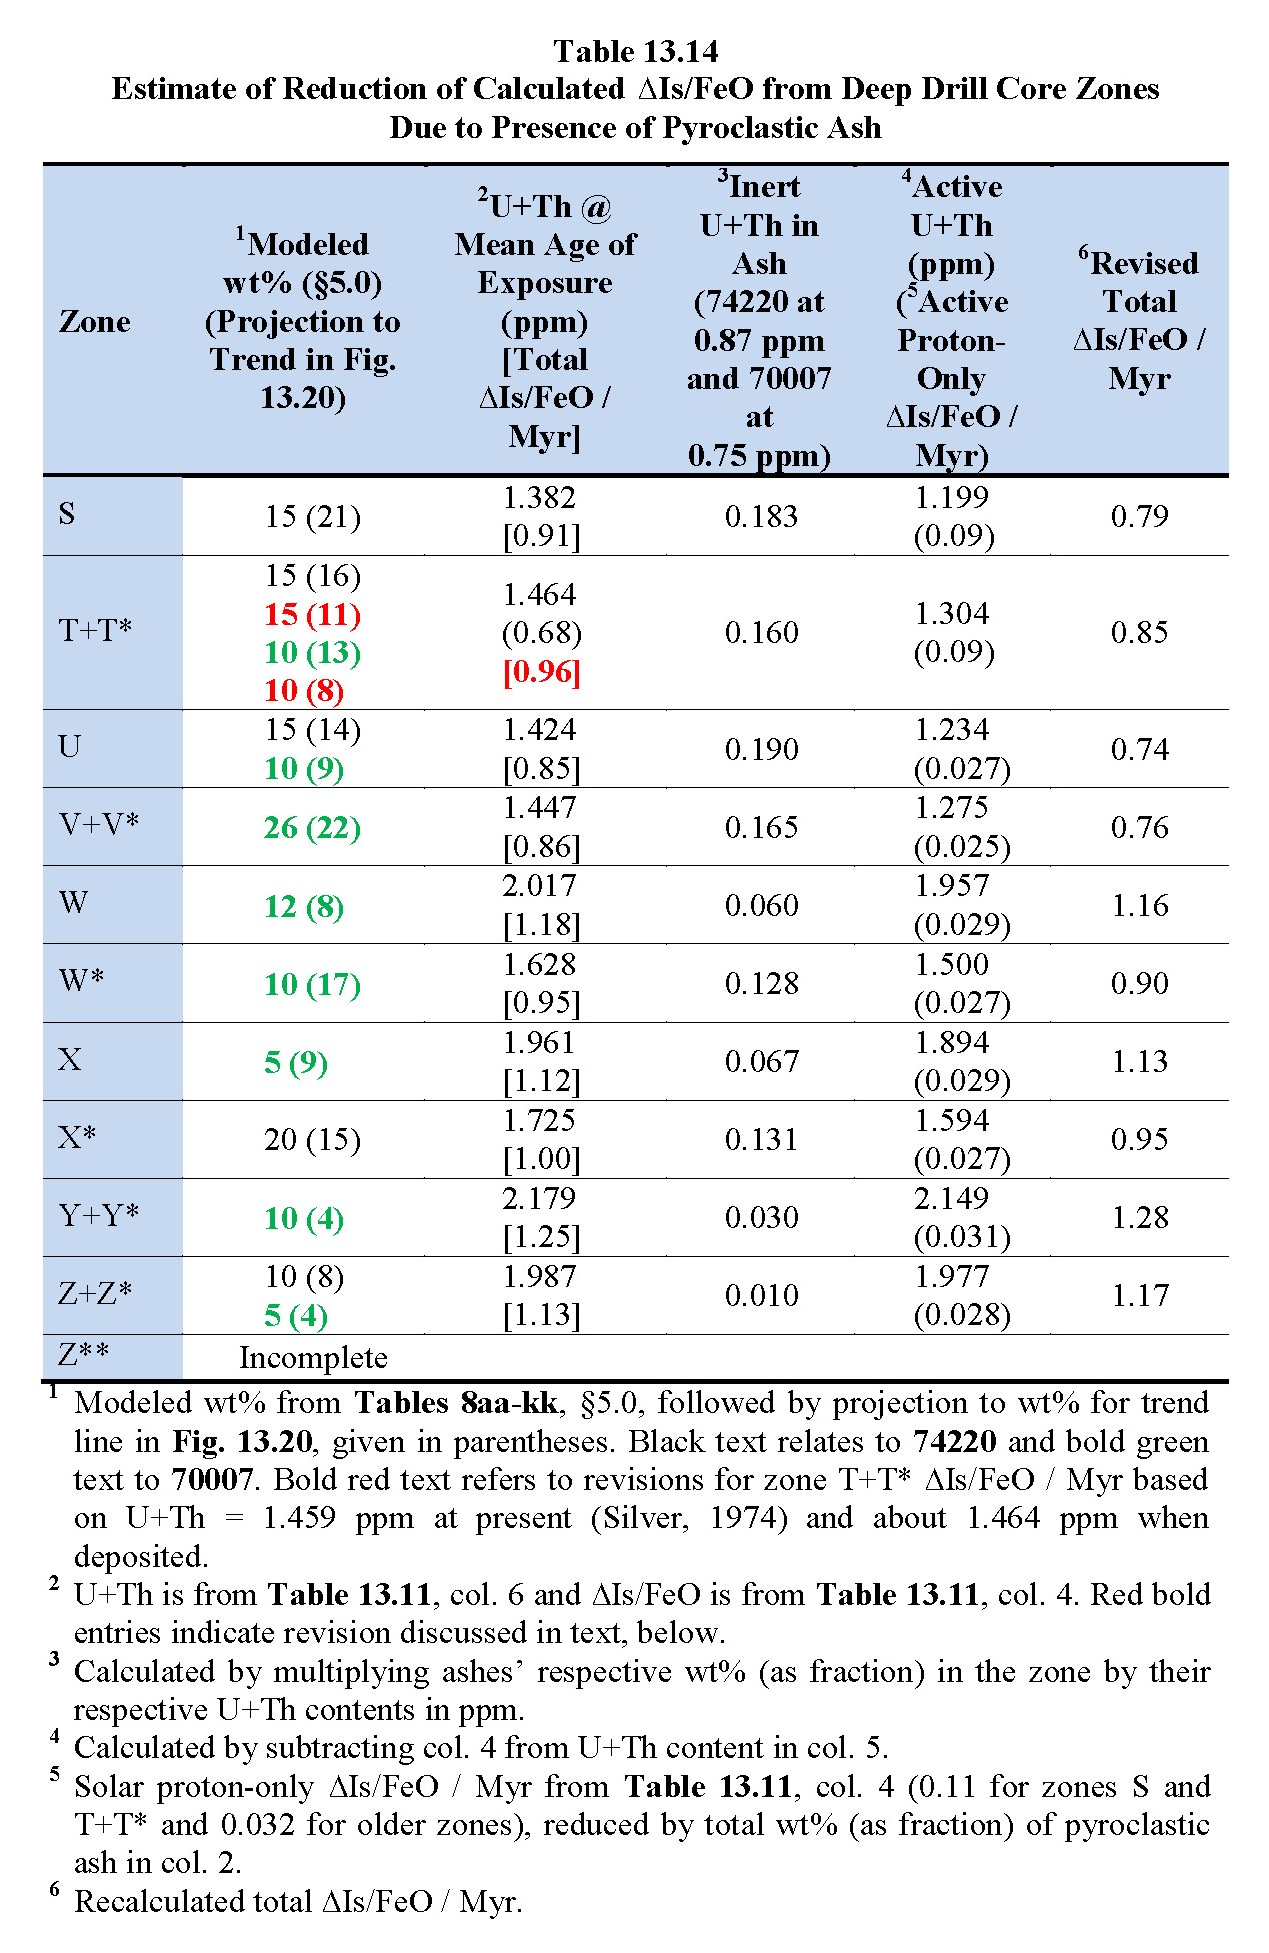
Links for Table 13.8aa↑–Table 13.8kk↑, Fig. 13.20↑, Table 13.11↑.Using the U+Th values for the ash components of the deep drill core zones of 0.87 ppm for 74220 and 0.75 for 70007 bead, Table 13.14↑, column 6, gives the determination of the reduced ∆Is/FeO / Myr for deep drill core zones, based on the combined wt% of orange+black and VLT ashes.
Table 13.15 uses the reduced ∆Is/FeO / Myr values from Table 13.14↑ to calculate revised zone exposure and deposition ages (column 5) and concludes that the total time that the deep drill core records over 2.85 m and 10 regolith ejecta zones is 0.951 Ga. This represents a deposition rate of ~3.00 m per billion years. Measured against the 3.82 Ga youngest age for the last basalt eruption, this rate indicates that the regolith at the core site is ~11.5 m deep (3.82 Ga. × 3.00 m/Ga).
The lower values of ∆Is/FeO / Myr in Column 4 of Table 13.15, with the exception of zone T+T*, are roughly compatible with the values calculated in Table 13.11↑, Column 6. The major increase in ∆Is/FeO / Myr that results for zone T+T* (0.85 vs. 0.69) may be the result of several factors, such as:
1. Zone T+T* is the deep drill core’s least mature regolith ejecta zone (Fig. 13.1a↑) and its relatively high frequency of large fragments and relatively low frequency of fine fragments (Graf, 1993, 70008, 24-8-46.8 cm) suggests that maturation failed to reach a steady state in which sources of alpha+beta radiation were uniformly distributed throughout the zone. This circumstance would reduce the rate of formation of nano-phase iron and the measured value of ∆Is/FeO for the zone.
2. The originally assumed U+Th value for zone T+T* of 0.999 ppm at 26 cm (Silver, 1974) is too low for the entire zone and Silver’s alternative value of 1.459 ppm at 28 cm should be assumed. (See Table 13.1b↑, column 3, for other indications of U+Th variability in zone T+T*.) This change would increase the alpha+beta only ∆Is/FeO / Myr / ppm from 0.58 (Table 13.11↑, Column 4) to 0.76 and the total ∆Is/FeO / Myr to 0.85 (added proton-only ∆Is/FeO / Myr = 0.09). The second, red plot for T+T* in Fig. 13.20↑, and related adjustments, indicate the effect of this change in U+Th content.
[Increases in ∆Is/FeO for zone T+T* are not resolved in the half-cm logging of the raw Is/FeO data for 15 cm (31.05 to 46.05 cm) (Morris, personal comm.). Over this interval, the Is/FeO measurement is equal to ~10 (Fig. 13.1a↑) and partial reset decreases and increases in Is/FeO are not resolved. If the average ∆Is/FeO increase of 0.510 / cm for the 284 cm core (Table 13.7↑) is applied to this 15 cm, the ∆Is/FeO would be about 8, increasing zone T+T* total ∆Is/FeO from the logged 24 (Table 13.1a↑) to 32. Also, such small, individual increases largely would not be resolvable in the raw, half-cm data.]
[Normalizing to U+Th content in column 4 of Table 13.15↑ tests the consistency of calculations leading to values of ∆Is/FeO / Myr. The similar values in this test support the validity of those calculations, as alpha+beta radiation is the dominant factor in creating nano-phase iron and determining ∆Is/FeO values. The difference between normalized values for zones S and T+T* and those of older zones is the result of higher solar proton radiation during exposure of those two zones.]
As noted above, a deposition age of about 0.951 Ga for 2.85 m calculated in Table 13.15↑ indicates an approximate regolith ejecta deposition rate of ~3.00 m per Ga. As the regolith has been accumulating since 3.82 Ga with the final eruption of the ilmenite basalt lavas, the depth of regolith at the deep drill core site would be about 11.5 m. The available direct evidence for regolith depth from LROC images (Lunar QuickMap) of impact craters near the core site is as follows:
1. Rudolph Crater, 75 m west northwest of the core site, is ~50 m in diameter and ~8 m deep. Its very flat floor, presumably the relatively coherent current top of underlying basalt bedrock, indicates regolith plus rubble depth there was less than 8 m, but close to the 11 m depth suggested above.
2. An unnamed crater, 140 m north of Rudolph and 270 m northwest from the core site, is ~33 m in diameter and ~2 m deep. Its floor is roughly a point rather than flat, indicating that the regolith depth there was more than 2 m.
It is important to recognize that the original surface of the basalt that partially filled the valley of Taurus-Littrow was very irregular in its topography. This is certainly the case with terrestrial basalt flows and would be accented on the Moon by the 1/6 Earth-gravity field and flow eruption and cooling sequences.
The revised age estimates given in column 7 of Table 13.15↑ suggest the following tentative conclusions:
1. The deep drill core sampled about one billion years of lunar history, that is, ~0.951 Ga in 2.85 m of regolith ejecta accumulation. This is very roughly consistent with estimates based on independent data of about one billion years for the total core by Curtis and Wasserburg, 1975; Corzaz and Plachy, 1976; Drozd et al., 1977).
2. The rate of the local inter-crater regolith accumulation is ~3.00 m per Ga (2.85 m / 0.951 Ga).
3. A 39-40Ar age of 3.82 Ga (Schaeffler et al., 1977) for a sample of the youngest eruption of ilmenite basalt in Taurus-Littrow indicates that the local inter-crater regolith at the core site is ~11.5 m deep (3.82 Ga × 3.0 m). This is well within the average depth of regolith of <25 m indicated by the results from the Apollo 17 Active Seismic Experiment (Kovach et al., 1973) and the ~20 m depth indicated by the Surface Electrical Properties Experiment (Simmons et al., 1973), both of which gathered data west of the core site. Variations in various depth estimates may reflect the effects of a rubble zone on top of a highly fractured and a topographically irregular flow top that biases the geophysical returns toward a thicker apparent regolith.
4. The 58 Myr exposure age of deep drill core zone S is roughly consistent with the interpretation of neutron probe data (Curtis and Wasserburg, 1975) that a late ejecta deposition of material with 50 g/cm2 occurred <50 Myr ago. The equivalent zone S compacted thickness is 20 cm and its in situ thickness is about 35 cm. At a density of ~2 g/cm3 (Carrier et al., 1991) this equates to ~40 to 70 g/cm2, consistent with that from the neutron probe.
5. The 3.4 times increase in solar wind energy prior to zone T+T* deposition appears to have occurred prior to 96 Myr years ago and may have a long-term association with the change in solar wind δ15N‰ to –118‰ after about 514 Myr ago (after zone W*, §6.2.2).
6. A previously suggested age of Camelot of 500 ± 150 Myr (Schmitt et al., 2017), based on estimates of rates of topographic erosion, appears to be too high by about a factor of two. Based on the estimate in Table 13.15↑, Camelot, as a source crater for zone V+V*, formed at about 284 Myr ago.
7. Regolith ejecta from impact craters older than Cochise and Shakespeare (zones Z+Z* and Z**), such as Snoopy, SWP, SH and WC in Table 13.3a↑, largely became masked by about 1.0 Ga due to a combination of impact erosion, younger crater ejecta blanket deposition, mass-wasting, and varying thicknesses of the local regolith ejecta cover.
8. Although statistics are very limited, the average exposure age, and thus the average frequency of 400-1400 m crater formation, of the 3 youngest zones, excluding anomalous zone U, is ~71 Myr versus that of 5 older zones, excluding zone X*, of ~122 Myr. Zone X* has not been included in the oldest group as having an anomalously young exposure age of 56 Myr.
8.0 Comparison of Deep Drill Core Zone, Is/FeO-based Exposure Ages with Integrated Cosmic Ray Exposure Ages
The presence of defined regolith ejecta zones in the deep drill core indicates, by extension, that such stratigraphy exists in inter-crater areas outside the reach of near source crater ejecta blankets (~one crater diameter). Large impacts initially excavate local regolith, creating the parabolic regolith ejecta arches as discussed in §3.3. Ballistic and volatile turbulence in parabolic arches appears largely to integrate the cosmic ray exposure ages as well as compositions of the all zones making up the pre-impact regolith. The turbulence in the ballistic ejecta sheath likely results from slight differences in the velocities and trajectories of individual particles, augmented by the agitation release of solar wind volatiles that then would be entrained in the regolith ejecta. After each sequential impact capable of forming a 400-1500 m diameter crater, the ballistic integration process is repeated, creating a new regolith ejecta zone that becomes a part of the regolith stratigraphy in inter-crater areas within about 5 or 6 km of the the source crater impact.
[Turbulence in the parabolic arch does not eliminate all petrographic heterogeneity (see Fig. 13.11↑; Taylor et al., 1979; Vaniman et al., 1979), suggesting that integrated mixing is confined largely to the finer fractions of the ejected regolith. In this regard, over 75% by mass of the regolith ejecta is made up of particles less than about ~150 µ (Graf, 1993). Agitation released volatiles from surfaces of the fines also probably play a role in the integration of the fines.]
Local impact gardening and redistribution of each exposed regolith ejecta zone after deposition also enhances uniformity and, apparently, continuously develops a uniform cosmic ray exposure age throughout the zone. This uniformity is suggested by the two similar cosmic ray exposure ages (610 and 550 Myr; Eberhardt et al., 1974) reported for zone Y+Y* at different depths, assuming that error limits (average ± ~40 Myr, Eugster et al., 1977) are comparable to those given in Table 13.5↑ in §4.0.
There remains a question as to why the detailed petrographic analyses of Vaniman et al. (1979) and Taylor et al. (1979) do not show more uniformity, although the major variations shown are generally consistent with the zone delineations made above. Also, all but one zone (W) have more than one chemical analysis by Laul (§5.0), and those compositions are very similar to each other within a given zone. The answer to this question may lie in the fact that petrographic integration of particles of the size counted in thin sections would be more difficult in the parabolic time available than would be the integration of intensive variables, such as previous zone cosmic ray exposure ages and bulk composition carried by the fines <150 µ.
Each corrected cosmic ray exposure age in column 5 of Table 13.13↑, therefore, can be assumed to be the integration of the cosmic ray exposure ages of all the regolith ejecta zones that existed to the excavated depth of regolith at the site of their respective source crater, plus each zone’s post-deposition exposure age (column 5, Table 13.15↑). If the ∆Is/FeO-based exposure age for a given deep drill core zone is subtracted from the total cosmic ray age, the remainder is the integration of the exposure ages of the ejected zones. A question remains about how deep does a large crater excavate local regolith. Although much smaller than the large source craters, the flat floor of Rudolph Crater suggests that regolith is ejected down to the major change in geotechnical parameters.
The logging of each regolith ejecta zone in the deep drill core might give an indication of the maturity index of that zone at the time of deposition (Is/FeOm in Column 3, Table 13.1a↑). These pre-existing maturity indices can only be estimated to within about 5 points in the half-cm log of Is/FeO raw data discussed in §4.2. The exact value for Is/FeOm is obscured by the probable Is/FeO resets caused by the source crater impact as well as by the post-deposition interaction of impact induced Is/FeO resets and Is/FeO increases between resets. The indicated total cosmic ray exposure age of a given core zone (Table 13.16, col. 4) would include the ∆Is/FeO-based post-deposition exposure age for the zone (Table 13.16, col. 3); however, the difference between this total and the post-deposition exposure age would reflect an independent value for the zone’s deposition Is/FeOm.
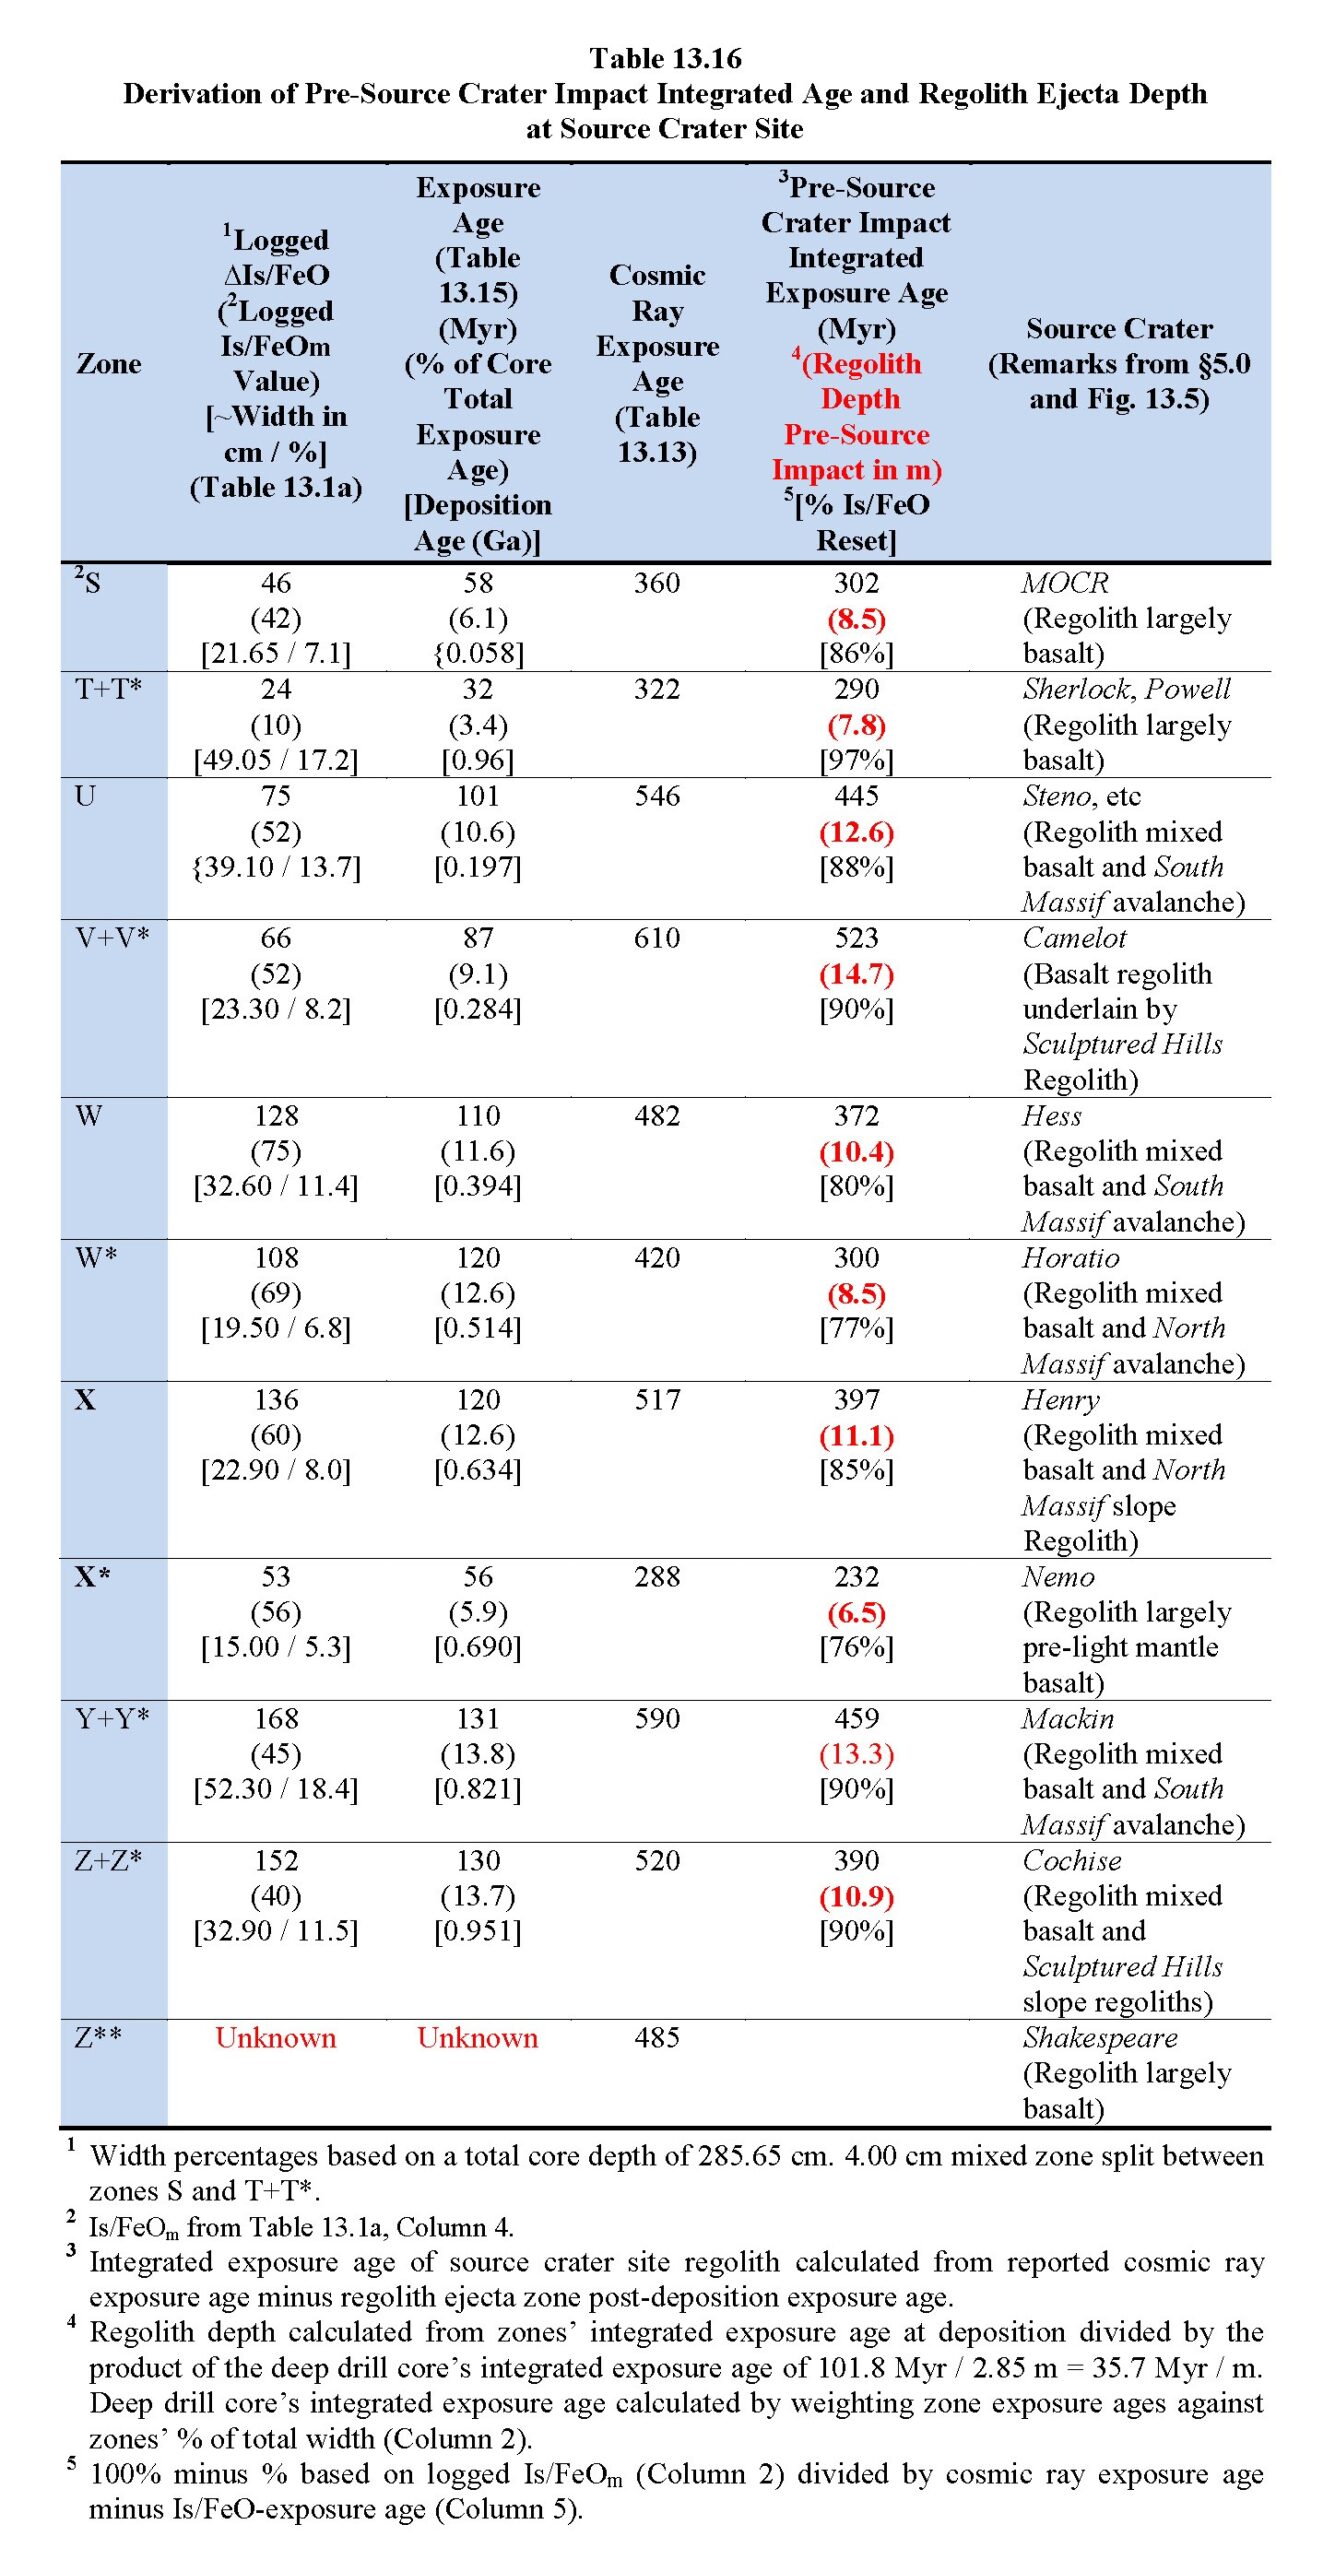
Link for Table 13.1a↑.Table 13.16 compiles the data necessary to extract the following conclusions about the pre-deposition source regolith using reported cosmic ray exposure ages:
1. Subtraction of the ∆Is/FeO-based exposure age for a given deep drill core zone (Column 3) from the total cosmic ray exposure age (Column 4) gives the integrated exposure ages of the ejected, pre-source crater regolith stratigraphy (Column 5).
2. A comparison of a deep drill zone’s logged Is/FeOm-based exposure ages (Is/FeOm in col. 2 times Is/FeO / Myr from Table 13.15, col. 4) ages for initially deposited regolith (col. 4) with the integrated exposure ages of pre-source crater regolith (col. 5) indicates 77-96% resetting of pre-impact Is/FeOs has resulted from the source crater impacts (col. 5).
3. An estimate of the depth of ejected, pre-source crater regolith (col. 5 red figures) for each zone can be made by dividing both the zone’s total, pre-burial exposure age (pre-source crater integrated exposure age) (col. 5) by width-weighted integrated exposure age of the deep drill core (101.8 Myr) for the deep drill core depth through zone Z+Z* (2.85 m). This estimate equals 35.7 Myr per meter. The results of these calculations range from 14.7 to 6.5 m (col. 5 red figures) for the pre-source crater impact depth of regolith. These values are consistent both with previous estimates of a 11.5 m regolith depth at the deep drill core site and with the variable geological locations of source crater impacts.
4. The pre-source crater impact regolith depth associated with zone V+V* (14.7 m) probably reflects (1) the core site being within one crater diameter of source crater Camelot and (2) deep, pre-source crater regolith due to the superposition of post-basalt regolith on pre-basalt Sculptured Hills regolith.
A plot of the ratio of zone width to core distance from its source crater against ejected regolith volume (Table 13.17; Fig. 13.21↓ ) shows: (1) source craters of various ages that are within ~2 km or outside ~3 km of the core site deliver relative thin regolith ejecta thicknesses (Group A); (2) source craters of various ages that are within 2.5 and 3.0 km of the core site deliver relatively large regolith ejecta thicknesses (Group B), confirming the earlier conclusion in Fig. 13.8↑; (3) the 1451 m diameter source crater MOCR Crater for zone S falls outside the systematics of the 400-800 m diameter source craters; and (4) the A and B groupings of craters in Fig. 13.21↓ are consistent with the parabolic ejecta sheath hypothesis proposed in §3.3.
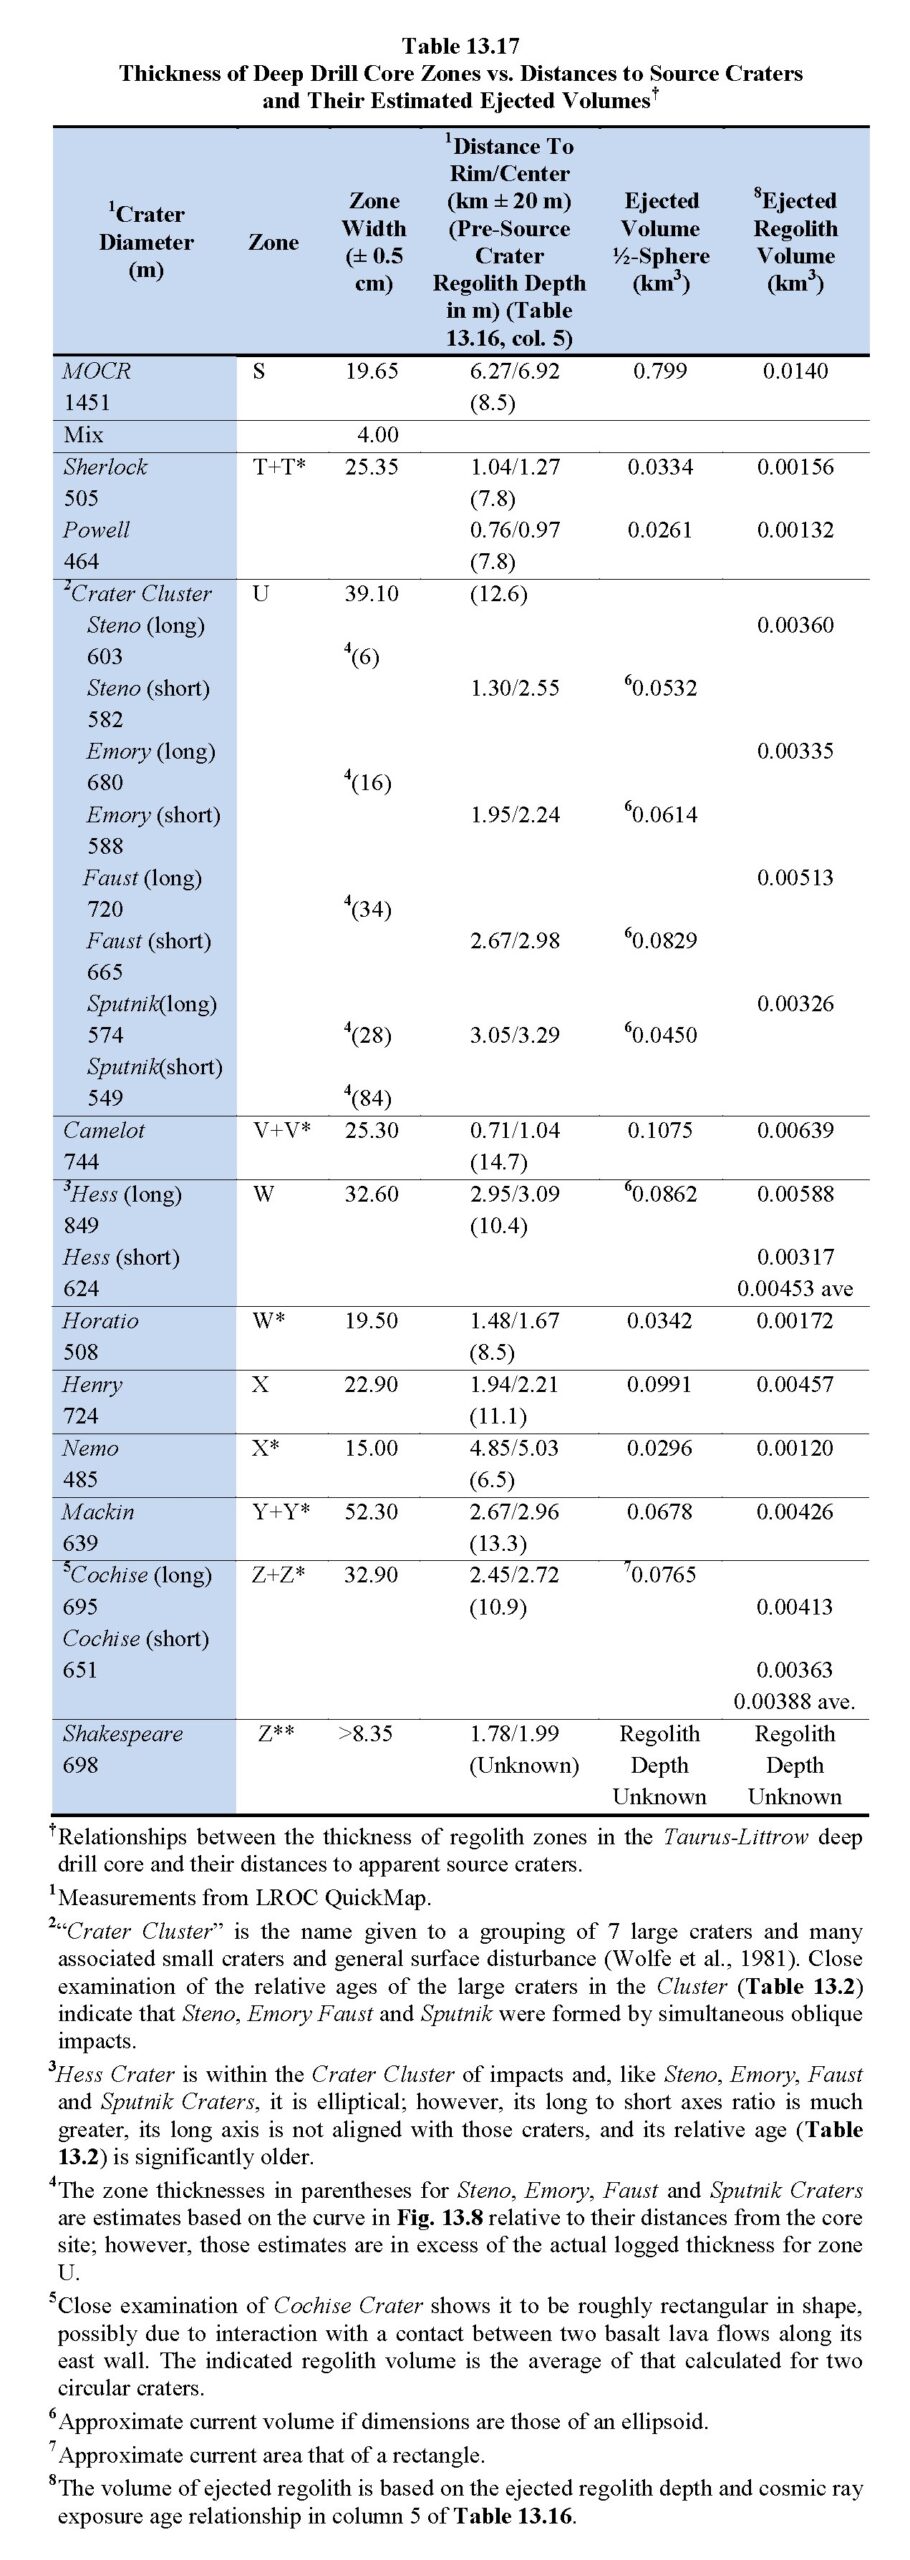
Links for Table 13.2↑, Fig. 13.8↑ and Table 13.16↑.
 Fig. 13.21. Plot of the ratio of zone thickness to core distance from its source crater against ejected regolith volume (Table 13.16↑, col. 5).
9.0 Rate of Impact Is/FeO Resets Recorded in Deep Drill Core and Apollo 17 Neutron Probe Stratigraphic Interpretation of Deep Drill Core
9.1 Rate of Impact Is/FeO Resets
Combining the estimates of exposure ages in Table 13.15↑, col. 5, with the number of impact resets of Is/FeO in Table 13.5↑ provides a rough measure of the meteor flux causing small scale resets at Taurus-Littrow over the last 0.951 billion years. Table 13.18 gives an estimate of a reset every 5.7 ± ~1.5 Myr, not including the low rates for zones W* and X* or the probable high rate for zone T+T*. The impact rates suggested for zones W and X* may reflect actual times of anomalously decreased impactor flux or just increased uncertainty in their exposure ages, as noted previously. The variations in the dynamics of the Solar System that would result in flux variations might reflect the interactions of Jupiter with the Main Belt Asteroids.

Link for Table 13.1a↑.[The inclusion of zone U in the average of reset frequency may be coincidence as there is strong evidence (§5.0) that this zone was deposited as a consequence of the simultaneous impact of four cometary objects (hemispherical source craters Steno, Emory, Faust and Sputnik) and that its flux of “Is” reset impactors included cometary debris.]
9.2 Apollo 17 Neutron Probe Stratigraphic Interpretation of Deep Drill Core
Curtis and Wasserburg’s (1975) interpretation of stratigraphic variations in the neutron exposure of the deep drill core tend to roughly support the zone stratigraphy and ages given in Table 13.15↑. They report the following:
- An upper ~52 cm of the core at ~100 g/cm2 that is well mixed with an estimated exposure age of 100-200 Myr with average fluence of 2.3×10¹⁶ n/cm2, (The depth estimate uses an average regolith density = 1.91 g/cm3 (Heiken et al., 1992, their Table 7.14) to convert g/cm2 to depth.). This depth is roughly consistent with the combined zones S and T (~51 cm in Table 13.1a↑, including the 4 cm mixed zone between, and combined exposure ages of 96 Myr in Table 13.15). If Curtis and Wasserburg’s data actually includes zone U, the combined exposure ages at 197 Myr would be well within their given range of 100-200 Myr.
- An intermediate ~210 cm thick unit at 100-500 g/cm2 or thicker with average fluence of 3.5 × 10¹⁶ n/cm2 and that is poorly mixed. (The thickness estimate uses an average regolith density = 1.84 g/cm3 (Heiken et al., 1992, their Table 7.14) to convert g/cm2 to depth.) This would roughly include zones U-Y+Y*. These five zones have highly varied maturity and petrography and are made up of regolith ejecta of mixed compositional parentage.
- A deep layer of lightly irradiated materials (<1016 n/cm2) that would be ~30 cm thick and roughly include zones Z+Z*and Z**. The reduced irradiation may be the result of less exposure to neutron fluence relative to zones higher in the core.
10.0 Geology and Maturation of Orange+Black Ash at Shorty Crater
10.1 Geological Context of the Orange+Black Ash Deposit
The discovery, examination, imaging, sampling and post-mission analyses of a deposit of orange and black pyroclastic ash on the rim of the 110 m diameter Shorty Crater (Schmitt 1972, 2014a, 2014b) has provided detailed insights into apparent ash deposits lunar mappers previously only inferred to be present through analysis of images obtained from Earth and lunar orbit (Wilhelms, 1987). Synthesis of various studies of sample 74220 from a half-trench dug across the deposit and of a 70 cm drive tube core (74001/2) of the ash deposit, show that the deposit was the result of at least 5 and possibly 7 separate pyroclastic eruptions that took place between ~3.82 and 3.60 billion years ago.
Orbital images (Wolfe et al., 1981) as well as regolith samples from elsewhere in Taurus-Littrow (§5.0) indicate that the erupted ash covered thousands of square kilometers in the region. Over the last 3.6 billion years, the ash has been incorporated into most of the regolith materials sampled (Meyer, 2012). As will be discussed in §11.0, the specific ash sampled at Shortly Crater fortuitously was protected from such redistribution by a subsequent ejecta blanket of light gray regolith (samples 74240 and 74260) from an impact that formed Fitzgibbon Crater about 24 Myr after the last ash eruption (Eugster et al., 1981a).
The orange+black pyroclastic ash deposit resulted from repeated pyroclastic eruptions over a period of at least 127 Myr (Eugster et al., 1981a). These eruptions occurred between the last basalt lava eruption at 3.82 ± 0.04 (Schaeffler et al., 1977) and the last ash eruption at 3.60 ± 0.05 (Huneke, 1978). The 70 cm drive tube core provides a continuous section of ash strata without clearly identifiable regolith development between ash depositions. An X-ray image (Meyer, 2012) of the unopened drive tube shows a full, “72 cm” tube. (This dimension is in error as the double drive tube maximum length is 70 cm.) After extrusion during curation, however, the final core measured 66.3 cm (Nagle, 1978b), a compression of 3.7 cm.
[In order to compare apples with apples, this synthesis generally will use 39-40Ar ages as reported, realizing that the 40K decay constant, an essential component in 39-40Ar age dating, has been re-evaluated (Carter et al., 2020; Noumenko-Dezes et al., 2018; Renne et al., 2010). For what is interpreted here as the last ilmenite basalt lava eruption in the valley, Mercer (pers. comm., 2015; Schmitt et al., 2017) recalculated Schaeffler et al.’s (1977) 39-40Ar age of ~3.82 ± 0.05 Ga to 3.795 Ga for 70215, a 0.52% decrease; however, the relative differences in 39-40Ar ages constitute the main points in these following discussions.]
This synthesis has identified 5-7 orange+black ash layers within 74001/2, based on comparisons of the X-ray image given by Meyer, the descriptive work of Nagle (1978b), and grain size data of McKay et al. (1978) and Graf (1993). The major, well-defined units from younger to older (top to bottom in core), and using the extruded core length of 66.3 cm, are as follows (Fig. 13.22a↓):
- Unit 5 (0-12 cm): 60-90% orange ash.
- Unit 4 (12-25 cm): Largely black ash (15-25% orange ash).
- Unit 3 (25-37 cm): Weakly stratified black ash (~15% orange ash).
- Unit 2 (37-54): Massive black ash (~5% orange ash). From major differences in cosmic ray exposure ages and slight variations in internal stratigraphy, Unit 2 appears to be the result of three separate eruptions (2, 2a and 2b).
- Unit 1 (54-66+ cm): Massive black ash (~5% orange ash) with reversed ash particle grading (large to small with depth) in “weakly stratified” portions. The X-ray image artist indicates a lighter image response to x-ray than for units 2-5.
From this synthesis, it appears that the core 74001/2 penetrated upright units 5 through 2 before crossing the partially overturned axial plane of an anticlinal fold in unit 2 and then into a portion of Unit 1 (see Fig. 13.22b↓). Folding and overturning of the deposit was the result of radial forces generated by the Shorty Crater impact. It is not known, of course, if older eruptive ash units exist below unit 1; however, the Hasselblad image (AS17-137-20994, Fig. 13.22c↓) of an estimated ~0.5 m thick, black ash layer in the 15 m vertically high north wall (Lunar QuickMap) of Shorty Crater suggests that the 70 cm drive tube core would have penetrated the original thickness of the deposit of ash strata had it not entered the axial area of unit 1 (see Figs. 13.22b,c). It would appear, then, that unit 1 is probably the first ash to be deposited.
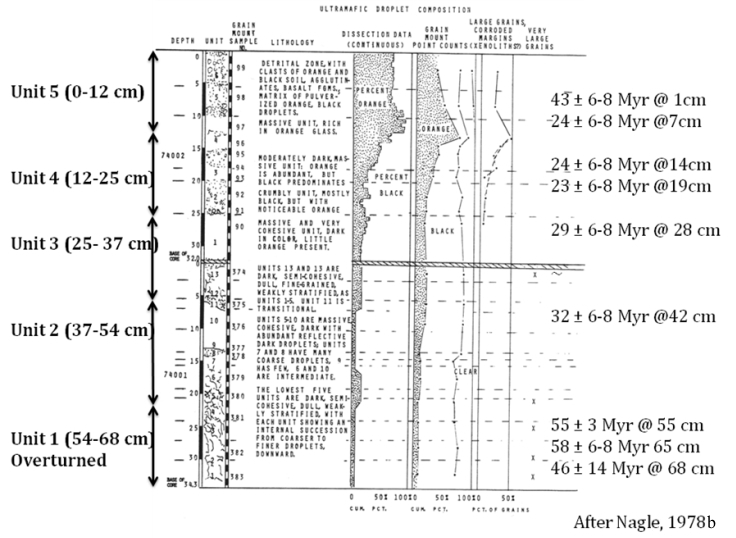 Fig. 13.22a. Stratigraphy and exposure ages (Eugster et al., 1981a) of core 74001/2 (after Nagle, 1978b).
 Fig. 13.22b. Schematic cross-section of orange+black pyroclastic ash deposit at Shorty Crater (Station 4) in relation to drive tube core 74001/2 and sample 74220.
 Fig. 13.22c. The color corrected version of AS17-137-20994 showing the inclined black ash streak at the top and upper middle of the northern wall of Shorty Crater above the principal fiducial cross (from Fig. 11.108a in Chapter 11, Schmitt, 2024b).
The depositional context of the orange+black ash deposit at Shorty Crater is intriguing on a number of levels. At least five individual eruptions over at least 127 Myr are indicated by (1) the sum of the cosmic ray exposure ages reported by Eugster et al. (1981a) and Eberhardt et al. (1974) (Table 13.18↑), and their correlation with apparent petrographic variations suggested by Nagle’s (1978b) report; (2) the x-ray pre-extrusion image (Meyer, 2012); and (3) grain size variations (Graf, 1993). This estimate, of course, does not include Unit 5’s exposure age (24 Myr) prior to its burial by regolith ejecta from Fitzgibbon Crater or the ages of potential older deposits below Unit 1. If the possible two additional eruptions suggested as part of Unit 2 (2a and 2b) are included, based on an average exposure age of Units 2-4 being ~26 Myr, this eruptive period extends to a possible 179 Myr. 179 Myr would consume most of the ~220 Myr between the last basalt eruption at 3.82 Ga and the last ash eruption at 3.60 Ga.
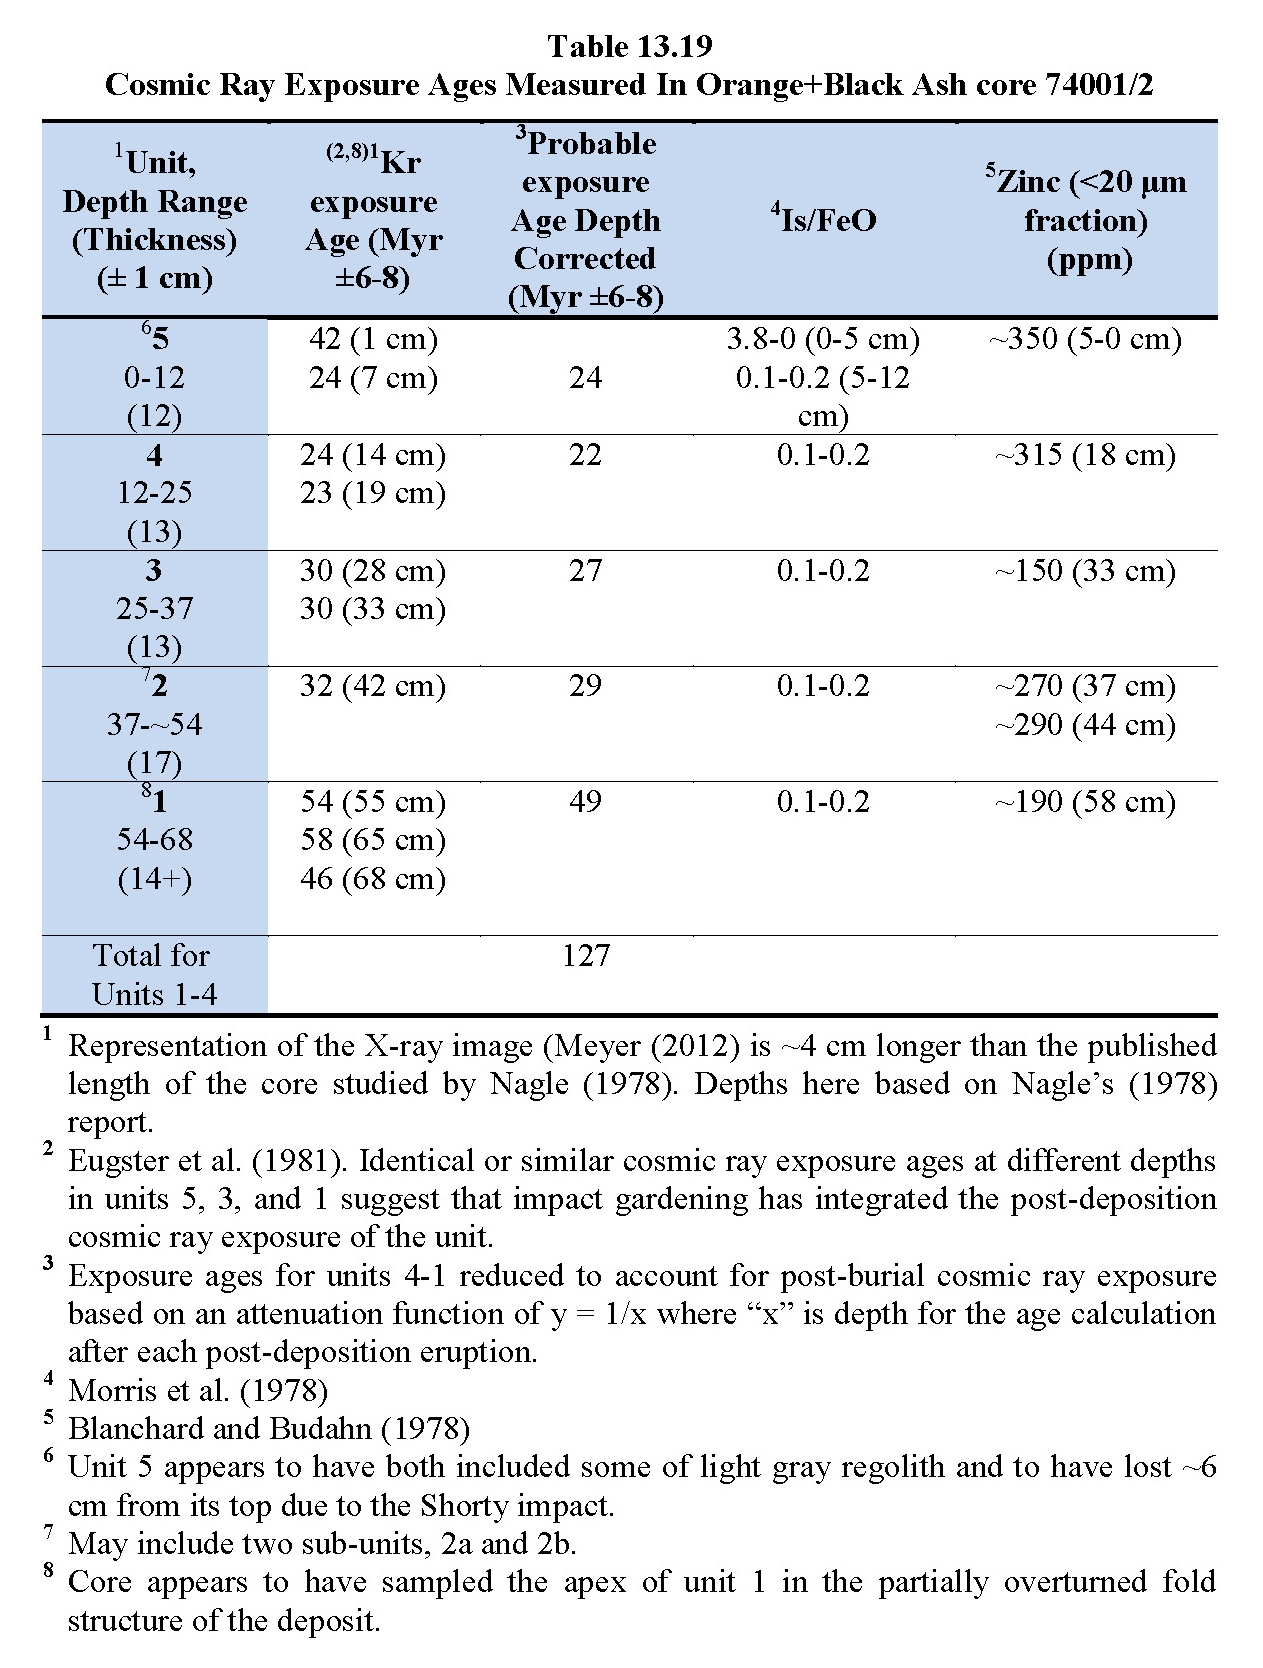
Links for Meyer (2012), Nagle (1978b), Eugster et al. (1981a), Morris et al. (1978), and Blanchard and Budahn (1978).Column 5 of Table 13.19↑ are the reported concentrations of zinc at various levels in core 74001/2 (Blanchard and Budahn, 1978). The variations may indicate an increase in volatiles late in the eruptive period; however, some zinc would be lost to volatilization during impact gardening between eruptions.
10.2 Regolith Development on Ash Deposits
In spite of exposure of each new ash deposit to space for tens of millions of years, Is/FeO values are near zero throughout all but the youngest deposit (Morris et al., 1978; Fig. 13.23↓, below) and petrographic data do not indicate any compositional variations at the top of ash units other than the topmost unit 5 (Blanchard and Budahn, 1978; Meyer, 2012). As Is/FeO is a product (§6.0) of solar wind proton radiation, impact plasma reduction, and alpha+beta decay radiation, this fact reflects an extreme example of both the absence concentrated crystallographic Fe++ in glassy orange ash and the continued dissemination of uranium and thorium in the residual glass of partially devitrified ash. Both distributions result in very low rates of conversion of Fe++ to nano-phase iron by proton, impact plasmas, or alpha+beta radiation (see §10.1, Table 13.19↑, Column 4; Fig. 13.23↓).
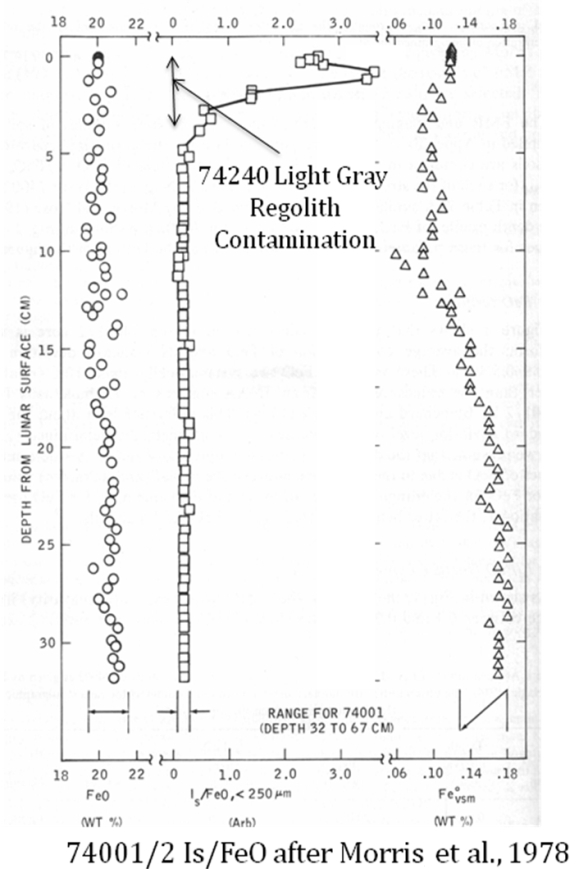 Fig. 13.23. Is/FeO in drive tube core 74001/2 that sampled the orange+black pyroclastic ash deposit in the rim of Shorty Crater (after Morris et al., 1978).
The Is/FeO values are up to 3.6 in the upper few cm of the youngest ash unit (Unit 5), in contrast to being near zero for the rest of the 66 cm drive tube core. This indicates contamination in the upper portion of Unit 5 from the light gray regolith that buried it. Non-ash particles (agglutinate+basalt+low grade breccia) are reported as 6 modal% in 74220 (Heiken and McKay, 1974) and as 18 modal% in the top of core 74002 (McKay et al., 1978). No such contamination is reported by Nagle for lower units in core 74001/2. The reported cosmic ray exposure ages for the non-core surface sample of Unit 5 (74220) is reported as 27 Myr (Hintenberger et al., 1974). Eugster et al. (1981a) reported 42 Myr for the top 1 cm of core 74002 and 24 Myr at both 7 and 14 cm. If Unit 5 contains ~12 modal% light gray regolith (mean of the reported 6 modal% and 18 modal%) with a cosmic ray exposure age of about ~160 Myr (Eugster 1985; see §4.2 and Table 13.5↑), this would be equivalent to an additional ~19 Myr, and, if added to the 24 Myr measured at 7 and 14 cm, it would move the age close to Eugster’s 42 Myr value for the contaminated 1 cm at the top of the core.
The ~46 Myr exposure age for the oldest sampled ash deposit, Unit 1, if it is also the first ash erupted, when compared to the ~25.5 ± 3.5 Myr average exposure ages for younger units may indicate that, after an extremely large initial eruption, the magma/volatile system settled into periodic eruptions about every 25 Myr.
The two sets of identical cosmic ray ages taken at different depths for the lower portion of Unit 5 (24 Myr) and for Unit 3 (30 Myr), along with the similar ages (54 and 58 Myr) at different depths in Unit 1, suggest that impact gardening integrated depth variations in the effects of varying surface exposure within each ash deposit. This consistency also indicates that the gardening rate was rapid enough to make the measured exposure age about the same at every depth in those units. With some depth-weighted (y = 1/x) reduction for post-burial, attenuated exposure, the ages in Column 3 of Table 13.19↑ probably are close to the actual exposure ages. The total exposure age for Units 1-4 of ~127 Myr would represent the minimum length of the eruptive period. If the existence of two additional sub-units in Unit 2 is correct, and an average exposure age of 25 Myr is added to this 127 Myr for those two sub-units, the minimum eruption period would be ~177 Myr.
As noted above, the lack of significant values of Is/FeO in the 74001/2 core (Morris et al., 1978) can be explained by the dominance of volcanic glass in the core. Regolith formation on the ash units after each eruption, therefore, would have been almost solely by micro-meteor impact, the effects of which would be largely indistinguishable from the glass, glass shards, and scoria in the primary ash. The absence of measurable variations in maturity between the units’ Is/FeO values also indicates that micro-meteor impact plasmas have had in increasing Is/FeO values in either glassy or partially devitrified ash.
A very detailed, continuous size-frequency/fragment characterization profile of core 74001/2 might confirm the tops of each five to seven ash deposits. For example, the relative proportions of fine and coarse ash particles with depth should change during exposure to the micro-meteor flux. As a preliminary check on the possibility of seeing an effect of commutation by micro-meteor impacts, Fig. 13.24 shows a plot of the ratios between <20 µ and 45 µ (o, o) points) and the <20 µ and 90+150 µ (x) size fractions from various depths, using raw data determined by D. S. McKay (Graf, 1993).
 Fig. 13.24. Grain-size frequency trends in ratios for <20µ / 45µ (o, o) and <20µ / 90+150 (x) in the double drive tube core 74001/2 into the orange+black ash deposit at Shorty Crater and for bulk sample 74220, based on D. S. McKay’s data in Graf (1993). The horizontal dotted line shows the possible consistent ratios for the tops of units 2-5.
The plots in Fig. 13.24 suggest the following:
- Although the plot indicates that the ash from successive eruptions tended to become relatively finer, it does not give unequivocal confirmation of the tops of the various units proposed in Table 13.19↑.
- Taken in isolation in Fig. 13.24, <20µ / 45µ ratio points (red (o) points) at the tops of Units 5, 4, 3, and 2 reported at 6, 18, 26 and 37 cm, respectively, have values that nearly are identical (2.50 ± 0.05). These same points, however, also are in the scatter that defines the two trends in the change in ratios relative to depth and relative age.
- Radial forces from the Shorty impact planed off top of Unit 5; however, scoop sample 74220 came from that unit with a mixed depth of about 7-17 cm (reported 1-10 cm, adjusted for about 6 cm of deposit being planed off by those forces). Size-frequency data from the 74220 sample gives mixed results, with 74220’s <20µ / 45µ ratio plot being intermediate between the two linear trends.
- The <20µ / 90+150µ ratio for 74220 plots well below both linear trends, but its value showing greater coarseness may be reflecting the 6-18% admixture of light gray regolith.
- There are indications that Unit 2 may be a composite of three deposits, if this is not the case, the plots for Unit 2 would indicate grading from fine to course with increasing depth.
- The anomalous position of both ratios for Unit 1 at 58 cm relative to the two trends for other units may reflect the probability that Unit 1 was the product of the first orange+black ash eruption with a size-frequency distribution that is distinct from the four, more periodic eruptions that followed.
10.3 Deposition Ages of Orange+Black Ash Deposit
The ages reported for the last eruption of orange+black ash, 74220 (Unit 5) include Tera and Wasserburg’s (1976) Pb-Pb 3.48 ± 0.03 Ga and five 39-40Ar ages for 74220 compiled by Meyer (2012) that are all older than 3.48 Ga by 60 to 230 Myr. The most likely age in the latter group for the last eruption of orange+black ash, is 39-40Ar 3.60 ± 0.04 Ga (Huneke, 1978), preformed on undevitrified, rapidly cooled glass beads from sample 74220. Alexander et al., (1980) also report a 39-40Ar age on similar glass beads of 3.66 ± 0.03, matching that of Huneke within error limits.
The Huneke age would put the last orange+black ash eruption at about 220 Myr after the last basalt lava eruption at 3.82 ± 0.05 Ga (Schaeffler et al., 1977).
[Schaeffler et al.’s 39-40Ar analysis was of a very fine-grained armalcolite+ilmenite intergrowth (early crystallization) in ilmenite basalt sample 70215. This age of 3.82 ± 0.05 Ga is supported by an identical age for sample 75055 reported by Kirsten et al., (1973).]
As this interval based on the Huneke age encompasses the possible 177 Myr minimum total of cosmic ray exposure ages (Eugster et al., 1981a) from ash units in the core 74001/2 (not including the last unit, Unit 5), it will be used in this discussion. Huneke’s age would indicate that ash eruptions began soon after 3.82 ± 0.05 Ga (3.60 Ga + ~177 Myr = 3.777 Ga).
A39-40Ar age of 3.654 ± 0.020 Ga (Saito and Alexander, 1979) on partially devitrified ash from an unreported depth in the lower core 74001 is the only published 39-40Ar age for an ash eruption earlier than the last. Eugster et al. (1978) report a K/Ar age = 3.64 ± 0.10 Ga for 74001 that straddles the Saito and Alexander age of 3.654 ± 0.020 Ga. The Saito and Alexander age is ~54 Myr older than Huneke’s age, suggesting that their sample came from the upper part of the ash sequence in 74001 when matched against the possible minimum of ~177 Myr for the eruptions sampled by the core. As a visualization aid in relation to these and other events, Fig. 13.25 shows the sequential relationships for reported 39-40Ar ages for the events surrounding the orange+black ash eruptions.
 Fig. 13.25. Schematic visualization of reported 39-40Ar ages related to orange+black pyroclastic ash eruptions, as well as the single available date on VLT (green).
The stratigraphic and regolith development constraints on the representations in Fig. 13.25, anchored to the reported 3.82 ± 0.05 39-40Ar age for the last ilmenite basalt eruption, are as follows:
- The 39-40Ar age for the last orange+black ash eruption of 3.60 ± 0.04 Ga (Huneke, 1978) implies that the first eruption was >127 Myr, and possibly >177 Myr earlier (>3.77 Ga), based on the sum of exposure ages of earlier ash units given by Eugster et al. (1981a), that is, pyroclastic eruptions began shortly after the last ilmenite basalt lava eruptions at 3.82 Ga.
- The last basalt eruption, with a 39-40Ar age of 3.82 ± 0.05 Ga (Schaeffler et al., 1977) falls within the ± 40 Myr error limits extrapolated from Huneke’s measurement and supports the conclusion that orange+black ash eruptions closely followed the last ilmenite basalt lava eruption. This probability also is supported by the observation of an apparent ash layer mixed with basaltic rubble in the Station 1 crater wall (Chapter 10).
- The last ash deposit at Shorty Crater was exposed for 24 Myr to cosmic rays (Eugster et al., 1981a) before being covered and protected for ~3.5 billion years by the light gray regolith ejecta blanket from nearby Fitzgibbon Crater.
- Solar wind impingement on the lunar surface began with the demise in the strong lunar magnetic field between the deposition of the last two ash units (Units 4 and 5), that is, just before 3.60 ± 0.04 Ga, providing a refinement of the 3.54 Ga age for the field’s decline estimated by Tikoo et al. (2017).
The observation of an apparent layer of black ash mixed with ilmenite basalt rubble in the wall of the crater at Station 1 (Chapter 10; Schmitt, 2024a) indicates that ash probably erupted soon after the last basalt eruption, as such a surface rubble zone would develop on top of the last lava flow in that location. This rubble and the associated ash, however, appear to be part of the ejecta blanket surrounding Steno Crater.
[The possibility that black ash overlies the basalt rubble may indicate that the crater at Station 1 penetrated a relatively thin ejecta blanket from Steno Crater to near basalt bedrock. Otherwise, the younger ash would be expected to underlie rubble due to overturn of the ejecta blanket. Detailed image analysis of the available Hasselblad photographs of the Crater at Station 1 might answer these questions.]
The careful descriptive work of Nagle (1978a, 1978b) shows no evidence of non-ash, regolith ejecta in core 74001/2, in spite of Eugster et al.’s (1981a) cosmic ray exposure age evidence that orange+black pyroclastic eruptions took place periodically over at least 127 Myr. Although surprising, the fact that local ash accumulations would not include non-ash, regolith ejecta from impacts in the valley over that length of exposure is plausible, none-the-less. Impacts that would penetrate a half-meter or more of ash in that length of time would be rare but possible. Ash ejecta and impact glass from the more frequent but smaller impacts, including impact-derived shards, agglutinates and breccias, from impacts that did not penetrate the ash deposits, of course, would be difficult to detect or to differentiate from pyroclastic ash if, indeed, scoria were produced during an eruption.
Impact craters greater than half-a meter deep would be more than ~2.5 meters in diameter (Pike, 1974) and would not accumulate at a saturation size-frequency in a few tens of Myr. Also, coarse ash “compound particles,” noted by Nagle, actually may be ash “agglutinates” rather than scoria, as pyroclastic eruptions in vacuum initially would produce largely fine ash particles due to vacuum enhancing the rapid release of dissolved volatiles in the parent magma. Additionally, in §9.1, it is estimated that small macro- and micro-meteor impacts appear to have occurred close to the deep drill core site with a frequency of every 5.8 Myr. Impacts capable of penetrating more than 0.5 m of ash would occur exponentially less frequently.
10.4 Pyroclastic Record of the Decline of the Ancient Lunar Magnetic Field
Tikoo et al.’s (2017) estimate that the ancient lunar magnetic field was at ~110 µT between 4.25 and 3.56 Ga might be partially tested with the Shorty Crater ash samples, as their latest deposition age (Unit 5), at 3.60 Ga, is older than Tikoo et al.’s estimate for the timing of the field’s decline. An independent evaluation is possible as to when the magnetic field decline reached a point where solar wind ions could again impact areas away from north and south lunar dipole poles (Nichols et al., 2021). If it can be shown that the solar wind was impacting one of the ash units around 3.56 Ga and not impacting older units, the Tikoo et al. estimate would look very good.
Unit 5 at the top 74002 does show some signs of maturation (Is/FeO < 3.8); however, that could be attributed to contamination from overlying light gray regolith (Is/FeO = 5) as noted above. On the other hand, there is significant isotopic evidence that the youngest unit (Unit 5) was exposed to the solar wind, whereas, the lower units sampled by the core (74001/2) were not so exposed.
For example, the 4He/3He ratio reported by Eberhardt et al. (1974) for 74220, equivalent to Unit 5 of the core, is 2760, and is only slightly higher than what these analysts reported for the deep drill core zones (2540-2720). This indicates solar wind helium implantation in Unit 5. In contrast, Eugster et al. (1979) report 4He and 3He contents that give 4He/3He ratios for units below Unit 5 as follows:
- 5 gm/cm2 (~33.6 cm, Unit 3) – 761
- 5 gm/cm2 (~39.5 cm, Unit 3) – 653
- 5 gm/cm2 (~53.5 cm, Unit 1) – 475
- Average – 630
Similarly, Eugster et al. (1981a) report data that give 4He/3He = 473 at 144 gm/cm2 (~62.9 cm, Unit 1), lowering the above average 4He/3He to 591. This is a factor of 4.7 less than for 74220 and Unit 5 in core 74002, indicating no exposure in these older units to solar wind helium, but possibly indicating the primordial 4He/3He of the ash volatile source was roughly 591.
[The depths of samples reported by Eugster et al. (1979, 1981a) have been estimated by using densities reported by Mitchell et al. (1973), that is, 2.04 gm/cm3 for 68.5 gm/cm2, apparently from upper core 74002, and 2.29 gm/cm3 for three other measurements, reported to be from lower core 74001.]
Nitrogen isotopic data, reported as δ15N‰, paint a similar picture to those of helium. Kerridge et al. (1991) report that, at 13.5 cm (Unit 4) and below in the core 74001/2, δ15N‰ values are all positive. δ15N‰ values in 74220. In contrast, they report that, at the top Unit 5 of the orange+black core sample (74002), δ15N‰ is trending from positive values of around +20 toward the current negative values in the current solar wind (δ15N‰ = –118). This trend is analyzed in more detail in §6.2.
The above data on helium and nitrogen isotopic ratios indicate that the decline of the field began before 3.60 ± 0.04 Ga, supporting the Tikeo et al., estimate of 3.56 Ga, particularly if the new 40K decay constants are applied to the 39-40Ar age of 3.60 Ga. Kerridge et al.’s report positive δ15N‰ values in Unit 4 at 13.5 cm, whereas, they are negative in Unit 5 affirming this conclusion.
The calculated Unit 1 39-40Ar ages indicate that pyroclastic orange+black ash eruptions began very close to the end of ilmenite basalt lava eruptions. Based on their distinct, chondritic isotopic ratios (Ketterige et al., 1991), this close timing relative to the end of basalt eruptions suggests that rising pyroclastic volatiles, evolved in the post-basalt migration of warming into a chondritic lower mantle, helped create new magma reservoirs by lowering melting points in the upper mantle.
10.5 Primordial δ15N‰ for the Moon
Kerridge et al. (1991) concluded that the primordial lunar value for δ15N‰ is +13 ± 1.5‰, based on analyses of pyroclastic ash taken from the Station 4 drive tube core 74001 between 55.5 and 56.5 cm depth in stratified pyroclastic ash. The average of their δ15N‰ values for orange+black ash between 56.0 and 58.0 cm is +9.6 ± 6.5‰ for heating steps 600 and 800 ºC; however, Kerridge et al. concluded that the best overall value is +13 ± 1.5‰, based on other detailed considerations. This latter value will be taken as the indigenous δ15N‰ for the source of the pyroclastic nitrogen.
Although more precise, a value for of +13 ± 1.5‰ also is consistent with the range of δ15N‰ = +0.2 to +20‰ determined by Furi et al. (2015) in their study of mare basalts derived from the upper lunar mantle. These data support a conclusion that the pyroclastic volatiles sampled in 74001/2 came from the upper portion of a relatively undifferentiated, chondritic lower mantle, i.e., the pre-magma ocean, proto-core of the Moon.
In contrast to the positive value for δ15N‰ in Unit 1, Kerridge et al.’s (1991) δ15N‰ value for the top-most 0.5 cm of ash in core 74002 is –25 ± 5‰, the average of 3 heating steps, 800, 850 and 900 °C). Relative to Unit 1, this 38‰ decrease in the value for δ15N‰ in the topmost ash deposit, Unit 5, further indicates that before 3.60 ± ~0.04 Ga the lunar magnetic field had weakened to the point that the solar wind (δ15N‰ = –118‰) was impinging on low latitude surfaces.
Based on the interpretation of the partially overturned structure of the ash deposit (Fig. 13.23↑), the Kerridge et al. (1991) analyses at 55.5-56.5 were done on the oldest of the sampled pyroclastic deposits, Unit 1. In addition, with a corrected cosmic ray exposure age of 46 Myr (Table 13.11↑) for Unit 1 at 56 cm depth, and referencing the evidence of negative δ15N‰ values near the top of Unit 5, the positive δ15N‰ value at ~4 cm below the top of Unit 1 indicates that the lunar magnetic field remained strong enough until just prior to 3.60 Ga to prevent solar wind impingement. It would be desirable to verify with δ15N‰ values for Units 2-4 that the Unit 1 value of +13 ± 1.5‰ was the original minimum value for erupted ash.
10.6 Very Low Titanium (VLT) Ash Eruptions
An important component in the modeling of sources of regolith ejecta zones in the deep drill core (§5.0) is the composition of a VLT ash bead in core sample 70007 (Vaniman and Papike, 1977). A rake sample rock, 78526, of composite VLT “green glass” (scoria) has a composition similar to the 70007 bead (Laul and Schmitt, 1975). Unlike the outcrop of stratified orange+black ash at Shorty Crater (Ch. 11 and Schmitt (2024b), Station 4), however, no coherent deposits of VLT ash were sampled at Taurus-Littow. Examination of LRO NAC stereo images by Schmitt et al. (2017) led to the discovery of several possible VLT pyroclastic fissures in the Sculptured Hills, northeast of Station 8. The suggestion that these are VLT ash fissures rather than orange+black ash is based on the apparent abundance of VLT ash (“glass other” than orange+black ash) reported by Heiken and McKay (1974) in Sculptured Hills’ regolith 78501 and 78221.
Zellner et al. (2009) reports a 39-40Ar age of 3.630 ± 0.040 Ga for a VLT glass in rake sample 71501 from Station 1. This age falls within the 3.82 to 3.60 Ga potential range of orange+black ash eruptions (§10.3, Fig. 13.25↑), indicating that the two styles of pyroclastic activity probably were contemporaneous as well as coming from independent magma sources. The association of isotopically chondritic, thermally released volatiles from the lower mantle (§10.5) with the titanium-rich orange+black ash suggests volatile induced magma formation in the upper mantle. This release of lower mantle volatiles likely was in response to migration of the crustal impact breccia-induced thermal front that produced the maria lavas as the front continued to migrate downward; whereas, the low titanium and high silica VLT ash may be related to residual liquid+volatiles from reservoirs of largely fractionally crystallized (olivine and ilmenite removed) ilmenite basalt magma sources.
11.0 Light Gray Regolith
11.1 Introduction
As discussed above, the Shorty Crater, orange+black ash deposit and its internal stratigraphy was protected for ~3.5 billion years, beginning ~24 Myr after its final eruption (3.60 ± 0.04 Ga), by an blanket of light gray regolith ejected from the nearby, ~100 m diameter Fitzgibbon Crater (working name). Samples 74240 and 74260 of this regolith, obtained from either side of the orange+black ash outcrop (Chapter 11; Schmitt, 2024b), appear to be compositionally similar to Sculptured Hills regolith 78501 (Table 13.20). This implies that the light gray regolith had developed on a nearby knob (kapuka) of Sculptured Hills-like material.
Links for Rhodes et al. (1974); Laul et al. (1981); Table 13.8jj↑; and Silver (1974).
Basalt fragments in sample 74261 of the light gray regolith give cosmic ray exposure ages of 375 ± 120 Myr for 81Kr and 331 ± 80 for 38Ar (Eugster, 1985), whereas, many other analyses indicate cosmic ray exposure ages around 160 ± 50 Myr (Table 13.5↑). In contrast, the total Is/FeO for both the light gray regolith samples is only 5 (Morris et al., 1978). Further, the light gray regolith likely had only limited exposure to solar wind protons and other ions during its active gardening due to the presence of a strong, 20-110 µT lunar magnetic field as it accumulated (Tikoo et al., 2017). Tikoo et al. report such a field existed between 4.25 and 3.56 Ga and the discussion in §10.4 indicates that the field was already minimal at the time of the eruption of the last deposit of ash at 39-40Ar 3.60 ± 0.04 Ga.
11.2 Inconsistency Between Cosmic Ray Ages and Is/FeO Values
Prior to being exposed at the lunar surface by the Shorty impact, the light gray regolith’s exposure to maturation would have been only from internal uranium and thorium alpha + beta radiation due to the presence of a strong dipole magnetic field before ~3.60 Ga (§10.4). The current U+Th content of 74260 is 1.799 (Silver, 1974). As the Sculptured Hills appear to be Imbrium ejecta, that is ~3.9 Ga in age, the mean exposure age for light gray regolith would be about 3.8 Ga, assuming an exposure age of ~160 Myr. For its current U = 0.434 and Th = 1.365 (Table 13.20↑), U and Th at 3.8 Ga would be 0.618 and 1.550 ppm, respectively, and U+Th would be 2.168 ppm,
With an alpha+beta-only ∆Is/FeO / Myr = 0.58 per ppm U+Th (§6.3.4), and with no solar proton input, the mean ∆Is/FeO / Myr = 1.26 (0.58 x 2.168 ppm) for 74260. For a cosmic ray average exposure age of ~160 Myr this gives a ∆Is/FeO = ~202 (1.26 x 160 Myr), as the minimum ∆Is/FeO in contrast to the measured 5.
The inconsistency in the estimated ∆Is/FeO relative to reported cosmic ray ages indicates impact related reset of the “Is” component of light gray regolith’s Is/FeO. The light gray regolith samples were obtained on the rim of the 110 m diameter Shorty Crater where the orange+black ash deposit and its covering light gray regolith are now exposed in a folded and partially overturned small anticline. This indicates the returned samples would have experienced significant in situ shock.
The geological history of the Shorty Crater area (Schmitt, 2017) is complex. There is cosmic ray exposure age (Eugster et al., 1981a) and GCR tracks (Goswami and Lal, 1974) evidence from samples of the shattered rim boulder (74255) indicating that the Shorty impact occurred about 2.8 to 3 Myr ago. There is additional cosmic ray exposure evidence from the boulder that, prior to the Shorty impact, it previously had been exposed at the surface for 17.8 ± 1.6 Myr (Eugster et al., 1981b).
As the 3 Myr post-Shorty exposure would add only a few Is/FeO points to the boulder, one explanation for these data is that most of the light gray regolith’s current Is/FeO = 5 is a residual of the large Is/FeO it had prior to a reset by the Shorty impact. Residual Is/FeOs are present in most impact generated regolith breccias as well as many long exposed but low Is/FeO bulk regolith samples (Morris, 1978). The pre-Shorty, ~17 Myr cosmic ray exposure of boulder 74255 probably was acquired prior to the partially overlapping Fitzgibbon Crater impact, with the boulder then being buried until the Shorty impact excavated and exposed it for another 3 Myr. This scenario appears consistent with the known facts relative to samples from Station 4 and analyses related to them.
12.0 Lunar History in Nitrogen Isotopic Data from Shorty Crater Pyroclastic Ash and Light Gray Regolith
Kerridge et al. (1991) published nitrogen isotope data for samples in the 70 cm double drive tube core of the ash deposit (74001/2). Becker and Clayton (1977) have done the same for 74240 of the light gray regolith that had protected the ash deposit for ~3.5 billion years. Is/FeO data (Morris et al., 1978) give a sequence of relative exposure to the solar wind for these samples from essentially zero (74001 at 68 cm) to an Is/FeO = 3.6 (74002 at 0.5 cm) to Is/FeO = 5 (light gray regolith 74240 on top of 74002). The δ15N‰ values for the three samples decrease with exposure as follows:
- 74001 (68 cm): δ15N‰ = +13 ± 1.5‰ (Kerridge et al., 1991)
- 74002 (3.6 cm): δ15N‰ = –25 ± 5‰ (average of 3 heating steps, 800, 850 and 900°; Kerridge et al., 1991)
- Light gray regolith 74240: δ15N‰ = –80‰ (Becker and Clayton, 1977), probably accumulated after its deposition on the ash as that would be its first exposure to solar wind.
As discussed in §10.3, the upper portion of the last ash deposit, erupted at 3.60 ± 0.05 Ga (geologically very soon after the decline in the ancient lunar magnetic field) and was exposed to cosmic rays for ~24 Myr before being shielded by light gray regolith ejecta from Fitzgibbon Crater at about 3.43 ± 0.03 Ga. (The Fitzgibbon impact penetrated the orange+black ash deposit to tap the old regolith below the ash.) The fact that there is a 38‰ decrease in δ15N‰ between Unit 1 and Unit 5 indicates that the solar wind impinged on ash Unit 5 with no evidence of its impingement on Units 1-4. After being covered by the light gray regolith, a short second exposure of about 3 Myr occurred after being uncovered by the Shorty impact.
Exposure of Unit 5 was exposed to solar wind with a δ15N‰ = –118‰ for a total of about 24 Myr (Eugster et al., 1981a). The fact that δ15N‰ = –25 ± 5‰ at the top of core 74002, versus +13 ± 1.5‰ at the bottom, indicates that ~24 Myr was required for there to be a total decrease of 38 ± 6.5‰ in δ15N‰ from an initial deposition value of +13 ± 1.5‰. The net ∆δ15N‰ / Myr = –38 / 24 or about –1.58 δ15N‰ / Myr. Note that this rate applies to the top of the core 74001/2 that is estimated to be about 5 cm below the pre-Shorty top of ash Unit 5; however, mixing within the impact gardened portion of Unit 5 probably gave that unit the same δ15N‰ value throughout.
Apparent net exposure of light gray regolith sample 74240 to solar wind after deposition on ash Unit 5 was about 51 Myr (–80‰ / –1.58). The light gray regolith would not have been exposed to solar wind nitrogen before ash deposition due to the ancient lunar magnetic field being active before about 3.60 Ga (§10.4) and after 4.25 Ga (Tikoo et al., 2017). It would not have been exposed for the first time until ejected from beneath the ash by the Fitzgibbon Crater impact. The 51 Myr apparent exposure, as well as the limit of δ15N‰ = –80‰ reached in light gray regolith rather than –118‰, represents the level of net exposure of sample 74240 to (1) impact gardening’s effective depth and (2) maturation losses of 14N over the next ~3.5 billion years. This suggests that there was a significant thickness of light gray regolith above this sample as well as the high probability of ejecta from post-Fitzgibbon impacts and deposition from the light mantle avalanches adding to shielding from the solar wind.
Relative to data on maturation, an exposure of light gray regolith to cosmic rays for ~24 Myr is about 4.5 Myr longer than the sunlit sample 76220 at Station 6 (§6.3.3) for which a proton-only ∆Is/FeO / Myr = 0.11. At that rate, hypothetically, proton-only ∆Is/FeO for 24 Myr would be about 2.6. With a U+Th = 0.874 ppm for 74220 from Unit 5, the alpha+beta contribution to ∆Is/FeO would be ~12 (0.58 × 0.874 × 24) for a total hypothetical ∆Is/FeO = ~15. With a measured ∆Is/FeO = <3.6, this hypothetical value of ~15 is further indication (1) of the attenuation effect of volcanic glass (§7.3) on nano-phase iron production and (2) that the 0-3.6 Is/FeO values in the upper 5 cm in upper core 74002 are inherited from the intermixed light gray regolith components even though the nitrogen data on upper Unit 5 of core 74002 indicates exposure to solar wind. (90-95 molar% of the 90-150 µ fraction of Unit 5 is glassy volcanic ash (Heiken and Mckay, 1974).)
Additionally, the relatively ash-free light gray regolith (~5 molar% ash in 90-150 µ fraction, Heiken and McKay, 1974) has ∆Is/FeO = 5 (74240) and 5.1 (74260). These values are still far too low, if the light gray regolith were exposed after covering the ash at 3.43 Ga and too high if the first exposure was after the Shorty impact at ~3 Myr ago.
[To evaluate the validity and possible meaning of the δ15N‰ value of –80‰ for 74241, it should be noted that the total nitrogen in 74241 is very low, that is, only ~4.7 ppm total release of nitrogen for the 900º and 1000º heating steps, as compared with 10 to 20 times that amount for most other regolith samples analyzed in the 800-1000º heating steps. Given the available facts, the most likely source of error is in the δ15N‰ value of –80. A re-analysis of δ15N‰ in 74240 and a confirming analysis in 74260 would be very helpful in this regard.]
13.0 Solar and Lunar History in Regolith and Regolith Breccias at Van Serg Crater
13.1 Introduction
The ~90 m diameter, 15 m deep Van Serg Crater (Fig. 13.26↓) is about half a crater diameter from both the rims of the ~700 m diameter Cochise and Shakespeare Craters and has penetrated their ejecta blankets, exposing underlying ilmenite basalt and ancient regolith. In addition, the ejecta blankets of those craters are overlain by regolith ejecta from the younger, deep drill core regolith ejecta zones Y+Y* through S (Table 13.1a↑), whose source craters (§3.4) are all within range of Van Serg Crater (Fig. 13.5↑) and have contributed varying amounts of regolith ejecta to the pre-Van Serg Crater surface (Table 13.21↓). The small, near-by Gatsby Crater also may have added regolith ejecta to the pre-Van Serg sample locations.
As estimated in Table 13.21, the pre-impact thickness of regolith ejecta from the source craters for zones Y+Y* through S at Van Serg Crater is probably between 3.21 and 2.34 m. The major uncertainty in the thickness of this accumulation of post-0.821 Ga ejecta comes from the degree of interaction that occurred between ejecta sheaths from the four simultaneous source impacts for deep drill core zone U. The thickness of the ejecta blankets of Cochise and Shakespeare Craters and regolith ejecta underlying those blankets is unknown; however, as the Van Serg impact penetrated to bedrock basalt, the total depth of all overlying regolith is less than 15 m, the current rim to floor depth of the crater (Lunar QuickMap). This “less than 15 m” thickness, probably on the order of 13 m when accounting for ejecta at the crater rim, is consistent with the range of regolith depths given in Table 13.16↑ (Column 5).

Link for Fig. 13.8↑.
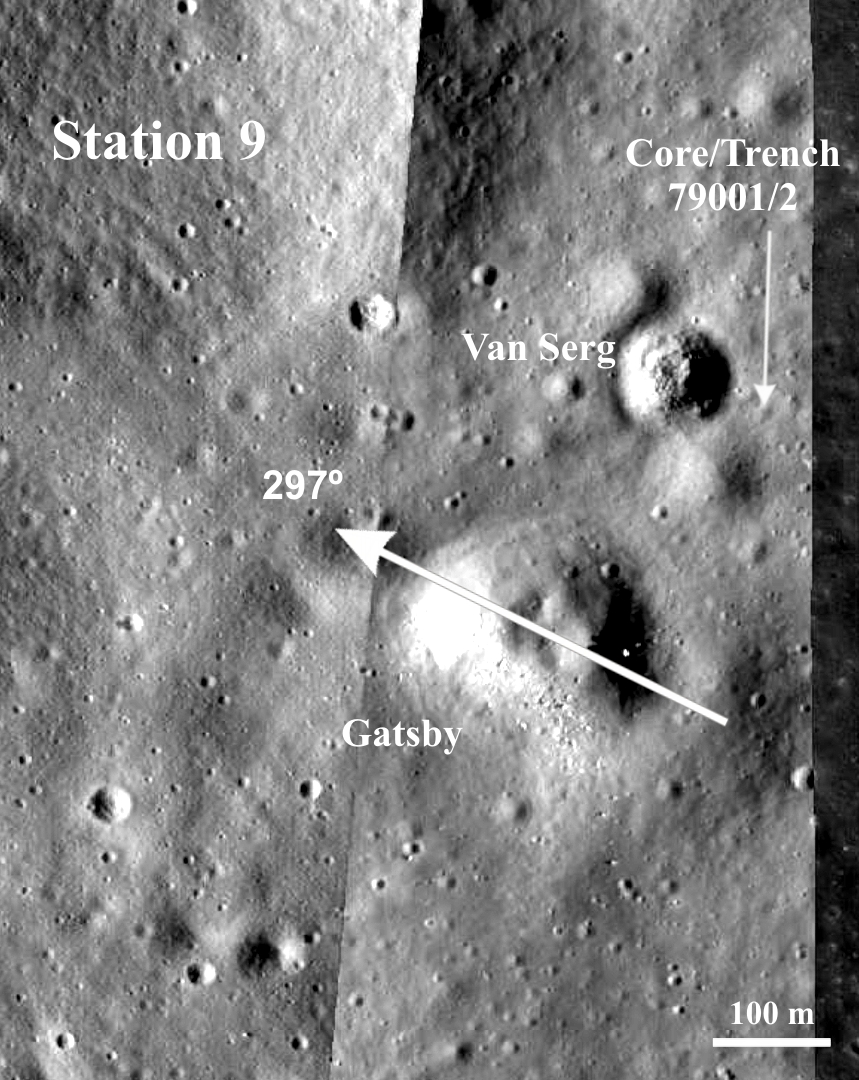 Fig. 13.26 Features in the vicinity of Station 9 at Van Serg Crater and neighboring Gatsby Crater. The latter is ellipsoidal, but may be the result of two simultaneous secondary impacts. See discussion below. (LROC Quckmap equidistant cylindrical projection).
Gatsby Crater, the rim of which is only about 100 m to the south southwest of Van Serg, is markedly ellipsoidal (270 × 230 m), with a long axis bearing of 297° and with two mounds of material on its floor (Fig. 13.26). These characteristics raise the possibility that Gatsby is the result of two relatively low velocity secondary impacts, and its near-crater ejecta blanket may extend significantly less than the crater diameter width typical of primary impacts. This may be particularly true in the direction of the site of core 79001/2 which is roughly orthogonal to the long axis trend and ~180 m from the northeast rim of Gatsby Crater (Wolfe et al., 1981). The close proximity of Gatsby Crater to Van Serg Crater, however, makes it a candidate as a source crater for some of the pre-Van Serg regolith ejecta in the sampling area.
Van Serg Crater’s floor is covered with small to large, relatively high albedo boulders and, at its deepest points, is about 15 m deep. Its forming impact may have excavated material from the deep drill core (70001/9) defned regolith ejecta zones (Table 13.21↑), as well as the ejecta blankets of Cochise and Shakespeare Craters, as indicated by the apparent basalt boulders on its floor and ejecta blanket. Gatsby Crater ejecta, if present, would lie just below Van Serg ejecta in core 79001/2. Gatsby also appears to have dark material exposed on its floor, with an area of ~1000 m2, that may correlate with the dark ejecta around Van Serg Crater.
Van Serg Crater was investigated and sampled at Apollo 17 Station 9 (Chapter 12), initially under the impression that it looked similar to Shorty Crater due to the dark albedo of its ejecta blanket. As we now know, Van Serg Crater’s dark albedo ejecta is clearly the result of the excavation of darker than normal regolith rather than concentrated pyroclastic ash excavated at Shorty Crater. Van Serg Crater also is younger than the ~3 Myr-old, ~110 m diameter Shorty Crater (§10.1; Chapter 11; Schmitt, 2024b). (Cosmic ray exposure and track analysis on Shorty’s rim boulder 74255, reported by Eugster et al. (1977) and Goswami and Lal (1974), respectively, both indicate a final exposure of 76255 at about 3 Myr from the present.)
In comparison with the ~3 Myr old Shorty Crater, the absence of friable regolith breccia around Shorty clearly shows that Van Serg is the younger crater. Yokoyama et al. (1975) estimated an age for the Van Serg event of 1.6 ± 0.5 Myr, using the content of 26Al in sample 79221 from the upper 2 cm of a half trench dug in the outer portion of the ejecta blanket. This age is consistent with the differences in the regolith breecia content of the ejecta blankets of the two craters, although the total absence of regolith breccia at Shorty suggests that the Van Serg age may be closer to 1 Myr rather than 1.6 Myr.
[Broad support for the Yokoyama et al. (1975) estimated age of 1.6 ± 0.5 Myr can be found in the lack of a ∆Is/FeO value after the last Is/FeO impact reset in core 79002. 79221’s companion sample, the original upper 2 cm of the upper double drive tube core 79002 would have been compressed to about 1.14 cm (0.57 × 2) for which Morris et. al. (1979) report two Is/FeO data points, both with a value of 87. These two data points follow an impact reset of Is/FeO from Is/FeO = 90 at 1.25 cm to 87. (see §4.1 and §4.2). No ∆Is/FeO recovery, however, is indicated in the Is/FeO values at 0.75 and 0.25 cm in 79002. The actual ∆Is/FeO for this interval therefore can not be determined from the Morris et al. (1979) data but can be assumed to be very small.]
Abundant, friable, dark gray regolith breccia fragments exist on and in the ejecta blanket surrounding Van Serg Crater and along its rim and upper inner wall. This is in sharp contrast to the lack of regolith breecia at Shorty Crater. Large, light colored boulders also are scattered across the ejecta blanket and, from a distance, resemble boulders in the lower crater wall and floor. Mistakenly, these ejected boulders were not sampled, directly, although basaltic clasts in the breccias may be representative of them.
A well-defined but irregular bench exists about halfway down the north and west inner wall of the crater and probably extends around much of the portion of the wall not visible from the Station 9 rim location. The bench is at the base of several meters of gray regolith, overlying concentrated rubble of light-colored, apparently non-friable rock. This bench may be the base of Van Serg ejecta, that is, the pre-Van Serg overturned surface, or it may be the base of the Cochise ejecta blanket. On the northwest upper wall, a much darker apron of apparently fine-grained material exists. This apron tapers downward to the bench, suggesting that it is related to the dark regolith ejecta surrounding Van Serg Crater, similar to that sampled at the crater rim.
Samples collected on the rim of Van Serg consist of friable regolith breccias, 79035, 79115, 79120-25, 79135, 79175, 79195, 79235, and 79510-37, some with impact melt coatings and veins. Clasts in these samples, similar to those in 79155, suggest that the light-colored rocks and boulders on the floor and lower wall of the crater are ilmenite basalt rubble. “Glass” and “Glass Other” are present to over 10 modal% in the breccias (Simon et al., 1981) and orange+black ash is present in ejecta sampled in the half trench (Heiken and McKay, 1974; Morris et al., 1979).
[Heiken and McKay (1974) report a total “Orange glass” and “Glass other” in 79221 of 15.7vol.%, but do not include particles <90µ. On the other hand, Graf (1993) indicates that ~57wt% of the 79221 sample is, in fact, <90µ, so Heiken and McKay’s 15.7vol% “glass” is not represetative of 79221 as a whole. Graf gives Station 4’s orange+black pyroclastic glass <90µ as ~81wt% of the total in upper core 74002 (18.0-18.5 cm interval). Ratioing 15.7vol.% to 43wt% indicates that the <90µ portion of 79221 (57wt%) would have ~29vol.% “orange” and “glass other.”]
13.2 Regolith Ejecta Sequence at Van Serg Crater and its Correlation with Deep Drill Core Zones
A 70 cm long double drive tube core 79001/2 (see Morris et al., 1989; Meyer, 2012) was obtained close to the half trench in the Van Serg ejecta blanket to further sample the two distinct regolith zones observed in the trench. After examination in the Lunar Receiving Labatory, the upper drive tube section contained only 20 cm of core rather than the section length of 35 cm, because of post-collection and curation compaction of the relatively low density, near surface regolith.
The stratigraphy of core 79001/2 is summarized in Fig. 13.27↓ and Table 13.22↓ with the ∆Is/FeO values and Is/FeO resets based on the half-cm logging of raw data reported by Morris et al. (1989). The lettered units are defined based on estimated Is/FeO values and field observation of the wall of the half trench. It is important to note that the original core at time of collection was ~70 cm in length. As was the core sampling procedure, upper core 79002 was compacted after collection, ending up at 20 cm or ~57% of its original length. (Some additional compaction occurred during curation extrusion of the core.) Only the top 3.75 cm (Unit A in Table 13.22) of this 20 cm is a sample of the dark gray, ~7 cm of regolith that was observed in the trench and sampled as 79220 (0-2 cm) and 79240 (2-7 cm). Conversely, the remaining ~16.25 cm of the compacted 20 cm in core 79002 was originally 28 cm of regolith below the 7 cm of in situ dark gray regolith. The lower ~17 cm of the half trench sample (79260) was reported to be light gray (Chapter 12; Schmitt. 2024c).
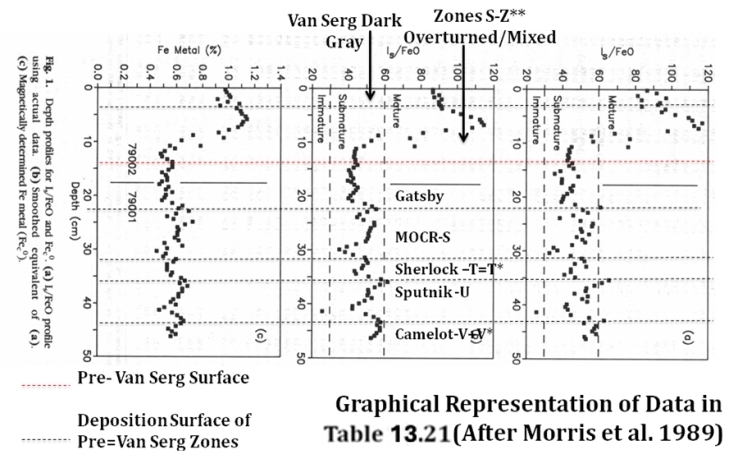 Fig. 13.27. Graphical represenation of half-cm Is/FeO data from Van Serg Crater drive tube core 79001/2 summarized in Table 13.21↑ (after Morris et al., 1989).
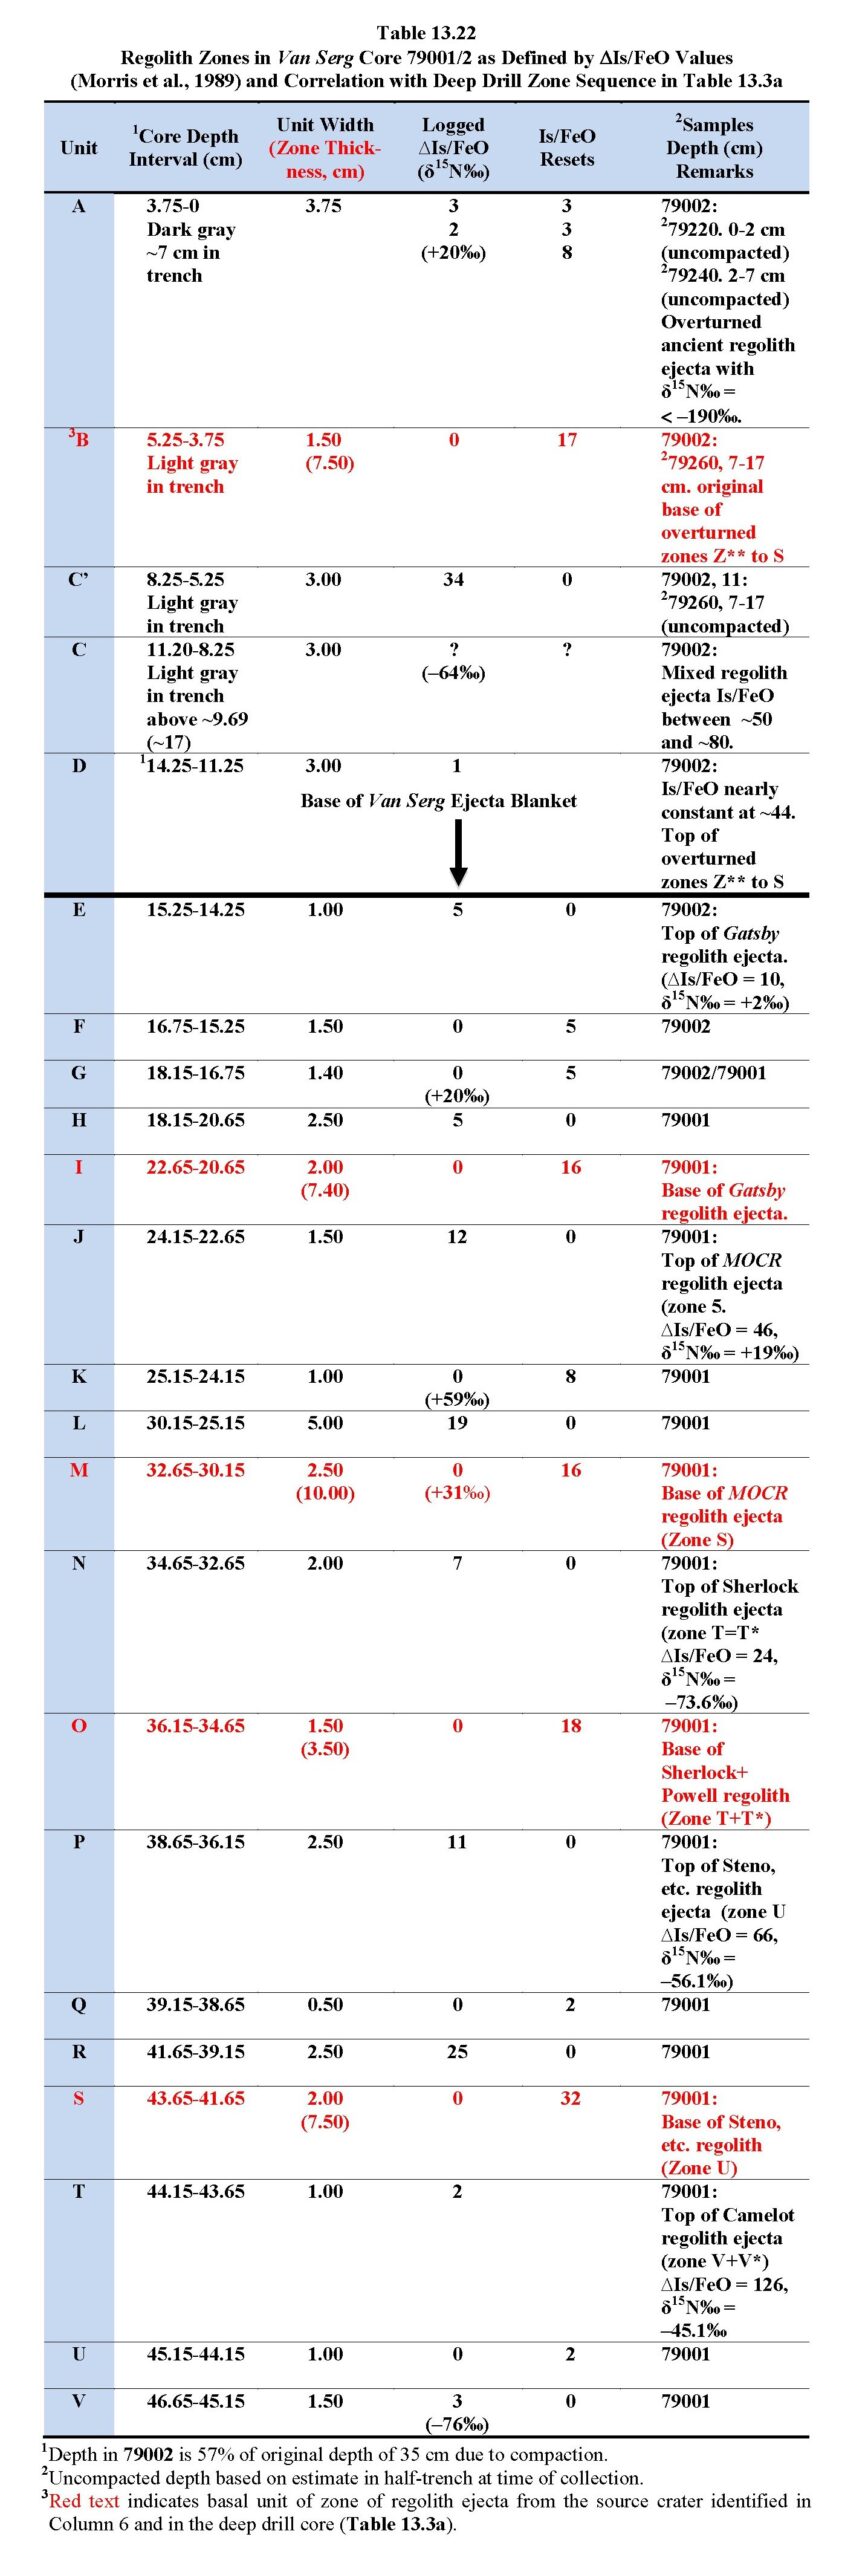
Link for Table 13.3a↑.The logic for the interpretations of source craters for the zones identified in Table 13.22↑, that is, Van Serg, Gatsby, MOCR, Sherlock, Sputnik and Camelot, is as follows:
- The dark gray top 3.25 cm (zone A) in core 79002 (7 cm in the half trench) is clearly representative of the dark gray, regolith breccia and orange+black ash-rich ejecta present at Van Serg’s rim. The dark gray appearance of unit A and the rim regolith breccias is due to abundant orange+black ash, indicating that they represent regolith that developed on the surface of the youngest ilmenite basalt flow (~3.82 Ga) after the eruptions of ash soon after the last lava eruption (see §10.3).
- Units B-D in the core also are likely a mix of overturned regolith ejecta zones, that is, zones comparable to the deep drill core zones and those below them. B has an impact reset of Is/FeO = 17 indicating significance shock disturbance. This suggests that, before the Van Serg impact, unit B was resting on dark gray regolith and includes regolith ejecta not sampled by the deep drill core, that is, material below zone Z** (Table 13.1a↑). As discussed further below (§13.4), nitrogen isotopic data confirms that units A and B-D are overturned relative to their pre-impact relationships, further indicating that zone B would be the bottom of the in situ pre-impact regolith ejecta zones, including the Cochise and Shakespeare Craters near-crater ejecta blankets. The incoherence of Is/FeO values in units C and D, likely produced by impact disruption, strongly suggest that the pre-impact bottom of unit D rests on the pre-Van Serg impact surface.
- Units E-H, with an impact reset of 16 Is/FeO points in unit H, likely constitute an 8.40 cm thick (22.65 –14.25) zone of the nearby, pre-Van Serg, Gatsby Crater This association with Gatsby is further supported by the nitrogen isotopic (δ15N‰= +2‰) data discussed below.
- The near rim of the 1451 m diameter MOCR Crater is ~6.13 km from Van Serg Crater and has been identified as the source crater for the youngest deep drill core zone, zone S. The zone S regolith ejecta deposit at the deep drill core location came from a slightly greater distance, 6.27 km, and is 19.65 cm thick. Zone J-M in core 79001 is defined by a impact reset of 16 Is/FeO points over 2 cm of unit I (“eye”) in the Van Serg core. At 10.00 cm thickness (32.65 – 22.65), the MOCR regolith ejecta zone in core 79001 is about half that for zone S in the deep drill core (Table 13.21↑), probably the result of ejection-related thinning, if this correlation is correct. Further, the total ∆Is/FeO for the interval J through M in Table 13.22↑ is ~31, significantly less than 46 for the still exposed zone S in the deep drill core (Table 13.1a↑); however, zone S at the deep drill core site has been continuously exposed since deposition whereas units J-M have been shielded from 15 points worth of ∆Is/FeO exposure by overlying Gatsby (10) and Van Serg ejecta (5 in unit A), making I-M identical with zone S (31 + 15 = 46).
- Unit O in core 79001 is defined by a large impact reset of 18 Is/FeO points as the bottom of units and is suggested to be equivalent to deep drill core zone T+T*. The near rim of Sherlock Crater is ~1.40 km from Van Serg Crater and has been identified as one of two source craters for zone T+T*, the least mature zone in the deep drill core. Sherlock Crater’s regolith ejecta deposit in the deep drill core is from 1.04 km and is 25.70 cm thick vs. 3.5 cm for units N-O in core 79001, significantly less than that of zone T+T* in the deep drill core. Zone T+T*’s regolith ejecta zone, however, also had a simultaneous contribution from Powell Crater, 2.71 km distant from Van Serg. The regolith ejecta contributions of Sherlock and Powell at the Van Serg location are estimated in Table 13.21↑ to be 30 and 46 cm, respectively but ejecta sheath interactions may have reduced the final deposition thickness, significantly. Further thinning as a result of the Van Serg impact would have reduced that thickness even more.
- The distances from Van Serg Crater to the near rims of the four contemporaneous source craters for deep drill core zone U (§5.0), Steno, Emory, Faust and Sputnik Craters, are given in Table 13.21. Sputnik’s specific contribution to zone U at the core site is estimated to have been about 11 cm (§3.4.2, Table 13.3a↑), because the ejecta sheaths of the four simultaneous impacts probably interacted. These craters’ contributions of regolith ejecta deposit in Van Serg core 79001 is 7.5 cm for units P-S versus the pre-Van Serg estimate for zone U in Table 13.21 of 116 cm, suggesting major thinning of the P-S unit by the Van Serg impact or great asymmetry in the zone U oblique ejecta sheaths. Further, P-S’s ∆Is/FeO = 36 vs. 75 for the deep drill core’s zone U. Also, as discussed in §4.0 and §8.5, data suggest that reset impacts affecting zone U were of abnormally high kinetic energy, however, the half-cm logging of core 79001 does not show a similar reset vs. ∆Is/FeO pattern as seen in the deep drill core’s zone U (Table 13.1a↑). The reason for this difference between the patterns in the two cores has not been determined. It may be related to disruption of the Is/FeO record by the proximity to the Van Serg impact.
- Due to its relative position in the core, units T-V of core 79001 appears to provide a sample of zone V+V* regolith ejecta from Camelot Crater, about 2.62 km from Van Serg Crater. As this distance is near the optimum deposition distance for regolith ejecta (Fig. 13.8↑), a significant thickness of Camelot ejecta may lie below the 3.50 cm of unit T-V sampled by 79001, although this depth would also include regolith ejecta equivalent to deep drill core zones W through Y+Y*, the ejecta blankets from Cochise and Shakespeare Craters, and all ejecta and pyroclastic ash units deposited after the ~3.82 Ga eruption of the last ilmenite basalt lava. Just above the lava would be a half meter or so of orange+black pyroclastic ash, and just below the lava would be the dark gray ancient regolith (§13.4) that makes up, in part, the rim regolith breccias.
[The half-cm Is/FeO data for the core summarized in Fig. 13.27↑ (Morris et al., 1989) and Table 13.22↑ indicate a 5.50 cm thick mixed Is/FeO sequence that varies from 44 to 77 points between a compacted 14.25 and 5.25 cm in depth. These depths would probably correspond to an uncompacted depth of about 25.00 and 9.21 cm at 43% compaction and probably records internal, real-time mixing of the Van Serg impact ejecta. As the dark gray regolith ejecta and rim breccias do not appear to have participated in this mixing, it suggests that they may have been initially ejected on more vertical trajectories that delayed their deposition.]
The intervals with red bold text in Table 13.22 indicate possible lower contacts of regolith ejecta deposits for which relatively large impact resets of Is/FeO are noted in half-cm logging. When the δ15N‰ values given in Table 13.22, Column 4, are noted, they also indicate a relationship with the regolith ejecta zones of the deep drill core (§6.2). The Van Serg sequence of δ15N‰ values suggest that (1) below the relatively thin uppermost Van Serg, dark gray ejecta (δ15N‰ = +20), the sequence of deep drill core zones has been overturned between 14.25 and 3.75 cm and mixed so as to give a net δ15N‰ value of –64‰; and (2) the zones below the pre-Van Serg surface are right side up zones whose δ15N‰ values roughly correlate with those in the deep drill core. One exception to this correlation is the first zone (units E-I) below the pre-Van Serg surface in which δ15N‰ = +2. This zone in core 79001 is probably is ejecta from nearby Gatsby Crater. The δ15N‰ values in zones (units J-T) below the apparent Gatsby zone follow the deep drill core sequence given in Table 13.22, Column 3. These data strongly suggest that, below the overturned regolith, the pre-Van Serg zone sequence sampled by drive tube core 79001 is Gatsby, MOCR (zone S), Sherlock+Powell (zone T+T*), Steno, etc. (zone U), and Camelot (zone V+V*).
The above relationships are summarized schematically in Fig. 13.28.
 Fig. 13.28. Schematic diagram of stratigraphic relations of regolith ejecta zones below the rim and ejecta blanket of Van Serg Crater. Bold lettered zones refer to those in the deep drill core (70001/9) listed in Table 13.1a↑).
Link for Table 13.22↑.
Support for the zone sequence proposed above is found in the variations in trace elements reported by Morris et al. (1989). Trace element concentration spikes and depletions associated with the various regolith ejecta zones are given below, as correlated with the base of those zones sampled by drive tube core 79001/2.
[Key: black bold = increase, black bold* = large increase, red bold = decrease, plain text = no apparent change]
- Van Serg dark gray (3.75 – 5.25 cm): La, Sm, Hf, FeO, Co, Sc, Cr, 20Na, Eu, Ni, Ir.
- Van Serg overturned ejecta (5.25 cm overturned): La, Sm, Hf, FeO, Co, Sc, Cr, 20Na, Eu, Ni, Ir.
- Gastby ejecta (22.65 cm): La, Sm, Hf, FeO, Co, Sc, Cr,
- 20Na, Eu, Ni, Ir.
- MOCR (zone S) ejecta (32.65): La, Sm, Hf, FeO, Co, Sc, Cr, 20Na, Eu, Ni, Ir.
- Sherlock+Powell (zone T+T*) ejecta (36.15): La, Sm, Hf, FeO, Co, Sc, Cr, 20Na, Eu, Ni, Ir.
- Sputnik (zone U) ejecta (43.65 cm)- La*, Sm*, Hf, FeO, Co, Sc, Cr, 20Na, Eu, Ni, Ir*.
- Camelot (zone V+V*) ejecta (+46.65 top): La, Sm, Hf, FeO, Co, Sc, Cr, 20Na, Eu, Ni, Ir.
The above list indicates that trace element anomalies occur in the deposition units of the several identified zones in core 79001/2. It also suggests the following:
- The Van Serg impact (item 1) was by a metal-rich meteor.
- The enrichment in Hf in Van Serg overturned ejecta (item 2) may reflect the significant amounts of massif regolith in the thick, lower zones of the deep drill core (§5.0).
- The contrast between MOCR and Sherlock+Powell enhancements and depletions suggest that their regolith ejecta sampled two different basaltic lavas. The existence of a possible lava flow front running north and south and including the east wall of Cochise Crater, discussed in relation to photography obtained at Station 6 (Chapter 12; Schmitt, 2024c), suggests this possibility as well, as does the straight east wall (rectangular shape) of Cochise Crater.
- The compositional enrichments noted for Sputnik ejecta appear to support the conclusion in §4.0 and §8.5 that zone U regolith ejecta was the result of fragments of a disaggregated comet (Steno, Emory, Faust and Sputnik Craters).
13.3 Deposition Age Estimates for Regolith Ejecta Zones Sampled at Van Serg Crater
The reported data on values for Is/FeO and Th in drive tube core 79001/2 (Morris et al., 1989) obtained at Van Serg Crater provide an opportunity both to estimate the possible exposure ages of unit groups correlated with Gatsby, MOCR, Sherlock and Steno, etc. source craters and to further evaluate the process of impact reset of Is/FeO as was done in §11.2 for Shorty Crater. Table 13.23 summarizes the relevant data relative to this evaluation.

Links for Morris et al. (1989), Silver (1974), §6.3.2 and §6.3.3.[Relative to Table 13.23, Row 2, dealing with Van Serg surface ejecta, data from Morris et al. (1989) give the current Is/FeO for the top of core 79002 as 87 with a logged ∆Is/FeO = 5 and a logged Is/FeO reset = 14 in the upper 3.75 cm of the core (~7 cm in nearby trench). These figures would indicate a net pre-impact Is/FeO = 96. Morris et al. (1989) give the Is/FeO = 81 as net for 79221 that sampled the top 2 cm of the half-trench near 79002; however, Is/FeO = 96 at the top of 79002 would be more representative of the pre-impact Is/FeO. No Is/FeO is reported for the rim breccias (Meyer, 2012); however, Housley et al. (1976) conclude that rim breccia 79035 petrography, that is, very high ferromagnetic resonance, indicates that maturity is very high which is consistent with the above data from Morris (1976) and Morris et al. (1989). Is/FeO = 96, on the other hand, does not take into account a probable large Is/FeO reset due to the Van Serg impact.
An average of 4 similar U+Th analyses for rim breccias 79035, 79115, and 79135 gives U+Th = ~1.5 that, in turn, gives a post-impact ∆Is/FeO / Myr = 0.98 (1.5 × 0.58 + 0.11). That maturation rate gives an estimated exposure age since the Van Serg impact of ~5.1 Myr, inconsistent with the apparent ages of reported 1.6 Myr or ~1 Myr as compared to Shorty Crater (§13.1). Further, if the above total Is/FeO = 96 is considered, it gives a remaining exposure age of nearly 100 Myr, however, for Van Serg surface ejecta, after any resets. The rim breccias and surface ejecta are interpreted below as ancient regolith excavated from below the 3.82 Ga ilmenite basalts. Great uncertainty must be attached to the net amount of their exposures to maturation and resets since that time.]
Column 6 in Table 13.23↑ shows reductions of 84% and 58% in the calculated ∆Is/FeO-based exposure ages for Sherlock (zone T+T*) and Steno, etc. (zone U) in core 79001 as compared to exposure age values in Table 13.15↑. These reductions in exposure ages reflect comparable reductions documented in Table 13.16↑ for deep drill core zones relative to source regolith cosmic ray exposure ages. The explanation for the relatively low reduction of 33% in the exposure age of regolith ejecta from MOCR Crater (zone S) is not apparent. The reasonable exposure age of 11 Myr for pre-Van Serg Gatsby Crater regolith ejecta, suggests that the ∆Is/FeO reset effects of impact shock from secondary impacts are mitigated within near surface regolith as well as by lower impact shock. This mitigation also may reflect the lower density and less compaction of near surface regolith that reduce the levels of shock propagation.
13.4 Solar History in Nitrogen Isotopes at Van Serg Crater
The δ15N‰ vs. Is/FeO data for Van Serg Crater samples also provide illuminating implications for solar wind history. Table 13.24↓ summarizes δ 15N‰ and Is/FeO values reported for various depths in core 79001/2, as well as for measurements on the regolith breccias at the crater rim. As discussed in §6.2.3, nitrogen isotope data appears to reflect a factor of 3.4 increase in the energy of the solar wind, possibly some time after ~0.514 Ga (zone W* deposition in Table 13.15↑).
[The tie to zone W* comes from the trend of increasing δ15N‰ in Fig. 13.12a↑ that appears to begin after W* deposition and culminates in a current δ15N‰ value of about –118‰. It would appear to represent an increase in or beginning of solar fusion production of 15N.]
Fig. 13.29a↓ is a plot of reported Van Serg nitrogen data given in Table 13.24, superposed on a summary of the trends in Fig. 13.12a↑ and Fig. 13.12b↑ from §6.2. The red arrows in Fig. 13.29a↓ show increasing depth in upper drive tube 79002 and the green arrows show increasing depth in the lower drive tube 79001. Sample numbers in black are for regolith rim breccias and half-trench samples.
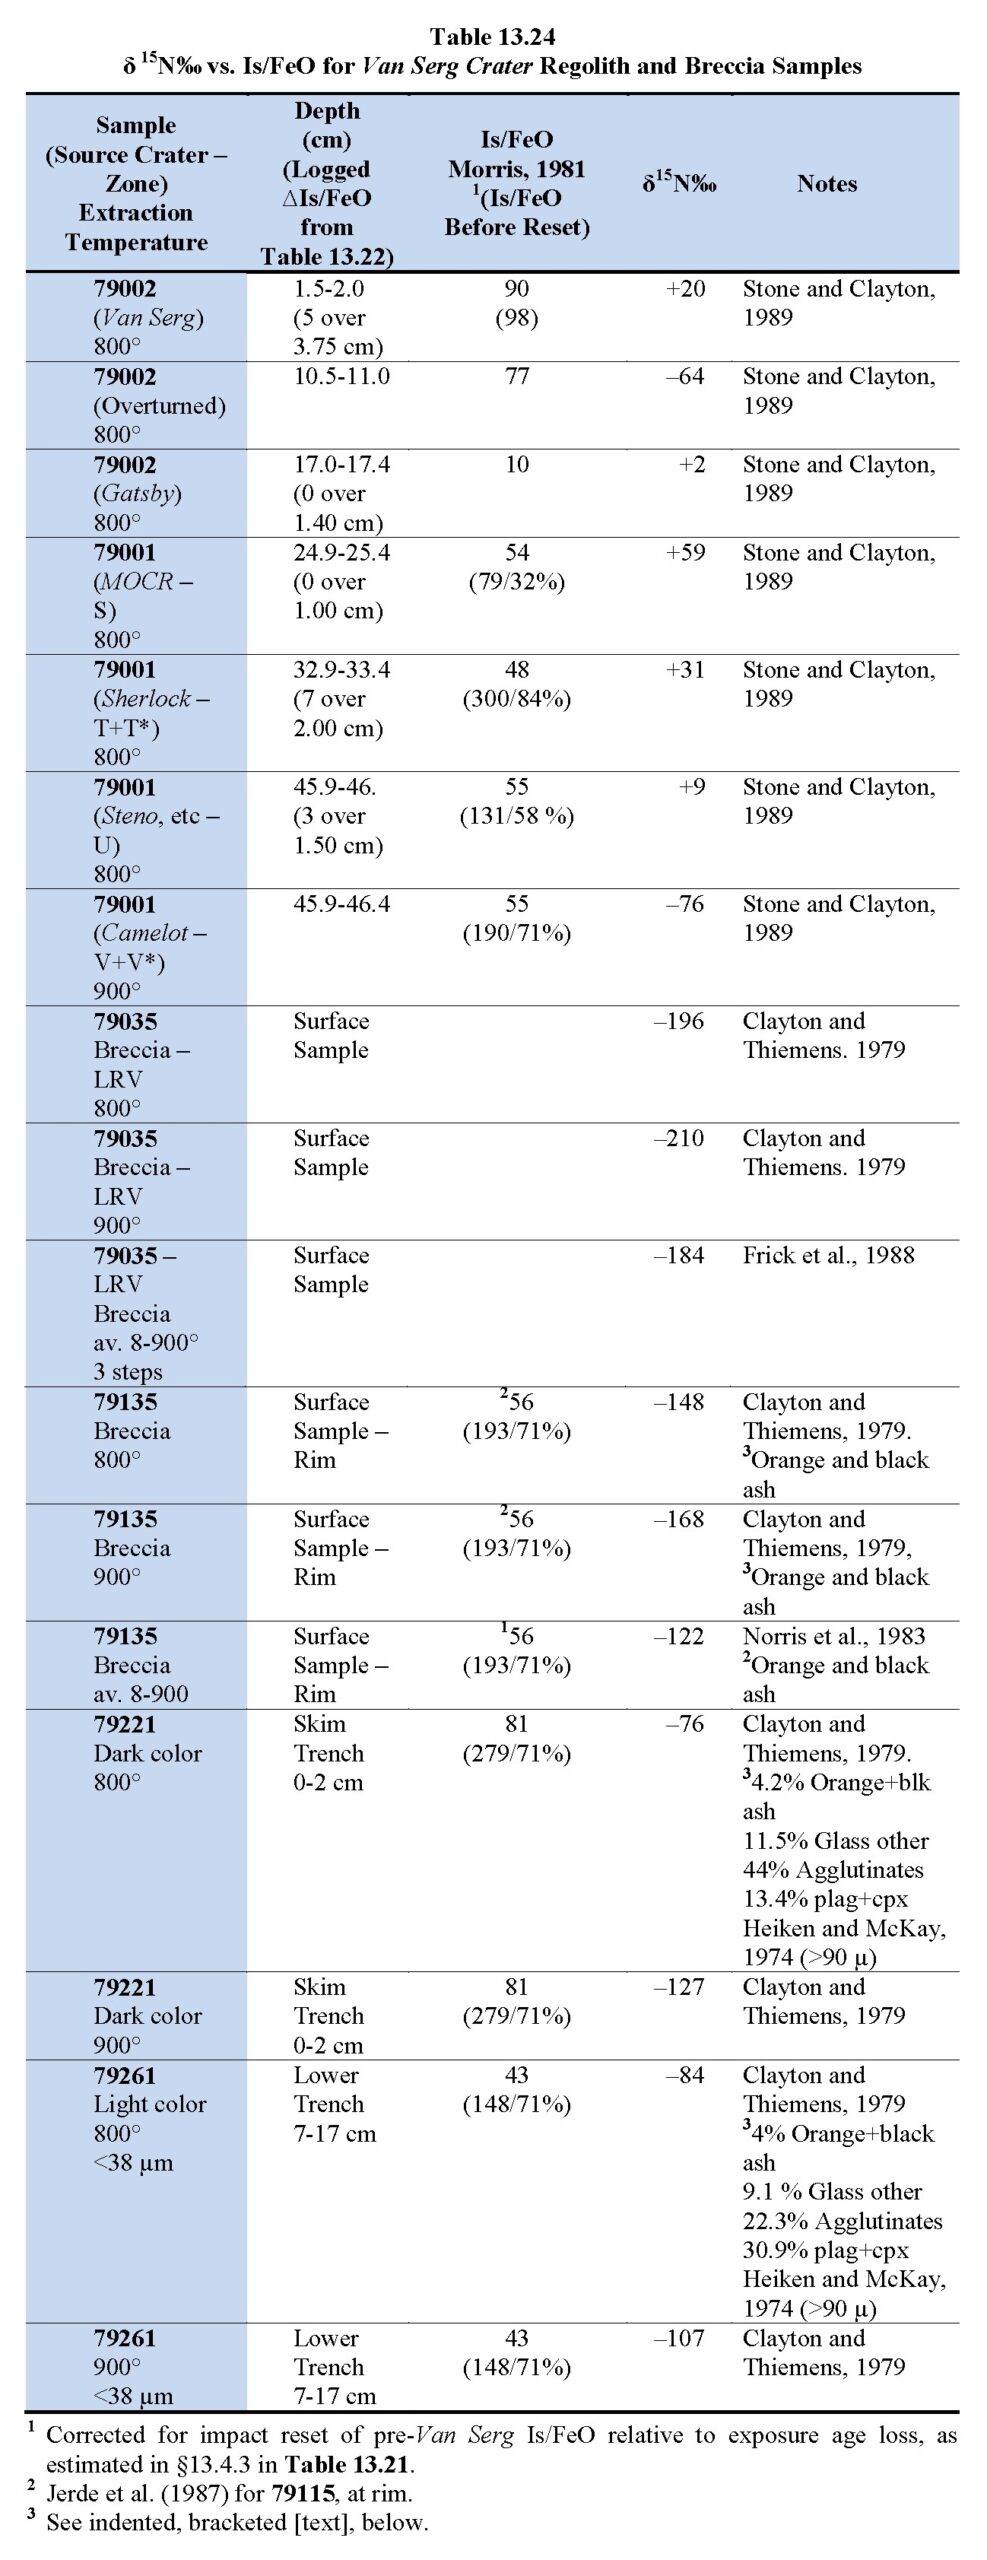
Links for Table 13.21 and Jerde et al. (1987).[Heiken and McKay (1974) report a total “Orange glass” and “Glass other” in 79221 of 15.7vol.%, but do not include particles <90µ. On the other hand, Graf (1993) indicates that ~57wt% of the 79221 sample is, in fact, <90µ, so Heiken and McKay’s 15.7vol% “glass” is not representative of 79221 as a whole. Graf gives Station 4’s orange+black pyroclastic glass <90µ as ~81wt% of the total in upper core 74002 (18.0-18.5 cm interval). Ratioing 15.7vol.% to 43wt% indicates that the <90µ portion of 79221 (57wt%) would have ~29vol.% “orange” and “glass other.”]
 Fig. 13.29a. Plot of δ15N‰ vs. reported Is/FeO for Van Serg Crater double drive tube (79001/2), trench and regolith breccia samples given in Table 13.24↑. Dashed lines are the δ15N‰ vs. ∆Is/FeO trends shown previously for the deep drill core in §6.2’s Fig. 13.12a↑ and Fig. 13.12b↑. Green plots and arrows are for lower core 79001, red plots and arrows are for upper core 79002, and black plots are from a half-trench through the ejecta blanket (~50 m and from the rim) and for breccia samples from the crater rim. The small numbers under the sample numbers are depths in cm of samples analyzed. Dashed oval includes breccias that have anomalously low δ15N‰ values.
The relationships between core 79001/2 samples represented in Fig. 13.29a could be interpreted as contradicting the earlier conclusions related to the δ15N‰ vs. ∆Is/FeO trends shown previously for the deep drill core in Fig. 13.11a↑ and Fig. 13.11b↑ of §6.2. Specifically, none of the plots in Fig. 13.29a correlate with the trend (black) of older zones (U-Z+Z*) in the deep drill core, but rather many cluster near the trend (red) for the younger zones (S-T+T*) and surface regolith samples. The plots in Fig. 13.29a, however, do not take into account the conclusion in §13.3 that ∆Is/FeO resets associated with the Van Serg impact have reduced the ∆Is/FeO values and corresponding exposure ages for their related deep drill core zones (Table 13.23, Column 5) relative to their calculated values in Table 13.15↑.
The ∆Is/FeO values in parentheses in Column 3 in Table 13.23↑ are calculated pre-Van Serg impact numbers for ∆Is/FeO, assuming each has been reduced by the percentages shown in Table 13.22↑, Column 6, for MOCR, Sherlock+Powell, and Steno, etc. For the samples in Table 13.23 relatively older than regolith ejecta from these three source craters, the average percentage ∆Is/FeO loss for Sherlock+Powell and Steno, etc. (71%) has been used in the recalculation.
 Fig. 13.29b. Plot of δ15N‰ vs. reported Is/FeO for Van Serg Crater double drive tube (79001/2), trench and regolith breccia samples with reported ∆Is/FeO values increased by percentages indicated in Table 13.23↑, Column 3 (in parentheses), Dashed lines are the δ15N‰ vs. ∆Is/FeO trends shown previously for the deep drill core in Fig. 13.12a↑ and Fig. 13.12b↑. Green plots and arrows are for 79001 and red plots and arrows are for 79002 and black plots are for breecia samples from the crater rim and from a half trench into the ejecta blanket ~50 m from the rim. Dashed oval shows breccias that have anomalously low δ15N‰ values. The numbers under the sample numbers are depths in cm of samples analyzed.
Using these recalculated values for ∆Is/FeO, Fig. 13.29b shows a plot of the revised data previously plotted in Fig. 13.29a↑ (note scale changes). This new plot shows that most of the deeper core samples (79001) are, indeed, related to the older deep core trend, supporting the hypothesis that they are samples of older regolith ejecta zones. Exceptions are:
- The three 79002 samples from 2-17 cm appear to have largely equilibrated with the zones S, T, and surface regolith trend, as they have all been exposed at the lunar surface during the last 10 Myr or so.
- As discussed further below, half-trench samples 79221 and 79261 may reflect an ancient ∆Is/FeO inheritance, as may the two rim breccias (79035, 79135).
- 79002 at 17 cm. correlated with Gatsby Crater in Table 13.22↑, has a δ15N‰ value of +2‰ that is consistent with Gatsby Crater being created after the increase in the solar wind energy and thus has greater 14N fractionation.
- Inhomogeneity may explain the inconsistency between the δ15N‰ values of core 79002 at 2 cm and the skim trench sample 79221 at 0-2 cm (+20‰ versus –76‰ to –127‰, respectively).
- The crater rim regolith breccia 79035 with highly negative values of δ15N‰ of at least –210‰, along with 79135, was excavated by the Van Serg impact at its deepest penetration. These δ15N‰ values are much more negative that the projected δ15N‰ = –118‰ of the current solar wind and suggest an exposure to solar wind in a pre-lunar magnetic field period when the 15N/14N ratio in the solar wind was much lower than today. Although there is no ∆Is/FeO data for 79035, its low negative δ15N‰ values project to very high ∆Is/FeO values on the deep drill core’s older ∆Is/FeO / δ15N‰ trend. These low δ15N‰ values, in turn, imply that the Van Serg impact tapped into regolith developed when solar wind impinged on surface regolith in the absence of a global magnetic field prior to ~4.25 Ga (Tikoo et al., 2017) and prior to the formation of the valley of Taurus-Littrow. When that ancient regolith was later protected from solar wind by the rise of the global field at ~4.25 Ga, maturation by alpha+beta particles and impact gardening continued to fractionate 14N from l5N.
- The conclusion in item 5, above, is confirmed by the move of the plot for trench skim sample 79221 in Fig. 13.29b↑ to roughly coincide with the trend (black) of old deep drill core zones after recalculating ∆Is/FeO values to account for impact resets.
In the pre-magnetic field period, the very low δ15N‰ regolith postulated in item 5, above, and sampled at Van Serg Crater, would need to survive largely intact (1) the period of large basin formation (South Pole Aitken, Crisium, Serenitatis); (2) incorporation in Imbrium ejecta (Sculptured Hills); and (3) being covered by ilmenite basalt lava and pyroclastic ash (~3.82 to 3.60 Ga) until finally exposed by the Van Serg impact about 1 Myr ago from below the basalt and ash. Ten or more meters of regolith ejecta apparently prevented significant post-Imbrium surface exposure. The Van Serg impact excavation (Fig. 13.30↓), then, appears to have penetrated below any basalt, ash and all ejecta blankets into Imbrium ejecta (Sculptured Hills) that included the ancient regolith. Further, an area of dark material exposed on the floor of Gatsby Crater suggests that the dark gray regolith at Van Serg Crater may have significant lateral extent.
Alternatively, at ~700 m in diameter, Cochise Crater probably excavated to about 150 m depth, potentially excavating below both the older Shakespeare ejecta blanket and any underlying basalt and ash as well as older regolith ejecta zones. Van Serg’s impact much later took place through Cochise’s ejecta blanket that may have included this ancient regolith that was part of the Imbrium ejecta. In fact, as we drove along the east rim of Cochise toward Van Serg Crater, I reported (Chapter 12; Volume 5, Schmitt, 2024c), “… looking at the western [southwestern] wall of Cochise, I can see a contact within the subfloor between albedo units, one of which is a light tan-gray and the other is a light blue-gray.” The “light blue gray” unit may be ilmenite basalt and would indicate significant penetration by the Cochise impact into underlying Imbrium ejecta (Sculptured Hills) that included the ancient regolith. The mixing of ancient regolith with orange+black ash, however, makes this alternative unlikely.
A schematic summary of the path of events affecting Taurus-Littrow that illustrates the low probability of ancient regolith surviving intact is shown in Fig. 13.30; however, apparently it did survive.
 Fig. 13.30. Schematic representation of major events affecting the geology of Taurus-Littrow since accretion of the Moon as well as the path that needed to be followed by ancient regolith sampled at Van Serg Crater.
Whatever may be the somewhat implausible sequence of events involving Van Serg ejecta, as portrayed in Fig. 13.30 (light blue dashed line), the Van Serg samples are evidence that the early Sun (pre-lunar magnetic field) had not stabilized in its current main sequence to a δ15N‰ value equal to –118‰. That stabilized value arose sometime during the period when the non-polar latitudes of the Moon were shielded from the solar wind from about 4.25 to ~3.60 Ga (§10.4) by a lunar magnetic field. If cored and dated, δ15N‰ data on deep drill core-like regolith ejecta zones from the polar regolith may confirm this hypothesis. Further, if the δ15N‰ = +80‰ indicated for zero ∆Is/FeO in Fig. 13.12a↑ is valid for the Moon’s accretionary materials, then the early Sun had not yet begun to generate significant 15N, as it began to do as it entered its main sequence sometime after ~4.25 Ga and before 3.60 Ga.
A rough estimate of an exposure age for ancient regolith skim sample 79221 can be obtained from its recalculated Is/FeO = 279 (Table 13.23↑) and its reported U and Th contents of 0.65 and 1.23 ppm (U+Th=1.88 ppm), respectively (Korotev and Kremser, 1992) and 0.36 and 1.12 ppm (U+Th=1.48 ppm), respectively, (Eldridge et al., 1974). The Th/U ratio of the Eldridge analysis is 3.11 vs. 1.89 for that of Korotev and Kremser, with the former being closer to the ratio determined by Silver (1974) for Sculptured Hills-like regolith, 74260 (Th/U = 3.14). Using Eldridge et al.’s data and adjusting for U and Th decay from a mean exposure age of about 4.30 Ga when the ancient regolith was exposed at the surface, gives an estimated total surface exposure of 256 Myr (0.256 Ga) (Table 13.25) before both solar proton and alpha+beta exposure was terminated by burial. Hypothesizing that the Procellarum basin-forming event (§26.0) resurfaced on the near-side of the Moon and created the parent surface of the ancient regolith, and subtracting 0.256 Ga from Procellarum’s apparent age of 4.35 Ga, the ancient regolith’s last surface exposure was at 4.09 Ga.

Links for §6.4, Eldridge et al. (1974), Schmitt (2016b), §26.0 and §6.3.2.This value of 4.09 Ga is reasonably close to the proposed start-up of the lunar magnetic field and its deflection of the solar wind at about 4.25 Ga (Tikoo et al., 2017), and indicates that the ancient regolith was exposed to ancient solar wind for about 100 Myr (4.35 minus 4.25 Ga) before being shielded by the magnetic field. It also suggests that there had been local burial of the ancient regolith before being incorporated in Imbrium ejecta about ~3.9 Ga (Sculptured Hills) and reburial in Taurus-Littrow. Additionally, some of the surface exposure of the ancient regolith to impact gardening and alpha+beta maturation (< 100 Myr) may have occurred after deposition in Taurus-Littrow prior to additional burial taking place at ~3.82 Ga with the eruption of ilmenite basalt lavas and subsequent orange+black pyroclastic ash. Both of these volcanic materials are included in the Van Serg ancient regolith breccias.
[The 4.30 Ga mean exposure age for the ancient regolith was chosen as being between the Mg-suite, 4.35 Ga age for Mg-suite samples (Borg et al., 2015) as the probable age of the Procellarum basin formation (Schmitt, 2016; §26.0) and the start-up of the lunar magnetic field at about 4.25 Ga.]
14.0 Nitrogen Isotopes Implications Relative to Solar History
Major implications relative to the history of the solar wind are implied by the preceding synthesis of δ15N‰ and ∆Is/FeO values in the regolith units sampled at Taurus-Littrow. The possibilities identified so far are as follows and have been graphically summarized previously in Fig. 13.30↑.
- Accretionary δ15N‰ for the Moon was positive, as reflected in the +13 ± 1.5‰ value reported for orange+black ash. This is the value measured for pyroclastic nitrogen in the oldest black ash (Unit 1) sampled at Shorty Crater (Kerridge et al., 1991) the magma for which is interpreted here as originating in the upper portions of the lower lunar mantle below ~580 km as indicated by density interpretations (see Garcia et al., 2019). This δ15N‰ is a low, positive value, similar to δ15N‰ measured for clasts in an enstatite chondrite (+29.2 ± 0.6‰) (Thiemens and Clayton, 1983), and strongly suggests that the δ15N‰ for the early solar nebula was in a positive range. The projection of δ15N‰ and ∆Is/FeO values in deep drill zones Z+Z* to W in Fig. 13.12a↑ indicates the actual accretionary δ15N‰ equaled about +80‰. The difference between δ15N‰ = +13 ± 1.5‰ vs. +80‰ may indicate 14N fractionation during lunar core formation with the core being enriched in that isotope.
- Solar wind δ15N‰ early in lunar history was >210‰, prior to the rise of a global magnetic dipole field at ~4.25 Ga (Tikoo et al., 2017). This is the very negative δ15N‰ value measured in samples of Van Serg Crater regolith breccias that do not fit the linear relationships between δ15N‰ and maturity indices (Fig. 13.29b↑, §13.4) seen in the five oldest regolith zones analyzed from the Apollo 17 deep drill core (70001/9). These data indicate that fusion in the pre-main sequence Sun was not yet creating significant 15N relative to 14N.
- The slope of the δ15N‰ and ∆Is/FeO maturity index linear relationship shown by zones Z+Z* through W changed from –0.77 to +88 (Fig. 13.12b↑, §6.2) sometime after ~0.514 Ga (Horatio impact, zone W*). The +0.88 slope continued from zone W (Hess impact, 0.395 Ga.) or earlier to its intersection at zero ∆Is/FeO, indicating that the solar wind δ15N‰ stabilized at δ15N‰ equal to about –118‰ at the start of this trend. (Ages are taken from Table 13.15.)
- An increase in the energy of the solar wind, sometime after 0.197 Ga (Steno, etc., zone U) is indicated by the trend (red) in Fig. 13.12b (§6.2). This change indicates an increase in the aggregate energy of the solar wind by a factor of 3.4 relative the fractionation slopes of the green and red trends in Fig. 13.12b↑ (+0.88 vs. +3.00).
The above data from the lunar regolith indicate that, as the Sun’s fusion processes began, 14N was produced in great excess relative to 15N, resulting in the negative slope to the δ15N‰ / ∆Is/FeO trend shown in Fig. 13.12a↑. Subsequent to ~0.514 Ga (zone W*), solar 15N production began, giving a constant solar wind 14N/15N ratio and maintaining δ15N‰ = –118. This value also differs by a factor of ~3.4 (coincidentally) from the δ15N‰ = –407 reported from analysis of data recovered from the crashed Genesis spacecraft (Marty et al., 2011). An explanation for this difference has not been determined, however, the data from the Apollo 17 deep drill core appears conclusive.
Reviewing the discussion in §6.2.2, the indicated increase in the solar wind’s δ15N‰ after ~0.514 Ga, that is, an increase in 15N production, may have been associated with an increase in energy production in the Sun that, in turn, may have been the major contributor to warming associated with the Earth’s Cambrian Explosion of ocean life initiated about 0.538 Ga (Whittington, 1985; Gould, 1989; Maloof et al., 2010). The difference of ~26 Myr is probably within the error limits in this synthesis of deposition ages for deep drill core regolith ejecta zones. In fact, the start of the Cambrian Explosion at 0.538 Ga may provide a calibration point for the deposition ages given in Table 13.15↑, that is, zone W* may have been deposited prior to 0.538 Ga rather than about 0.514 Ga.
The question remains as to whether the two phenomena recorded on the Moon and the Earth actually are physically related. It also would be of importance to know if the physics of solar evolution is consistent with a major change in the energy of the solar wind before 0.5 Ga due to an increase or initiation of solar production of 15N.
15.0 Source Crater Ages Versus Diameter to Depth Ratios
Estimates for the ages of source craters for the regolith ejecta zones in the deep drill core (Table 13.15↑) provide an opportunity to evaluate the application of crater diameter to depth ratios to the absolute ages of impacts. Fig. 13.31 shows a plot of source crater ages (Table 13.15) relative to the topographic erosion of the shape of Taurus-Littrow craters >400 m in diameter as indicated by diameter to depth ratios. The consistent trend in diameter to depth (D/d) ratios (relative age) vs. age of most points supports the source crater assignments to specific deep drill core zones (§3.4). This trend of the diameter to depth ratio (Table 13.3a↑) as a function of estimated age (Table 13.15) indicates that the D/d ratio changes about 10 points per Ga and also indicates that this ratio is about 5 for newly formed craters, supporting the work of Pike (1974). The displacement of Horatio, Mackin and Cochise Craters to D/d ratios below the trend line in Fig. 13.31 probably is a result of Camelot ejecta decreasing Horatio’s depth, Hess Crater’s disturbance of Mackin Crater’s original depth, and the interference of a basalt lava front (Chapter 12) with Cochise Crater’s formation.
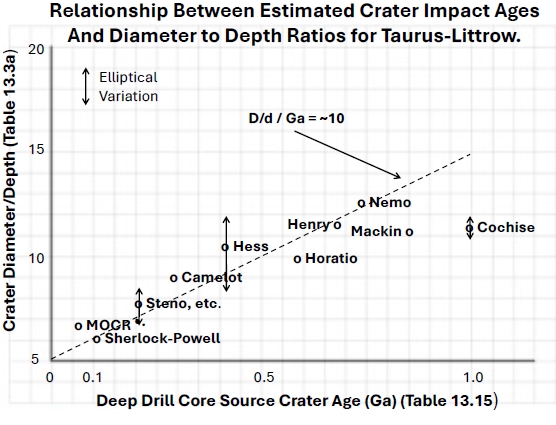 Fig. 13.31. Relationship between diameter to depth ratios and estimated source crater ages for deep drill core regolith zones (Table 13.3a↑ and Table 13.15↑).
Fig. 13.31’s trend line provides a means of estimating the approximate age of a crater from its diameter to depth ratio so long as mass wasting or other processes have not distorted that ratio as it has for Horatio, Mackin and Cochise, as well as WC, SWP and Lara Craters in Taurus-Littrow.
16.0 Average Frequency of Large, Proton-Only Increases in ∆Is/FeO in the Half-Cm Record of the Deep Drill Core
The half-cm log of the raw Is/FeO data (Morris, personal comm.) disclosed that, at the half-cm level of granularity, each regolith ejecta zone contains a number of larger than normal increases in ∆Is/FeO. It is possible that these increases over a short interval may be the effect of larger than normal solar flares and/or coronal mass ejections (CMEs). It also is possible that they may reflect an anomalous decrease in the frequency of impacts that continuously garden an exposed zone and result in small resets of Is/FeO values.
Table 13.26 shows the number of increases in ∆Is/FeO > 4 points over a half-cm in the core and the average interval in Myr between such increases.

Links for Table 13.15↑ and Morris (1976).If the data in Table 13.26 represent a meaningful record of solar activity, several conclusions present themselves. They are as follows:
- There is no obvious pattern in the frequency of pulses of increased solar activity over the nearly one-billion-year record in the deep drill core.
- During exposure of zone V+V*, solar pulses appear to have been significantly less frequent than during other periods with a return to a more normal frequency during exposures of zones T+T* and S.
These conclusions, along with the conclusions noted in §14.0 based on nitrogen isotope fractionation, indicate that the Sun has been modifying its behavior significantly over the last third of its history.
17.0 Geology of the Light Mantle Avalanche Deposits
[§17.0 consists of a significant update of similar material presented by the author in Shearer et al., {2024).]
17.1 Introduction
Early studies of the Taurus-Littrow Valley, summarized by Wolfe et al. (1981), identified a prominent, stratigraphically relatively young, high albedo, plume-like surface deposit projecting a maximum of about 5 km from the base of the 2200 m high South Massif on to the valley floor (Figs. 13.32a-d). The original geological mapping team named this deposit, objectively, the “light mantle;” however, high-sun images obtained by the Lunar Reconnaissance Orbiter Camera (LROC), as well as re-examination of Apollo 17 orbital images, made it clear that the “light mantle” unit is made up of two distinct deposits, one partially covered by the other. The two deposits are referred to here as the “young” light mantle” and “old” light mantle,” respectively.
Additional work by R. A. Wells (pers. comm.; Wells (2021)) has identified at least two other mass-wasting deposits from the South Massif slopes, lying to the southwest of the area explored by Apollo 17 (Fig. 13.32a↓: “Very Old Avalanche”, and “Debris Flow”; Fig. 13.32c↓, Fig. 13.32d↓: “Debris Flow”). Also, maturity indices (Is/FeO) in lower drive tube core 73001 indicate that deposition of an even older “light mantle” preceded the old light mantle and is referred to below as the “ancient” light mantle. The compositional modeling of regolith ejecta that make up the deep drill core zones (§5.0) indicates that two or more, even older mantling deposits exist with sources from the slopes of both the South and North Massifs. Further, it is very likely that other such deposits are present below the basalt cover of the valley, the last of that basalt having been emplaced about 3.82 Ga (see discussion in indented, bracketed paragraphs in §3.3). Basalt eruptions would have begun soon after the formation of the valley at about 3.83 Ga (Schmitt et al., 2017) as a consequence of the Serenitatis basin-forming impact.
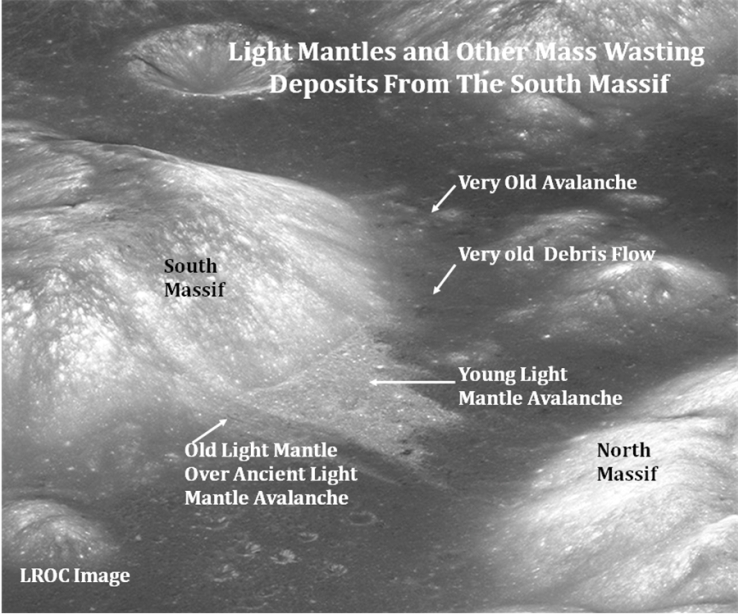 Fig. 13.32a. Obligue, southwest-looking view of light mantles and other mass wasting deposits from the South Massif (NASA LROC image).
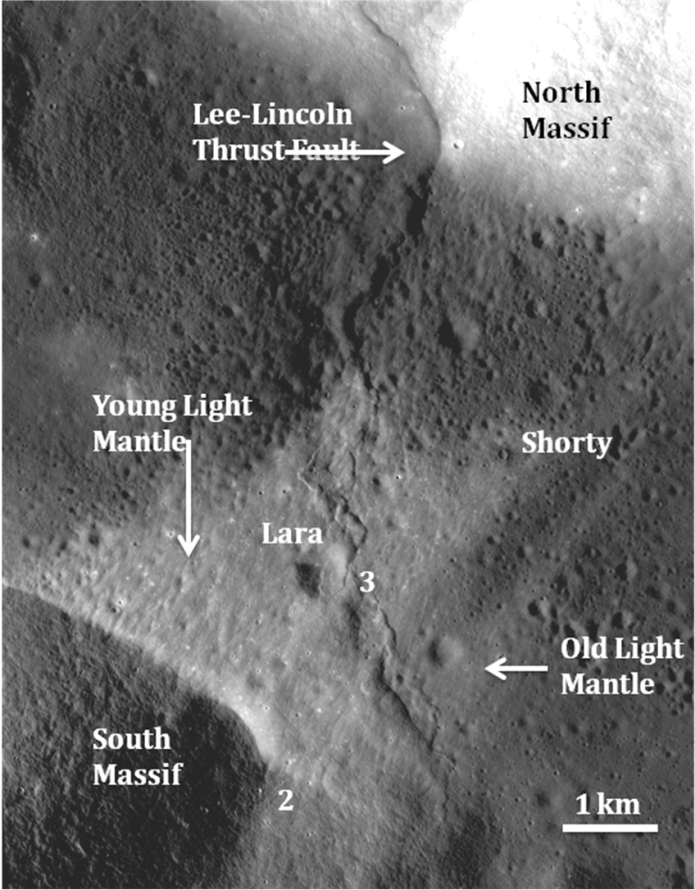 Fig. 13.32b. Overhead view (north up) of young and old light mantles (From NASA LROC image M185684128). “2” indicates location of Station 2 and “3” indicates location of Station 3.
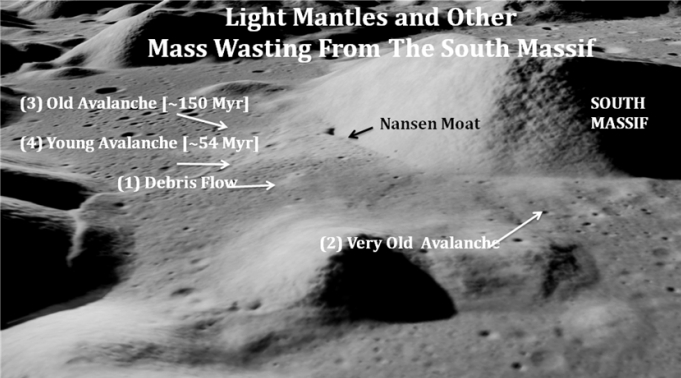 Fig. 13.32c. East-looking view of the light mantles and other mass wasting deposits from the South Massif (DTM base image from Wells (2021) DVD folder).
 Fig. 13.32d. Oblique, southeast view of the mass wasting features from the 26-28 degree, northeast and northwest slopes of the South Massif (DTM base image from Wells (2021) DVD folder).
Large mass wasting events originating from the steep slopes of the South Massif likely began soon after the formation of the Taurus-Littrow graben during the dynamic excavation and radial faulting associated with the Serenitatis basin-forming impact. Fig. 13.32d↑ identifies mass wasting features formed since the partial filling of the graben by ilmenite basalt lavas that would have covered earlier events. The dark surfaced debris flow and possibly the buried avalanche (items 1 and 2, respectively, in Fig. 13.32d) probably occurred soon after the last basalt lava eruption at ~3.82 Ga and before the orange+black pyroclastic ash eruptions that began at ~3.78 Ga (§10.3), whereas the other avalanches (items 3-6) occurred after the last ash eruption at ~3.60 Ga. The most recent events (items 4-6) over the last ~50 Myr may have occurred in response to faulting along the Lee-Lincoln thrust fault, produced as a consequence of the contraction of a cooling Moon.
In discussing the origin of the Taurus-Littrow light mantle deposit (then thought to be one of a kind), Schmitt et al. (2017) stated the following: “In preparation for the geological exploration of the light mantle unit, the senior author speculated that this feature might have been the result of a fluidized avalanche of South Massif regolith. The perpendicular orientation of the unit relative to the northeast-facing slope of the South Massif and its feather[ed] distal ends suggested such an origin. Prior to the Apollo 17 mission, this possibility was discussed with UCLA Professor of Geophysics Ronald Schreve, an early researcher on fluidization of rock debris avalanches (Schreve, 1968). After some discussion, it was concluded that, in order for the material of the light mantle to travel up to 5 km, gases from some source probably fluidized an avalanche of regolith previously developed on the slope of the South Massif.”
The avalanches of light mantle regolith flowed northeast off the ~28º slope of the ~2.2 km high South Massif, with fingers of the deposits extending as much as 5 km across the floor of the valley. The older, and slightly darker of the two youngest light mantles, is exposed largely along the southeastern border of the younger, partially overlying light mantle; however, smaller areas of this old, darker light mantle are present along the northwest border of the young light mantle.
The combined area of the two avalanche deposits covers ~20 km.2, has thicknesses up to 6 m or more, as indicated by the apparent depth of non-penetrating, post-deposition impact craters (Pike, 1974; depth/diameter = ~0.2). These rough dimensions give an estimated combined volume of at least 0.12 km3. The southeast portion of the young light mantle, however, overlies the old light mantle and post-avalanche craters indicate that their combined thickness may be 12 m or more. Dark floored, barely penetrating impact craters on the visible portion of a finger of the old light mantle indicate this finger is between 3 and 6 m thick. Observation (Chapter 11; also Schmitt, 2024b) and Is/FeO values of trench samples 73121 and 73141 from the young light mantle show that 5-10 cm of new regolith has been formed on its surface since the last of these avalanches took place.
Drive tube core 73001/2 was taken at Station 3 through the surface above the young light mantle deposit that lies above a collapsed lobe of the hanging wall of the Lee-Lincoln thrust fault scarp (Chapter 11; Schmitt, 1972, 2024b; Schmitt, et al., 2017). The upper portion of that specific hanging wall lobe lying beneath the light mantles consists of the ejecta blanket of the ~675 m diameter Lara Crater and the regolith developed on that ejecta (Fig. 13.32b↑). Station 3 is about 50 m from the deformed east rim of Lara Crater. Although the young light mantle deposit extends over the location of Station 3, a flow-back feature in Lara Crater from its east wall suggests that the crater rim prevented significant deposition from the young light mantle avalanche (interpreted from LROC images). Analysis of the stratigraphy core 73002 appears to confirm this conclusion (see below).
Schmitt et al. (2017) placed the age of the avalanche that formed the young light mantle as between 110 and 70 Myr, based on a review of the reported cosmic ray exposure ages for boulders that appear younger than the avalanche and crater frequency analyses reported by Van der Bogert et al. (2012). As will be discussed further below, it now may be possible to refine the deposition ages of both the young and old light mantles, as well as understand the avalanches’ origins and dynamics, through a synthesis of in situ observations and photographs; cosmic ray exposure ages; Is/FeO maturity indices (Morris, 1978); uranium plus thorium contents (Silver, 1974; Meyer, 2012); insights gained from the synthesis of deep drill core regolith ejecta zones (70001/9) given in earlier sections; and maturity analyses related to studies of the Station 3 drive tube core (Morris et al., 2022a, b).
17.2 General Relationships
Observations, samples and photographs obtained during Apollo 17 exploration of Stations 2 and 3, and observations and sampling during LRV traverses to and from those stations, provide insights into the geology of the young and old light mantles. The avalanche deposits consist of regolith that previously had accumulated on the northeast slope of the South Massif. The source regolith on the South Massif originally included largely commutated impact breccias and melt breccias (Simon et al., 1981; Wolfe et al. 1981; Shearer et al., 2024), A few percent ilmenite basalt fragments indicate minor regolith ejecta from the valley floor reached the South Massif slope.
The South Massif forms the southwest, northeast-dipping wall of a graben created by the Serenitatis basin-forming event. The currently recognizable mass wasting events (Fig. 13.32a↑-d; Fig. 13.33a↓-c; and §5.0) have occurred in the ~3.82 billion years since the last basalt eruption. The known characteristics of the young and old light mantles are as follows (after Schmitt et al., 2017):
(1). Impact craters do not penetrate the northwestern portion of the young light mantle (Fig. 13.32b↑) with three exceptions (the ~110 m diameter Shorty Crater, Shorty’s nearby ~50 m diameter sister crater, and an 80 m diameter Nansen rim crater). LROC images of 15 m diameter, non-penetrating impact craters, however, set a minimum limit of ~3 m on the thickness of the young light mantle deposit, based on Pike’s (1974) ~0.2 depth to diameter ratio for small lunar craters.
(2). Similarly, 30-50 m diameter, non-penetrating impact craters on the southeastern portion of the combined young and old light mantles (Fig. 13.33a) set a minimum limit of ~10 m on the combined thickness of the two deposits where they overlap, suggesting that both light mantle deposits may be about 5 m thick in their central portions.
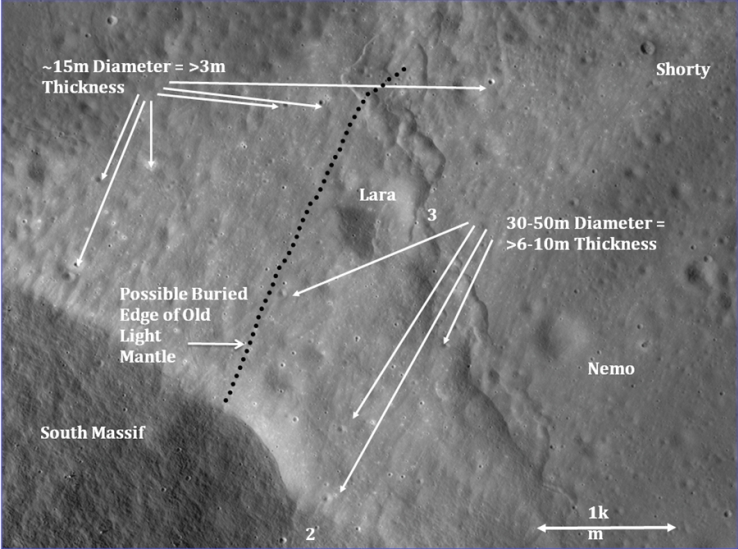 Fig. 13.33a. Overhead image of the young and old light mantle deposits showing craters that establish minimum thicknesses of the deposits (NASA LROC image). Minimum light mantle thicknesses shown by depths of post-deposition craters. Assumed D/d ratio of 5/1 in unconsolidated light mantle material.
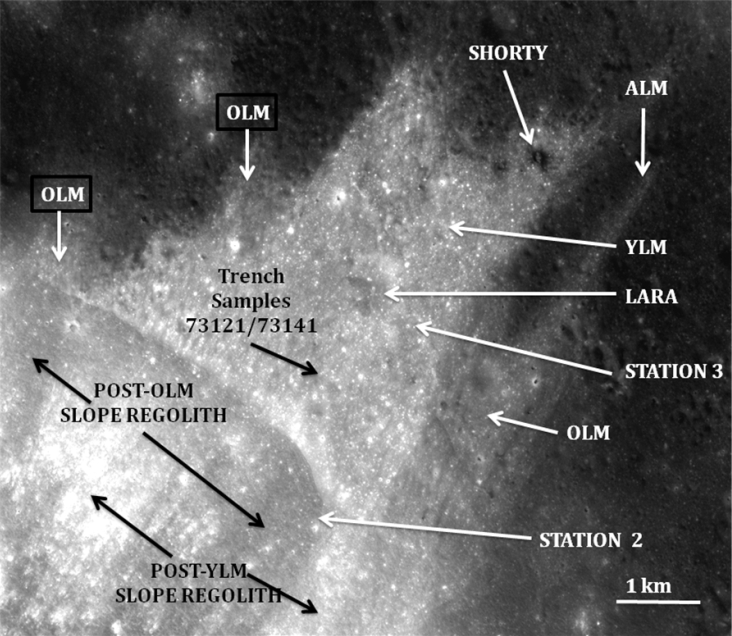 Fig. 13.33b. High-sun, overhead image of the young (YLM) and old (OLM) light mantle deposits (NASA LROC image).
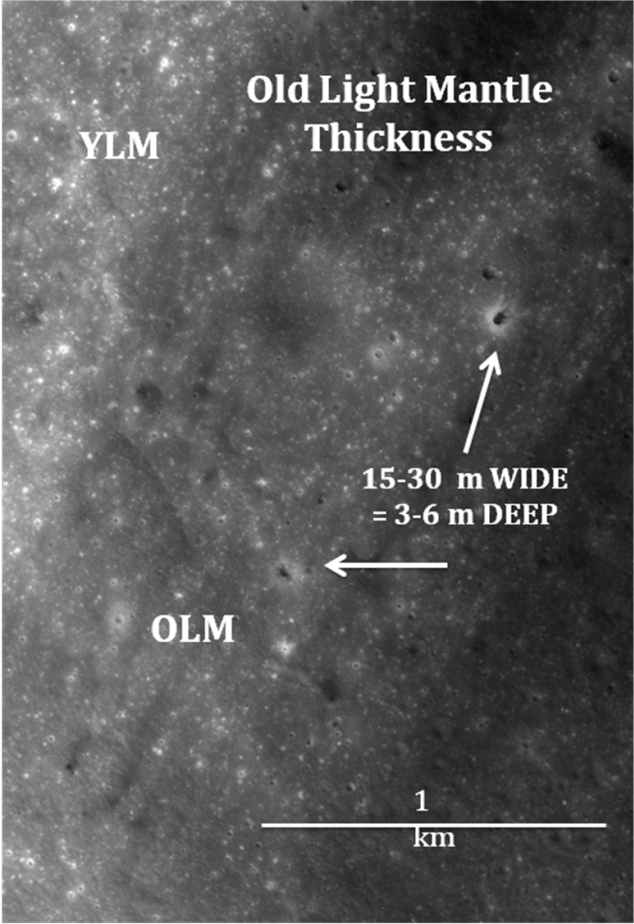 Fig. 13.33c. Penetrating impact craters indicating depth of old light mantle is less than 3-6 m. (NASA LROC image).
(3). LROC and LOLA derived topography, some near-terminator images, and high-sun images suggest that there is a slight depression in the light mantles’ source area on the northeast slope of the South Massif.
(4). The high-sun LROC images (Fig. 13.33b↑) indicate that an area of post-avalanche regolith developed on the slope has old, relatively low albedo, with relatively younger, high albedo pre-avalanche regolith on either side (maturity lowers albedo). This juxtaposition suggests that some, now low albedo, post-old light mantle avalanche regolith remains exposed on the slope.
(5). Field observations (Schmitt, 1972; Chapter 11; Schmitt, 2024b) and post-mission examination of Station 2 rake sample 72500 and Station 3 rock samples (Wolfe et al., 1981; Meyer, 2012) indicate that the rock constituents of the light mantles are complex impact-related breccias similar to, but petrologically more diverse than the three large boulders sampled at Station 2 on the slope of the South Massif.
(6). The upper 5 cm of the young light mantle (rake sample 72700) consists largely of very fine-grained regolith particles, with a paucity of rocks >1 cm in size. Agglutinates (~44%) are abundant and dark mantle regolith fragments (including orange+black ash) are scarce (Heiken and McKay, 1974). 72700 contains about five times fewer rock fragments >1 cm in diameter than does rake sample 72500 from the nearby slope of the South Massif (Chapter 11; Schmitt, 2024b; Wolfe et al., 1981}.
(7). The bright return from the light mantle to the 12.6 cm Mini-RF S1 radar (Raney, 2011; Fig. 13.34) confirms Schmitt’s field observation (Chapter 11; Schmitt, 2024b) of the wall of a fresh, ~1 m diameter impact crater that the young light mantle is slightly indurated, but likely fractured below the ~5 cm of gardened, post-avalanche regolith (73131).
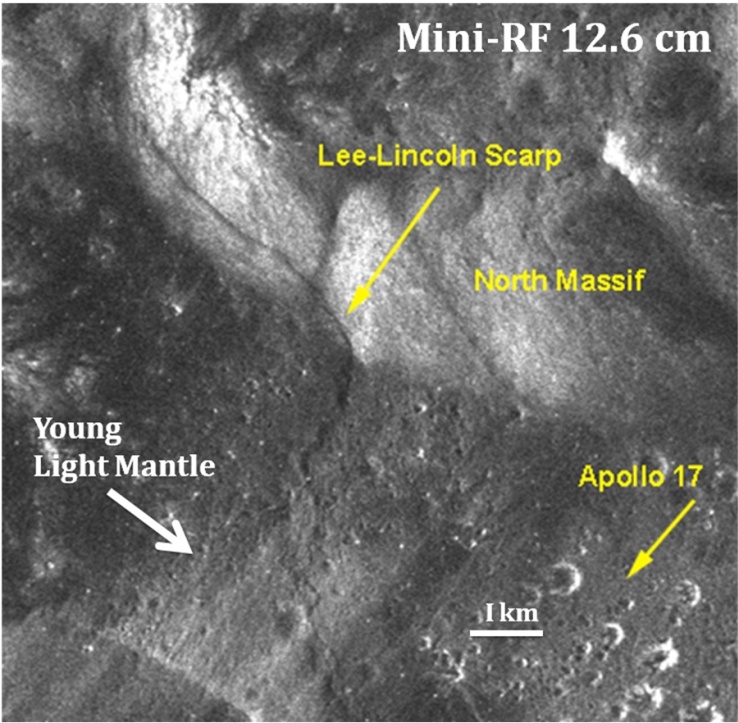 Fig. 13.34. 12.6 cm Mini-RF S1 radar image of the light mantles showing a distinct radar return suggesting fractured indurated regolith and/or large rock fragments in the upper 10s of centimeters.
(8). Observations and photographs obtained during Apollo 17 LRV traverses across the young light mantle and at Station 3, as well as high resolution LROC imagery, show that rocks and boulders on the light mantle are only abundant at the rims of the larger impact craters, suggesting that such rocks and boulders are concentrated at depth, as would be expected in a fluidized, flowing regolith medium.
(9). Schmitt et al. (2017) discuss the surface topography of the young light mantle as follows: “LROC images [Fig. 13.35] show that parallel, ridge and swale longitudinal lineations on the surface of the light mantle extend perpendicular to the [northeast] base of the South Massif, with the same bearing as its distal plumes. These lineations exhibit a crest to crest wavelength of 100-200 m…” There is “…a lineation pattern of much shorter wavelength (20-50 m) on the [interior] southwest-facing slope of the Nansen moat at the base of the South Massif.” Magnarini et al. (2021) use the spacing of these longitudinal lineations (“ridges”) to estimate the thickness of the light mantle deposits. Near the base of the South Massif, their estimate is a factor of ~2 greater than the minimum indicated by impact craters. ~0.7 km further away from the base of the massif that estimate is a factor of ~6 greater. These discrepancies indicate our understanding of the relationship between light mantle lineations and thicknesses is incomplete.
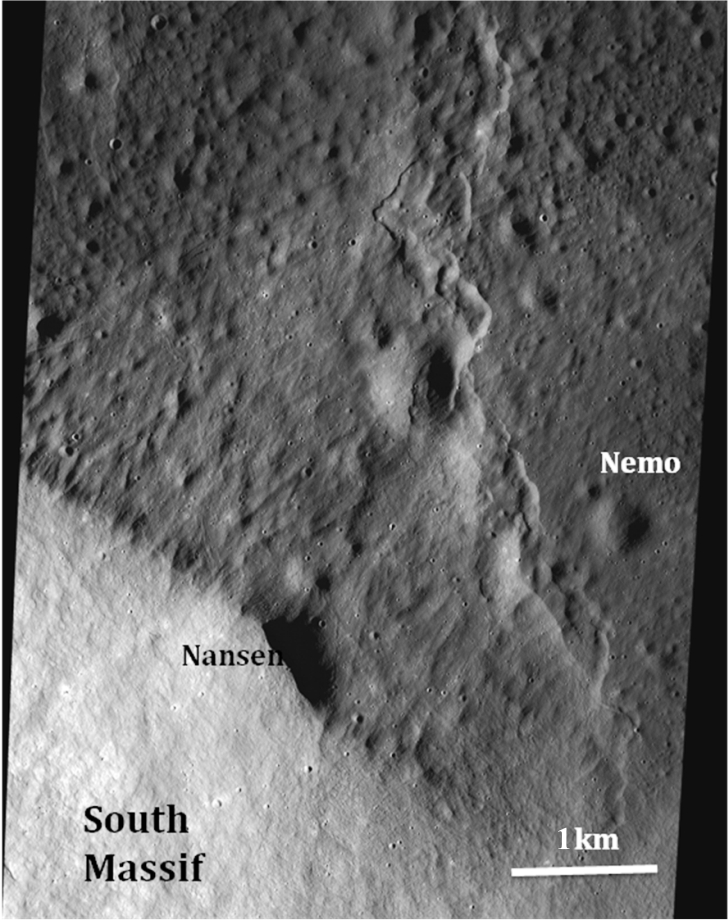 Fig. 13.35. Low-sun image showing longitudinal ridge and swale surface texture of the young light mantle (NASA LROC image).
(10). Schmitt et al., (2017) also note that LROC images show “a few shallow, graben-like linear depressions cross the trough and swale lineations at oblique angles within about a kilometer of the base of the South Massif. These grabens may have developed by extensional stress late in the flow, settling and compaction history of the avalanche.” The existence of these grabens further indicates that the young light mantle is indurated to the extent that fault scarps can be supported.
(11). No significant differences are reported in volatile contents between the light mantle and its South Massif source area regolith. Saturation in the sampled surface regoliths, however, may have been reached for solar wind volatiles. Schmitt et al. (2017) apparently misread sample numbers in Petrowski et al. (1974) relative to a difference in sulfur content in rake samples 72500 and 72700. Little difference in sulfur content actually is reported.
The above observations are consistent with the hypothesis that the light mantle was formed from fluidized regolith in which mass to surface area ratio variations caused fine particles to be concentrated near the top of the avalanche and large fragments to be more abundant at depth. Schmitt et al. (2017) also suggest “compaction by settling during the late stages of fluid (gas) escape upwards (see Schreve, 1968; Valverde and Castellanos, 2006)” to explain the observed induration; however, as Schmitt et al. (2017) also point out, the 12.6 cm radar returns are sensitive to only 1-1.5 m depth (Raney, 2007; Nozette et al., 2010; Raney et al., 2011) so induration may extend at least to that depth. On the other hand, as Schmitt et al. (2017) add, decimeter-sized rock fragments would also increase in frequency with depth in a fluidized medium.
17.3 Light Mantle Avalanche Dynamics
A number of sources of “fluidization” of lunar avalanches have been proposed: volatile release, high frequency pressure variations, and pseudo fluidization by dust dynamics. Relative to the first hypothesis, comparison of the solar wind volatile content of sample 10084 with regolith breccias retuned by Apollo 11 led Schmitt (2006) to conclude that agitation occurring between sampling and analysis released about 40% of the in situ volatiles implanted by the solar wind. Later analysis (§29.0), however, suggests that this rather benign agitation may not significantly affect volatile concentrations. On the other hand, vigorous agitation may be much more of an issue. The author’s unpublished comparison of helium analyses of deep drill core zones with their probable source regolith samples suggests that rotary percussive drilling agitation caused losses of up to 75% of the helium in source sample. In further support of this hypothesis, Carrier et al., (1973) report the release of solar wind hydrogen during tests related to geotechnical agitation of lunar regolith. These data indicate that solar wind volatiles could have fluidized the light mantle avalanches, once significant down-slope motion had begun, particularly in the vigorous, dynamic environment of an avalanche.
Alternatively, Melosh (1977) and Collins and Melosh (2003) suggest that acoustic fluidization may occur as a consequence of high frequency pressure variations generated as the regolith pile collapsed and began to flow. Further, Scott (1987) has proposed a “pseudo-fluidized condition” in which the dynamic motion of regolith particles at the base of a lunar avalanche creates an effectively “fluidized” layer that supports the avalanche. All three of the proposed mechanisms might be active; however, the presence of several hundred parts per million each solar wind hydrogen, helium, carbon and nitrogen (Heiken et al., 1992) in samples such as 72501 and 72701, even after any post-sampling agitation losses, make it likely that agitation-induced, solar wind volatile fluidization is the largest contributing factor to the long-run-out character of the light mantles.
A L/H ratio >1.7 is the standard variable used to characterize the dynamics of long run-out “landslides,” debris flows and avalanches, where L is flow length and H is height of its source. L/H is referred to as the “net efficiency” (Iverson, 1997) of a debris flow. The young light mantle’s L/H is ~2.3 (L = ~5.0 km maximum run-out length and H = ~2.2 km maximum height (Magnarini et al., 2021). This is about a factor of 10 less than comparable volumes of water-rich, poorly sorted, terrestrial pyroclastic debris flows (Iverson, 1997). As stated by Schmitt et al. (2017), “This comparison suggests that the physics of volatile fluidization of the light mantle avalanche was not comparable to [water-rich] pyroclastic flows. The young light mantle avalanche meets the definition of a long run-out, water fluidization of terrestrial debris flows of similar masses, possibly due to [1/6g] and a rapid loss of [solar wind] volatiles to vacuum or to more transient acoustical or pseudo-fluidization processes noted above. The highly irregular surfaces of most of the particles within the avalanche also may increase the internal frictional losses of kinetic energy relative to terrestrial pyroclastic flows.”
17.4 Deposition Age of the Young Light Mantle
The young relative ages of both light mantle deposits are shown by (1) their superposition on the basaltic, “dark mantle” regolith surface; (2) the lower albedo from space weathering of the old light mantle; and (3) the presence of less than ~10 cm of new gardening and regolith development since young light mantle deposition as shown in the trench, from which samples 73121 and 76141 were taken (Schmitt, 1972; Chapter 11; Schmitt, 2024b).
Avalanche erosion and/or macro- and micro-meter impact gardening and related down-slope mass wasting have erased any uphill tracks of the many boulders now resting near the base of the slope of the South Massif in the near vicinity of Station 2 and above the light mantle deposits. To the northwest of Station 2, boulders that have rolled into the Nansen Moat do have tracks, indicating that they have arrived since the young light mantle avalanche.
Of the three boulders sampled at Station 2, Boulder 1 appears to be the first of the three to have rolled into place. Unlike the other two boulders sampled, the lower portion of Boulder 1 is embedded in the slope regolith (Fig. 13.36↓). Direct field observation and study of Hasselblad and LROC photographic images show that any uphill track that would lead to its source has completely disappeared either due to erosion by avalanche or impact mass-wasting. These observations, however, do not totally eliminate the possibility that Boulder 1 remained in place during the avalanche and has been partially uncovered since or, alternatively, it rolled into place as part of the avalanche.
Several cosmic ray exposure ages have been reported on the samples taken from Boulder 1 (Leich et al., 1975; Arvidson et al., 1976; Drozd et al., 1977) with the youngest being Leich et al.’s Kr exposure age of 52.5 ± 1.4 Myr for sample 72275. This latter sample was from the top of Boulder 1 (Schmitt, 1972; Chapter 11; Schmitt, 2024b) and was exposed to a full cosmic ray flux rather than being partially shielded by the boulder. Unlike the other two examined boulders at Station 2, Boulder 1 may have been over-ridden by both avalanches and been partially uncovered subsequently. It should be noted that the cosmic ray ages are on samples that were first exposed to cosmic rays after the end of dynamic shedding of the original surface of the boulder during its roll down the massif slope.
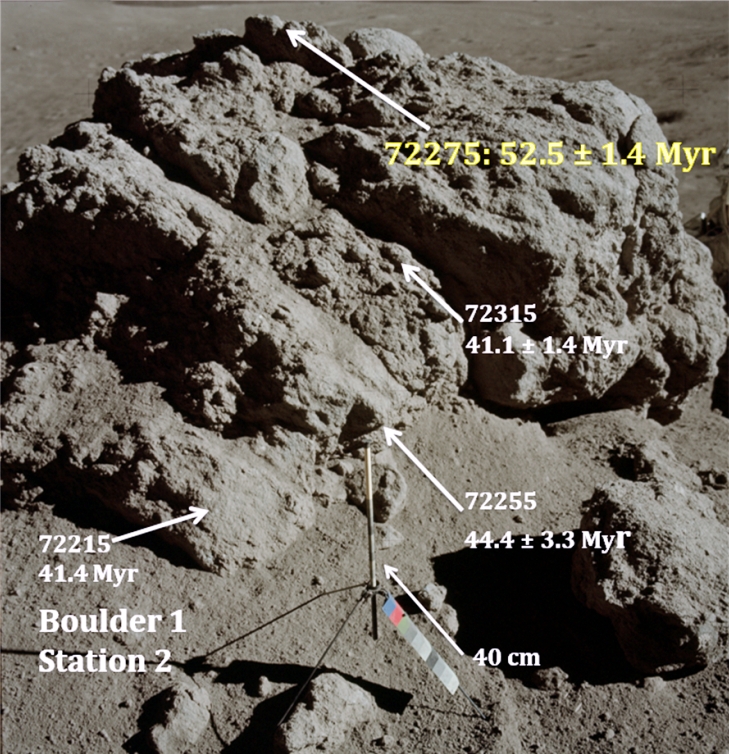 Fig. 13.36. Northwest looking view of South Massif Boulder 1 at Station 2 showing the location and cosmic ray exposure age (Leich et al., 1975) of sample 72275 and the embedded nature of the lower portion of the boulder in post-young light mantle regolith present on the slope of the massif. Locations and reported exposure ages of samples 72215, 72235 and 72255 also are indicated, however these latter three samples have been partially shielded from cosmic rays by their position on the side of the boulder. (NASA Photo AS17-137-20900).
It has been proposed by (Arvidson et al., 1976; Drozd et al, 1977; Lucchitta, 1977) that the light mantle deposit was the result of the impact of ejecta from Tycho Crater, ~2350 km (Lunar QuickMap) to the southwest. This hypothesis is based on the presence of an ejecta ray that appears to cross the valley of Taurus-Littrow and traces back to Tycho Crater. This Tycho origin hypothesis also partially rests on the assumption that impact craters in the Crater Cluster, present several kilometers east of the old and young light mantles, are Tycho secondary craters. These suggestions and conclusions predated this work’s identification of several other large mass wasting events of different relative ages from the slopes of the South Massif, a fact that would make it unlikely, but not impossible that Tycho ejecta was the trigger for the young light mantle avalanche.
Further, this work (§6.0) on the relative and absolute ages of the 400-800 m diameter craters that make up the Crater Cluster, and their regolith ejecta sampled by the deep drill core, indicate that the Cluster is comprised of at least five different impact events (Table 13.3a↑), including four elliptical craters, apparently formed by simultaneous impacts of a cometary aggregate (§5.0, zone U). A more likely alternative for triggering repeated, large mass wasting events would be movements on the Lee-Lincoln thrust fault, with a total accumulated throw of ~500 m (Schmitt et al., 2017), that has been active in the same part of the valley as the light mantle avalanches.
In Shearer et al. (2024), this author suggested that the Liech et al. exposure age of 52.5 ± 1.4 Myr is the age of the young light mantle avalanche. This suggestion can be tested against the ∆Is/FeO for the young light mantle skim sample 74121 (Is/FeO = 88; Morris et al., 1978). Using the un-gardened sample 73141 (Is/FeO = 48; Morris et al., 1978) from the bottom of a trench in the young light mantle (Chapter 11; Schmitt, 2024b) as the original Is/FeO of its source regolith, the ∆Is/FeO for skim sample 74121 = 40. With a young light mantle U+Th = 3.45 ppm (Silver, 1974 for young light mantle sample 73221), its alpha+beta-only ∆Is/FeO / Myr = 2.00 (0.58 × 3.45 ppm). This value added to a solar proton-only ∆Is/FeO / Myr = 0.11 give a total ∆Is/FeO / Myr = 2.11 for skim sample 74121. 2.11 divided into ∆Is/FeO = 40 gives ~19 Myr as the age of deposition for the young light mantle (see §6.0).
~19 Myr is a much younger age than previously suggested (Schmitt et al., 2017; Schmitt in Shearer et al., 2024) and raises the possibility that the seismic event that triggered the young light mantle avalanche also triggered the down-slope movement of the boulder at Station 6 estimated to have occurred at ~19.5 Myr based on cosmic ray exposure age data (§6.0).
[In the testing of the initially calculated 10-15 Myr pre-burial exposure age of the old light mantle against an expected comparable value of the post-old light mantle slope Is/FeO (see below §17.10), the value of buried sample 73141’s Is/FeO = 48 comes into question as to being representative of the correct value of the deposition Is/FeO pre-young light mantle. In order for the pre-burial old light mantle exposure age range and the post-old light mantle slope exposure age range to match, a 57-35% contamination of 73141 regolith by older slope material is required. If so, the actual young light mantle deposition Is/FeO would be between 21 and 31 rather than 48. Note that mixed albedos shown in Fig. 13.31b↑ in §17.2 suggests that such slope contamination is occurring today.
[Following the preceding methodology for determining the exposure age of the young light mantle, namely subtracting 73141’s revised Is/FeO values of between 21 and 31 from 74121’s Is/FeO = 88, results in a ∆Is/FeO range of 69-57 rather than the 40 previously used to calculate the ~19 Myr exposure age for the young light mantle. In turn, this range of ΔIs/FeO values results in a range of exposure ages of ~27-32 Myr (56 and 68 / 2.11) rather than 19 Myr. Following the logic in §17.10, this writer suggests that the range of 27-32 Myr for young light mantle deposition is the best conclusion.]
One of the puzzles in working with maturity indices related to light mantle samples is that those for Station 2 rake samples 72501 (Is/FeO = 81) and 72701 (Is/FeO = 61) differ significantly from each other. As 72501 came from the post-young light mantle avalanche slope and 72701 came from the surface of the nearby young light mantle, it would be expected that the two maturity indices would be roughly the same. The higher U+Th content of 72501 (Meyer, 2012, 4.4 ppm – average of 7) versus that of 72701 (3.82 ppm – average of 2) may be one reason that this is not the case (see §6.3.2). Another explanation of this apparent mismatch may be in the mixing of Is/FeO = 48 regolith ejecta (buried 73141) into the 72701 rake sample area by a nearby, relatively young impact excavation deep enough to sample regolith with Is/FeO = 48 as found in deep trench sample 73141. This possibility is illustrated in Fig. 13.37.
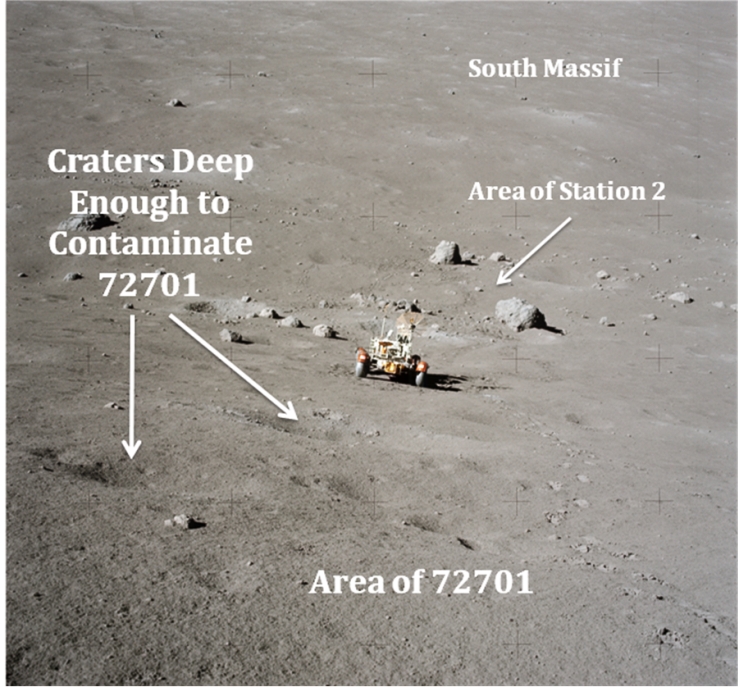 Fig. 13.37. Area of the rake sample 72001 (Wolfe et al., 1981) showing impact craters (arrows) deep enough to have tapped Is/FeO = 48 ejecta to the sample. (NASA Photo AS17-137-20976).
17.5 Stratigraphy of Light Mantles in Core 73001/2
The original 1972 exploration planning for Station 3 near the base of the Lee-Lincoln Scarp centered on the possibility of sampling residual, fault-related volatiles, as well as the upper 70 cm of the “light mantle,” then considered the only large-scale mass wasting deposit in Taurus-Littrow valley. Close examination of the Is/FeO and reflectance data (Morris et al., 2022a, b) and other information on the core 73001/2 obtained at Station 3, however, shows that the core largely sampled old light mantle materials and only a few centimeters of the overlying young light mantle (Fig. 13.38).
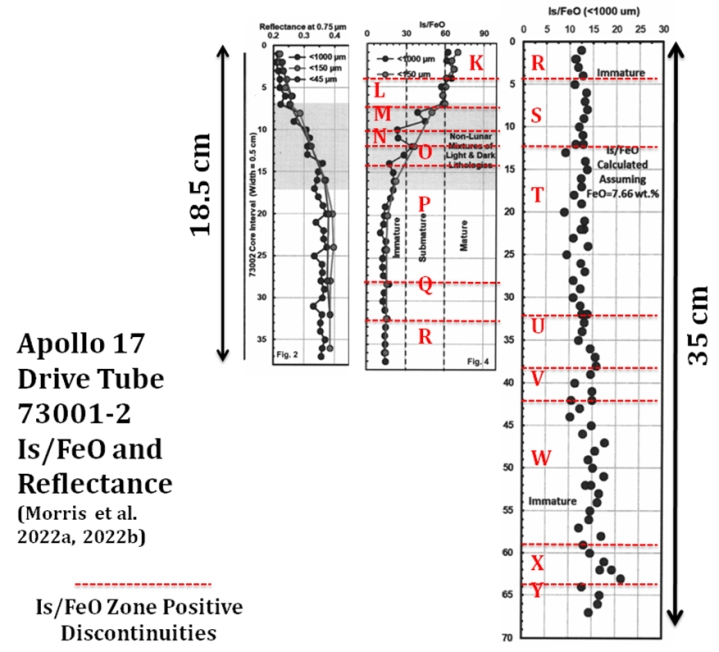 Fig. 13.38. Is/FeO and reflectance values for drive tube core 73001/2 also showing lettered zones K-Y as defined by non-reset (small impact related decreases) anomalies (after Morris et al., 2022a, b).
Station 3 of EVA-2 is located on a thin deposit of young light mantle, lying on top of the old light mantle. As the station also is only ~50 m east of the rim of Lara Crater, the potential exists, also unrecognized in the EVA planning stage, that Lara Crater’s east rim diverted most of the flow of the young light mantle avalanche in the vicinity of Station 3.
In recent broad analysis activities related to drive tube core 73001/2 by the Apollo Next Generation Sample Analysis (ANGSA) team (Shearer et al., 2022, 2024), there has been significant debate over (1) whether the core actually penetrated into the old light mantle and (2) whether core material was lost from the top or from the bottom of upper core 73002.
The primary reason this writer concludes that core 73001/2 penetrated through a thin cover of young light mantle into old light mantle is the consistent value of Is/FeO = ~14 below about 8.5 cm in the compacted upper core, 73002, and through all but the lower ~10 cm of the lower core, 73001. For this lower regolith to be young light mantle, trench sample 73141 would indicate its immediate post-deposition value should equal to 48, the value found below the visually obviously gardened and space weathered surface ~5-10 cm (Chapter 11; Schmitt, 2024b) of the young light mantle (trench sample 73121). (The trench from which 73121 and 73141 were obtained is located in a broad young light mantle area that appears to be representative of the upper portion of that deposit as a whole.)
Field observations and LROC images (Fig. 13.32a↑ and Fig. 13.32b↑) and high-sun LRO images showing albedo differences indicate that top zone K in 73002 is clearly related to the young light mantle. An Is/FeO value of ~70 at the top of that zone, however, appears incompatible with young light mantle surface samples 74121 and 73121 (Is/FeO = 88 and 78, respectively. A few centimeters of the upper core, however, appear have been lost during sampling and with it was lost the more mature portion of the surface regolith originally at the site of the core. In addition, the very loose top portion of regolith in upper core 73002 would be more likely to be lost during handling than the tightly compacted bottom portion.
[As he handled the core, E. A. Cernan (1972), who extracted and capped the core, commented, “…about an inch [or] inch and a half of the core has just ‘zero-g’d’ or ‘one-sixth-g’d’ itself right out [of the tube.]” (Chapter 11; Schmitt, 2024b). Whether any lost core could account for the 8 to 18 point difference in Is/FeO relative to young light mantle surface samples 73121 and 74121 cannot be determined in the absence of a control, skim sample of young light mantle from near the core. The Is/FeO is 43 (Morris, 1978) for the skim sample 73221 of young light mantle at the trench dug in the rim of a crater about 20 m away, but this sample has not been exposed to maturation for a full 27-32 Myr. On the other hand, extrapolation of the average slope of the line defined by the <150 µm fraction in Fig. 13.38↑ to an Is/FeO value of 88 (74121) would add ~3.75 cm to the core, that is, about an “inch and a half”, as Cernan described. As Cernan’s statement was made before the upper core 73002 was compacted to ~18.5 cm from 35 cm, the loss of loose surface regolith with a significantly higher maturity index than 70 likely occurred. The reported (Shearer, et al., 2024) visible, sloping textural discontinuity at the top of 73002 may be an indication of disturbance during this loss of core.]
[The thinness of the young light mantle at the top of core 73002, as compared with a thickness of several meters elsewhere, likely is the result of the partial diversion of its avalanche’s flow by the east wall and rim of Lara Crater. A tongue of backflow young light mantle from the east wall of Lara Crater onto its floor visible in Fig. 13.32b↑ supports this conclusion.]
[As part of ongoing studies (Shearer et al., 2022, 2024) of the Station 3 drive tube core, Morris et al. (2022a, b) report Is/FeO values for the current 53.5 cm and reflectance values for the upper 18.5 cm on half-centimeter intervals for the current compacted 18.5 cm upper core (Fig. 13.38↑). (The original upper core on the Moon measured ~70 cm.) Total Is/FeO values downward go from ~70 to 60 in the first 3.5 cm; then decrease irregularly from 60 to ~14 between 3.5 and 8.5 cm; oscillate around 14 ± 5 from 8.5 to 48.5 cm; and finally oscillate around 16 ± 5 from 39.5 to 53.5 cm. Reflectance values at a 0.75 µ wavelength rise linearly from 0.22 to 0.38 from 0 to 10 cm and then hold at 0.35 ± 0.03 from 10 to 18.5 cm with the reflectance from size fractions <150 µ about 0.02 points greater than fractions <1000 µ. Reflectance has not been measured below 18.5 cm but probably is roughly at 0.35 ± 0.03 µ as it closely tracks the Is/FeO values below 10 cm in upper core 73002.]
[Very local and small amounts of alpha+beta-only reduction of Fe++ to Feo after post-burial cessation of impact gardening has increased Is/FeO and decreased reflectance values given in Fig. 13.38↑ by small, but consistent and related amounts. This has taken place since deposition in the case of zones P-Y (7.5 cm to bottom of core) or burial by the young light mantle in the case of zones M-O (3.5-7.5 cm). The relative values of Is/FeO and reflectance, however, have not been changed and post-burial, alpha+beta maturation is very limited as discussed at the end of §6.4.1.]
Zones M-O (3.5 to 7.5 cm) in the upper portion of core 73002 appear to be an inter-layering of regolith portions having slightly higher and lower reflectance values along with light mantle material with variable but generally decreasing Is/FeO values. Table 13.27 provides additional data on these zones.
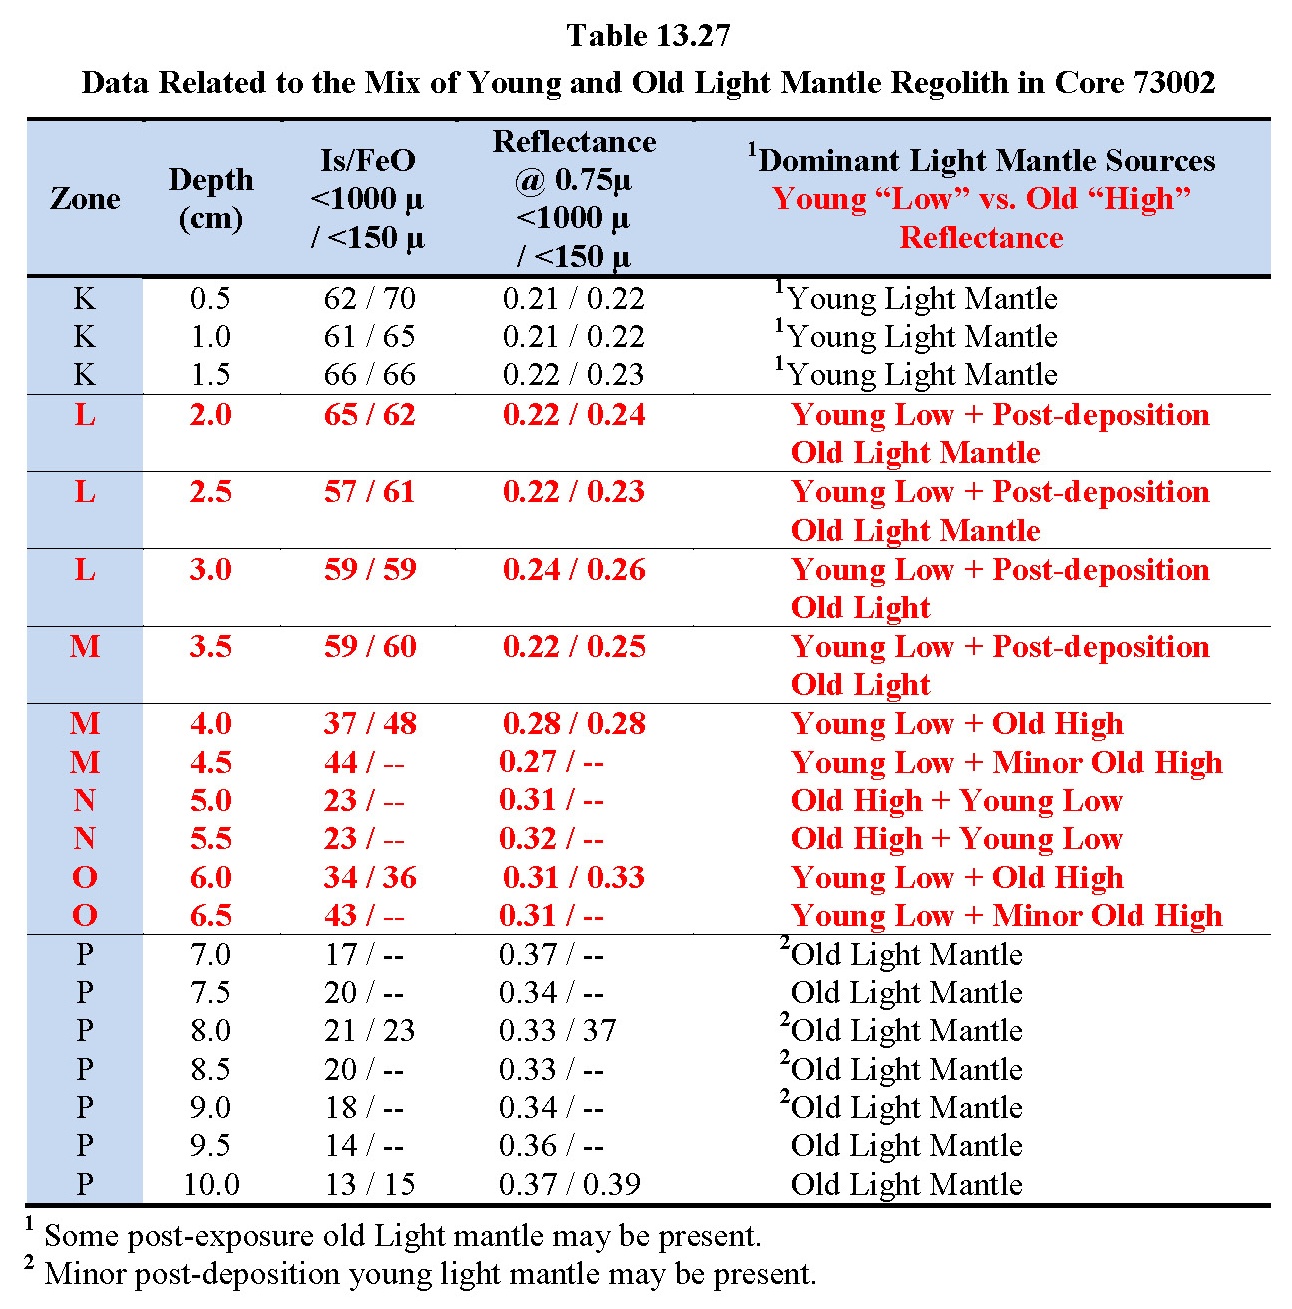
Zones P-W in Fig. 13.38↑ between 7.5 and 48.5 cm, with relatively consistent and very immature Is/FeO values of 14 ± 5 and nearly constant reflectance represent the old light mantle’s pre-deposition Is/FeO. They also represent the Is/FeO of the pre-old light mantle regolith on the slope of the South Massif that only could have been accumulated after a third and even older, “ancient” avalanche cleared the massif slope. The noticeable change in Is/FeO values to 16 ± 5 between 39.5 and 53.5 cm, i.e., zones X and Y, may reflect the uppermost portion of the mixing zone between the old and ancient avalanches, similar to that seen for old and young light mantle avalanches in zones M-O.The M-O zones in Fig. 13.38↑ and Table 13.27 are made up of mixtures of three Is/FeO components: (1) post-deposition and previously exposed old light mantle of Is/FeO >14; (2) unexposed post-deposition old light mantle Is/FeO = ~14 (73001); and (3) immediately post-deposition young light mantle with Is/FeO = 48 (73141). Any half-cm portion of this mixed zone that has an Is/FeO <48, therefore, contains some post-deposition old light mantle with Is/FeO = 14 or greater but <48. The indication in Column 5 of Table 13.27, suggesting old or young mantle dominance in each 0.5 cm interval of these zones, is based on whether its measured Is/FeO is less than or greater than an Is/FeO of 31, the mid-Is/FeO value between 14 and 48.
17.6 Stratigraphic Data in Core 73001/2
Some specific stratigraphic data have been reported (Table 13.28↓) for core 73001/2; however, interpretations of these findings are inconsistent. Unlike the interpretation here that core 73001/2 largely sampled the old light mantle, except for the upper few centimeters, others have proposed that the core only sampled young light mantle. This debate is destined to continue for some time. Two areas of agreement are: (1) that the material in the core is derived from regolith accumulated on the slope of the South Massif and subsequently incorporated in avalanches and (2) that impacts in the ilmenite basalt regolith away from the light mantle deposits have contributed a small fraction of basalt fragments and pyroclastic ash to the core sample.
In the analysis presented here, the only true stratigraphic variations in the entire double core 73001/2 probably are: (1) the young light mantle regolith between 0 and 3.5 cm; (2) the mixed contact zone of young light mantle with old light mantle between 3.5 and ~8.5 cm with increasing reflectance and decreasing Is/FeO, FeO, TiO2, and basalt fragments (§17.11, Fig. 13.46↓); and (3) the possible mixed contact (9 point Is/FeO increase below 39.5 cm) between old light mantle and ancient light mantle between 39.5 cm and the bottom of the core at 53.5 cm.
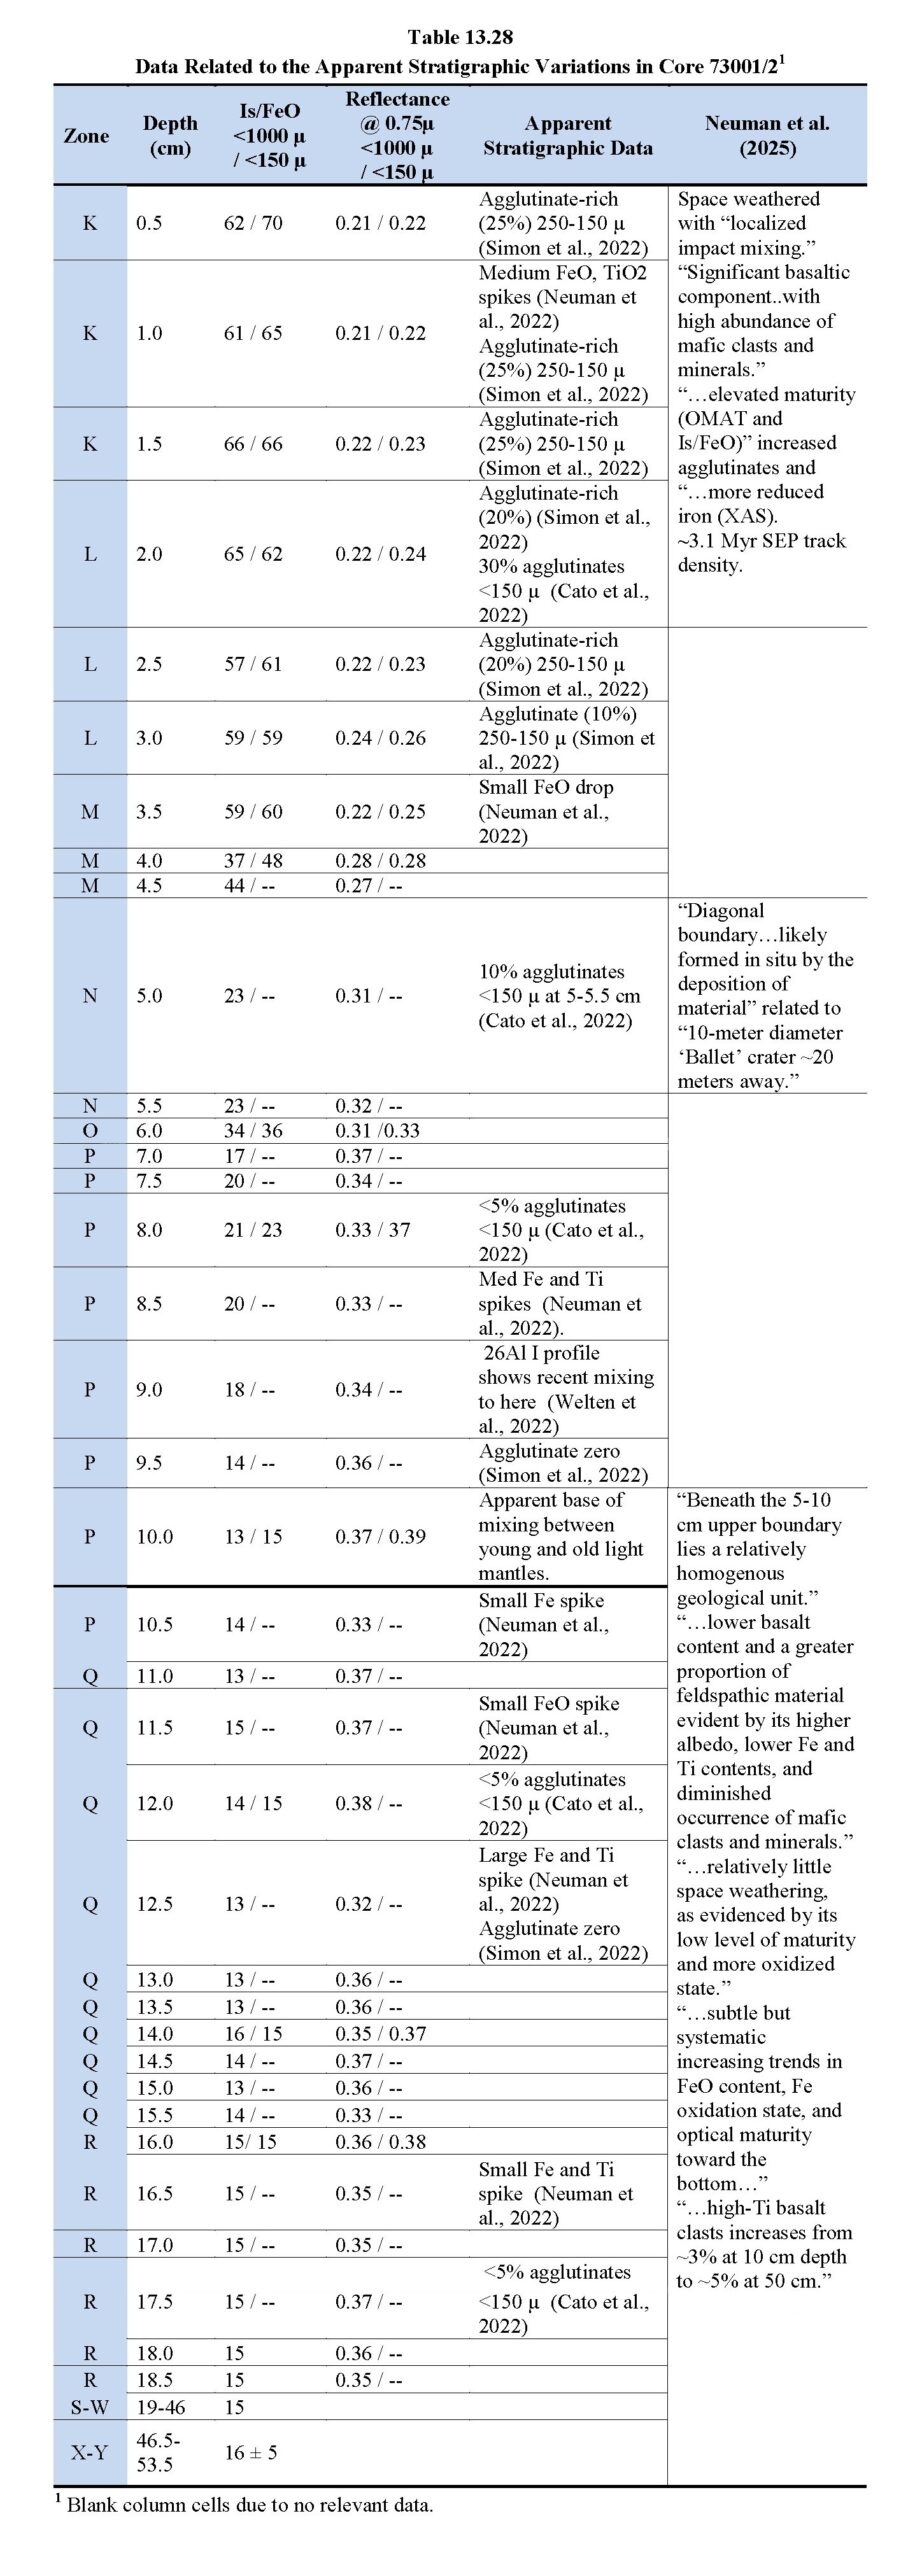
Links for Simon et al. (2022), Neuman et al. (2022, 2025), Cato et al. (2022) and Welten et al. (2022).Of note is the fact that the ratios of total Is/FeO (Morris et al., 2022a) to total modal% agglutinate (Simon et al., 2022) in upper core 73002 are somewhat lower than the 4.96 ± ~1.5 found in the deep drill core (Table 13.2a↑). The ratio for the light mantle portion (0-3.5 cm) of 73002 is ~3.3 (60 / 21). If the maximum total Is/FeO of 88 for the young light mantle is used for comparison, however, the ratio is ~4.2, within the error limits for the deep drill core and essentially the same as the mean value in Table 13.2a. The old light mantle portion (below 9.5 cm of 73002 has this ratio at ~5.0 (14 / ~2.8). These data further support the use of modal% agglutinate times ~4.96 as a surrogate for total Is/FeO (§3.2.1), if Is/FeO values are not available. The lower ratios, however, may reflect the lower ilmenite content of the South Massif derived regolith relative to the regolith zones in the deep drill core.
17.7 Deposition Age of the Old Light Mantle
LROC and Apollo orbital images of the young light mantle and old light mantle show the currently exposed old light mantle surfaces have a lower albedo (lower reflectance) than the young light mantle, recording longer exposure to space weather effects. In contrast, below the remaining 3.5 cm of young light mantle regolith in the upper core 73002, reflectance increases to a value 1.5 times greater at 8.5 cm than that for the sampled young light mantle (Fig. 13.38↑) above 3.5 cm. This contrast continues throughout the remainder of upper core 73002. Given their comparable U+Th contents (i.e., alpha+beta-only maturation rate is approximately the same), this increase in reflectance of material below the young light mantle shows that the old light mantle’s exposure to the proton and gardening environment at the surface was significantly less than that of the currently exposed young light mantle. This fact subsequently is referred to as the “surface exposure constraint”
The surface exposure constraint also is evident, inversely, in the core’s Is/FeO data. Below 3.5 cm, the value of Is/FeO decreases by a factor of ~4.3 from 60 to a roughly constant value of 14 ± 5 from 8.5 to 43 cm. From 39.5 cm to the end of the core at 53.5 cm, Is/FeO is variable at 16 ± 5.
It may be possible to make a good estimate of the total ∆Is/FeO of the exposed old light mantle prior to its burial by the young light mantle by consideration of the mixing trends in zones M-O of Table 13.27↑ and Fig. 13.38↑. An estimate of ∆Is/FeO for the old light mantle as compared against the 27-32 Myr’s worth of ∆Is/FeO of the young light mantle can give a rough estimate of the exposure age of the old light mantle. First, however, we must be sure that the U+Th content of the two light mantles essentially are the same, as they are likely to be, so that the alpha+beta-only ∆Is/FeO / Myr for the two mantles is a constant.
Jolliff (pers. comm.) reports that the U+Th content in 73001/2 overall has a mean of ~3.5 ppm (3.11-4.38 ppm), increasing to a mean of 3.8 ppm (3.5-4.1 ppm) between 44 and 53.5 cm. The mean value of 3.5 is essentially the same as surface trench sample 73121 (3.45 ppm) from the young light mantle. It also is close to that of 3.447 ppm reported by Silver (1974) for young light mantle trench surface skim sample 73221 (reported by Silver as nonexistent 73321), having been obtained about 20 m away from the site of core 73001/2. As 3.45 ppm appears to be a good estimate for the U+Th content of the old light mantle, its ∆Is/FeO / Myr value would be the same as that for the young light mantle, i.e., ~2.11 (§17.11).
Given the surface exposure constraint that the old light mantle was exposed less than the young light mantle, that is, its ∆Is/FeO would be less than 40, that of young light mantle skim sample 74121.
Due to the disruption of the interval between the compacted 3.5 and 8.5 cm of upper core 73002 (zones M-O in Fig. 13.39↓) by the dynamics of the flow of the young light mantle avalanche, that flow also disrupted the portion of the old light mantle previously exposed to surface maturation and gardening. As a consequence, there is no means to directly define the maximum ∆Is/FeO of the pre-burial old light mantle. Measured Is/FeOs in this interval correspond to the irregular mixing of three regolith components: (1) immediate post-deposition young light mantle (~48); (2) previously unexposed old light mantle (~14); and (3) total Is/FeOs related to pre-burial, exposed old light mantle that is somewhere between 48 and 14 and significantly less than 40 (the maximum ∆Is/FeO for the young light mantle from sample 74121).
Is/FeO values in upper core 73002 rise more or less asymptotically to a value of ~60 that holds for five, 0.5 cm intervals in zones L and K and which would correspond to the lower, less gardened and less mature portions of the young light mantle. This, at first, might suggest that the ∆Is/FeO for the old light mantle’s pre-burial surface exposure is ~46 (60 – 14), however, a value of 46 would violate the surface exposure constraint by being >40.
In Fig. 13.39↓, it appears that the base of old light mantle impact gardening is recorded at 10 cm depth (upper portion of zone P) where measured Is/FeO begins to rise with decreasing depth. That indication of original gardening and space weathering for the old light mantle continues for ~2 cm prior to indications of the disturbance in zone O induced by the deposition of young light mantle.
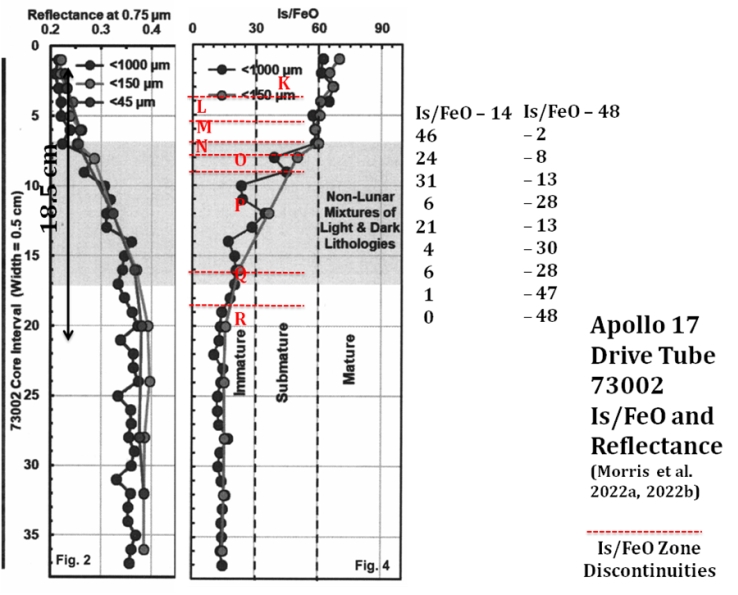 Fig. 13.39. Enlargement of the Morris et al. (2022a, b) graphical data for upper core 73002 (Fig. 13.38↑), including two columns to the right with estimates for the values of measured Is/FeO minus 14 (unexposed old light mantle) and measured Is/FeO minus 48 (unexposed young light mantle) in zones M-P.
Fig. 13.39 is an enlargement of the Morris et al. (2022a, b) graphical data for upper core 73002 (Fig. 13.38↑) that includes two added columns of estimates for the values of (1) measured Is/FeO minus 14 (unexposed old light mantle) and (2) measured Is/FeO minus 48 (unexposed young light mantle from trench sample 73141). With consideration of the surface exposure constraint, the values in the columns suggest that the old light mantle maximum ∆Is/FeO after burial might lie between about 21 and 31, meeting the surface exposure constraint of being <<40. These values place the exposure age of the old light mantle between about 10 and 15 Myr (21 and 31 / 2.11).
[This calculated 10-15 Myr pre-burial exposure age of the old light mantle can be tested against an expected comparable value of the post-old light mantle slope ∆Is/FeO = 48, the value of buried sample 73141. In order for the pre-burial old light mantle exposure age range and the post-old light mantle slope exposure age range to match, a 57-35% contamination of 72141 regolith by older slope material is required. Note that Fig. 13.32a↑, Fig. 13.32b↑ in §17.2 suggests that such slope contamination is occurring today.]
In summary, the above considerations related to reflectance differences indicate that the Station 3 compacted upper core 72002 below 10 cm depth sampled old light mantle that is much less mature than the darker surface of the young light mantle and which has the Is/FeO values inherited from its parent slope regolith (i.e., never exposed after deposition). There is an indication in the rising Is/FeO value between 10 and 8.5 cm that it reflects the lowest gardened portion of old light mantle. This portion is now overlain by 4.25 cm (zones M-O) of mixed young and old light mantle as well as previously exposed and gardened old light mantle. In turn, the mixed zones were covered by ~7 cm of young light mantle of limited maturation, about half of which was lost from the upper portion of the core during handling of the sample prior to being compacted and capped on the Moon.
The reflectance and Is/FeO data indicate that, before burial, the old light mantle was exposed and gardened at the surface for significantly less time (apparently <27-32 Myr as concluded in the indented, bracketed text in §17.4) than the covering young light mantle, resulting in a lesser degree of darkening and maturation due to space weathering and impact gardening. As indicated above, an estimate of the value of the old light mantle’s ∆Is/FeO gives a pre-burial exposure age of 10-15 Myr.
With an estimate of 10-15 Myr for the pre-burial exposure age of the old light mantle, the added exposure age of the young light mantle of 27-32 Myr gives an exposure age for the continuously exposed portions of the old light mantle of 37-47 Myr. The reasonableness of this possible total exposure can be tested against LRV-2 sample 72141 (Is/FeO = 81), a skim sample taken from a finger-like deposit of diluted old light mantle, still clearly distinguishable from the young light mantle and surrounding dark mantle regolith.
Relative to the young light mantle exposure age of 27-32 Myr and an estimate of ~10-15 Myr for the old light mantle pre-burial exposure age, 37-47 Myr would have added 78-99 Is/FeO points (37 and 47 Myr × 2.11 Is/FeO / Myr). The depositional Is/FeO of the old light mantle portion of 72141 would have been an additional ~14 points of combined solar proton and alpha-only maturation while still in place on the slope of the South Massif. These calculations indicate that the current Is/FeO of 72141 would be 92-113, significantly greater than the Is/FeO = 81 reported by Morris. On the other hand, dilution by ilmenite basalt regolith (dark mantle similar to 72131 with Is/FeO = 60) occurred which suggests that dilution of 72141 by ilmenite basalt regolith has been 34-60% in 37-47 Myr.
17.8 Age of the Ancient Light Mantle Avalanche
With available Is/FeO data, an estimate can be made of the age of the ancient light mantle avalanche that cleared regolith from the slope of the South Massif prior to its re-accumulation before the old light mantle avalanche. The pre-ancient light mantle avalanche Is/FeO on the slope cannot be known, based on available samples. Just before the avalanche that deposited the old light mantle, however, the slope Is/FeO would be ~14 (zones P-W in Fig. 13.39↑). This final slope Is/FeO consisted of combined solar proton and alpha+beta particle induced maturation.
As given above in §17.7 related to the deposition age of the old light mantle, the following relationships describe what is known relative to the ancient light mantle:
- ∆Is/FeO developed prior to the old light mantle avalanche and after the ancient light mantle avalanche equals ~14.
- ∆Is/FeO / Myr after the ancient light mantle avalanche equals 2.11 (0.58 × 45 ppm + 0.11) prior to 0.096 Ga (§6.0).
- Time after the ancient light mantle avalanche before being buried by the old light mantle equals 6.6 Myr (14 / 2.11).
Intuitively, ~6.6 Myr would seem to be a geologically short interval for the development of slope regolith that could feed the old light mantle avalanche off the South Massif, even given a steep slope angle of ~26 or 27 degrees. A particularly strong quake along the nearby Lee-Lincoln thrust fault, however, may have been sufficient to trigger such an event. As discussed in §5.0, there is compositional modeling evidence in the deep drill core’s regolith ejecta from both Hess Crater (~0.394 Myr) and Mackin Crater (~0.821 Myr) (see Table 13.15↑) of at least one avalanche off the South Massif that was an event older than the ancient light mantle avalanche.
Thermal contraction of the Moon (see Nahm et al., 2023), leading to crustal thrust faults, likely began after the majority of mare basalts were erupted between 3.9 and 3.2 Ga (Wilhelms, 1987) when most heat-producing elements moved from the upper mantle into and onto the lunar crust. If one or more very ancient avalanches indicated by the composition of regolith ejecta from Hess and Mackin Craters were triggered by early movement along the Lee-Lincoln fault, it likely would have occurred sometime after the end of major mare eruptions in the lunar mantle volumes below Taurus-Littrow at ~3.82 Ga and recorded as before the Mackin Crater (zone Y+Y*) impact at 0.821 Ga (Table 13.15↑). The sequence of at least 5 additional mass wasting events from the South Massif since that possible first event appears to document continued contraction of the lunar crust and repeated thrust movement along the Lee-Lincoln fault. So far, a total of ~500 m of lateral movement has resulted from that faulting (Schmitt et al., 2017).
The ~6.6 Myr pre-avalanche slope exposure for the ancient light mantle added to the combined 37-47 Myr exposure ages for the young and old light mantles assumes that the slope of the South Massif above the old light mantle was largely cleared of regolith ~6.6 Myr before the old light mantle avalanche occurred. No definitive means of dating the ancient light mantle’s post-avalanche, pre-burial exposure age has been discovered; however, at 49 cm (start of zone X) in core 73001 (Fig. 13.38↑), there is an anomalous jump in Is/FeO from 13 to 22, followed by a gradual decline over 2 cm back to 14, the apparent initial Is/FeO of the old light mantle. It may be that this jump indicates the top of a mixing zone, similar to that shown in core 73002 at 3.5 cm (Fig. 13.39↑, start of zone L), but in this earlier case, a mixing zone between the ancient light mantle and the flowing old light mantle.
-
-
If the jump from Is/FeO = 13 to 22 at 49 cm in core 73001 indicates mixing of old light mantle with ancient light mantle regolith, there may be a minimum exposure age for the ancient light mantle reflected in the change of 9 Is/FeO points (4.3 Myr). Otherwise, a nine-point jump in Is/FeO, after holding to 14 ± 5 downward for 29 cm, is difficult to explain, as it would be unlikely that much change in regolith developed on the South Massif slope would survive mixing in the ancient light mantle avalanche.
17.9 Summary of the Detailed Is/FeO Log of Double Drive Tube Core 73001/2
Employing the logging technique used on the deep drill core (§4.1 and Table 13.5↑), Table 13.29↓ summarizes the data on impact-related Is/FeO resets and ∆Is/FeO represented by the variations in Is/FeO in Fig. 13.38↑. The figures in Column 6 of Table 13.29 give the number of impact resets of Is/FeO per centimeter; however, the full number of resets during the 10-15 Myr of exposure of the old light mantle is not known due to the disruption of pre-burial, exposed old light mantle in zones M-O. As discussed above, the 2 cm of zone P may be the base of the impact gardened portion of the old light mantle and, although the existence of other resets is unknown, that zone’s 2 resets divided into 10-15 Myr would be consistent with the indication of average of 5.7 Myr between resets, calculated for the deep drill core in §9.1. This allows for one or two resets to have been lost in zones M-O to remain consistent with the deep drill core data.
Also, in Column 7, ∆Is/FeO per centimeter, is consistent with calculations for the deep drill core except for the numbers for the M-O mixed zones, as would be expected. This supports the hypothesis that the mixed zone records a very dynamic, real-time interaction between the young and old light mantle avalanches. The obvious evidence of mixing at the flow interface between avalanches contrasts sharply with the absence of more than a half centimeter of mixing between all but two of the deep drill zones of regolith ejecta. The explanation probably lies in the difference between the near horizontal flow of avalanches and the high angle of impact (~45°) of regolith ejecta. The one example of mixing in the deep drill core is that between zones S and T+T*; however, the regolith ejecta from MOCR Crater (1451 m diameter and 6 km distant) that formed zone S arrived at a significantly higher velocity than that of other zones having been ejected from a more distant and more energetic impact than other smaller source craters (400-800 m diameter and <1 to 4 km distant).
17.10 Regolith Accumulation on the South Massif Slope
Regolith accumulation on the lower portions of a steep massif slope can be expected to be more rapid than on the valley floor due to the contribution of down-slope migration of more elevated regolith in addition to newly created regolith particles. In that context, the regolith currently present on the South Massif has developed over about 21-32 Myr since the young light mantle avalanche more or less cleared the slope of regolith. Table 13.30 compares that current slope regolith data with data related to slope regolith that existed prior to the light mantle avalanches.
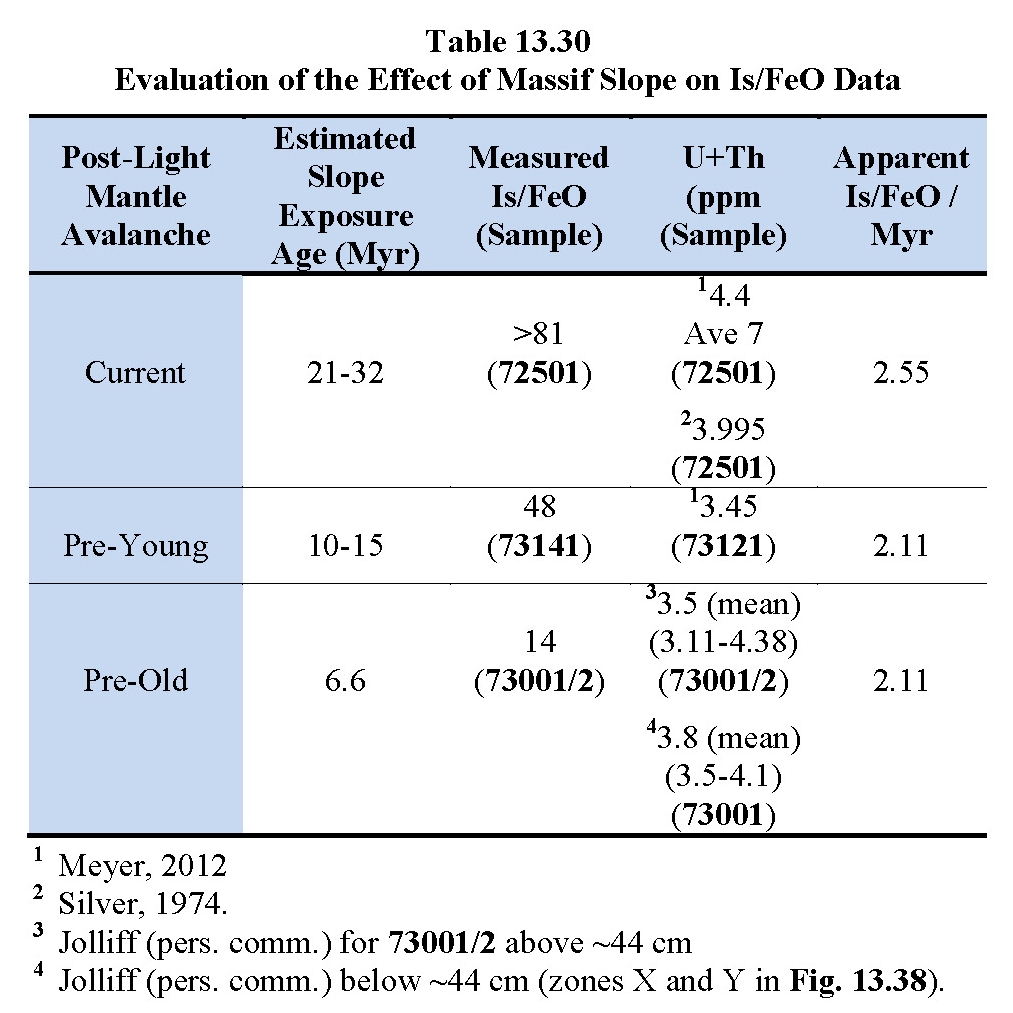
Links for Meyer (2012), Silver (1974) and Fig. 13.38↑.With respect to the current slope regolith, the Is/FeO = 81 for rake sample 72501 would indicate that the combined proton and alpha+beta particle maturation rate Is/FeO / Myr = 3.86 to 2.53 for 21-32 Myr (81 / 21 and 32). The facts that (1) this range of rates is greater than the Is/FeO / Myr = 2.11 for 74141 and (2) U+Th in the current slope regolith 72501 is about 0.4 to 0.9 ppm (Meyer, 2012) higher than in the young light mantle samples 73121, 73141 and 73221 indicates that some of the “new” regolith particles in 72501 are significantly richer in uranium and thorium than particles that comprised the slope regolith after the old light mantle avalanche (3.45 ppm), that is, prior to the young light mantle deposition. This indicates that regolith sources of enhanced U+Th content exist on the slopes of the South Massif and that those sources began to feed regolith into that sampled on the Station 2 slope after the young light mantle avalanche occurred. Boulder 1 at Station 2 also might be from such a source. Boulder 1 (Fig. 13.45↓), an extremely heterogeneous, impact generated agglomeration of breccias, has U+Th values that range from ~5 to ~9 ppm (Meyer, 2012).
The apparent new particles in 72501 as well as Boulder 1 might be from the triangular area of hummocky appearance (Fig. 13.40↓, Fig. 13.41a↓, Fig. 13.41b↓) that may constitute a generally coherent source of regolith that overlaps the top, northeast-facing rim and upper slope of the South Massif (Robinson and Jolliff, 2022).
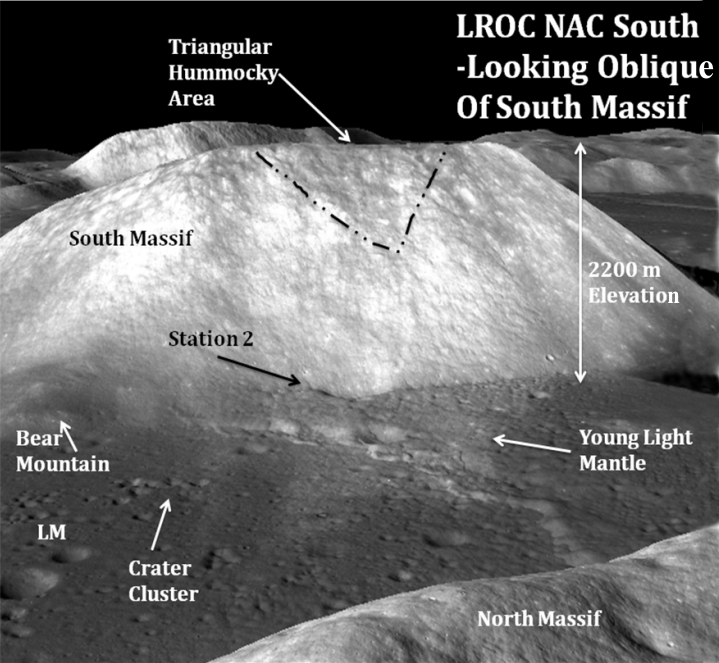 Fig. 13.40. LROC oblique view of the northeast-facing slope of the Sourth Massif (courtesy of N. Petro).
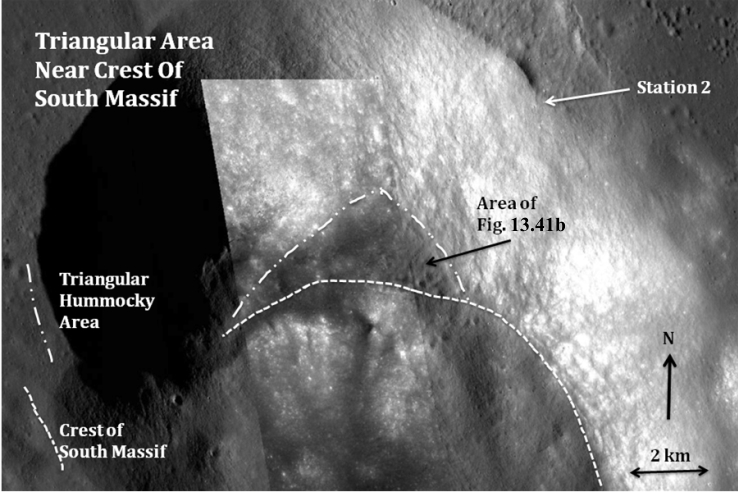 Fig. 13.41a. Lunar QuickMap overhead image of South Massif.
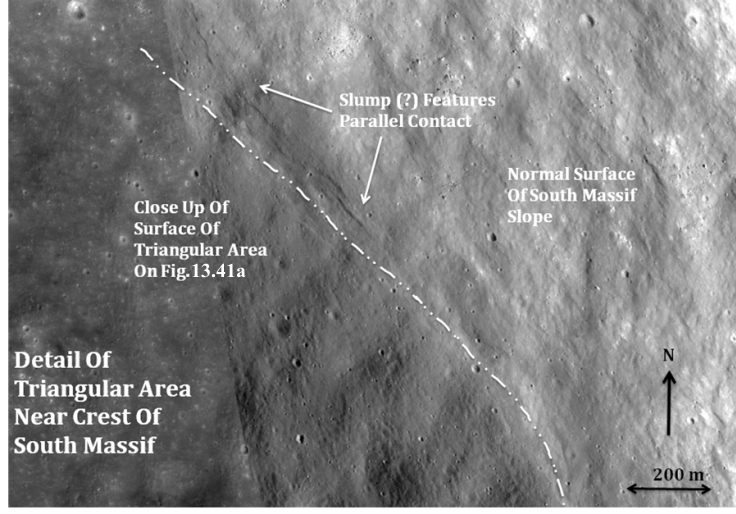 Fig. 13.41b. Lunar QuickMap closeup image of northeast contact of hummocky area on northeast facing slope of South Massif.
 Fig. 13.42. Kaguya FeO map of northeast-facing slope of South Massif (courtesy of N. Petro).
 Fig. 13.43. Kaguya olivine map of northeast-facing slope of South Massif (courtesy of N. Petro).
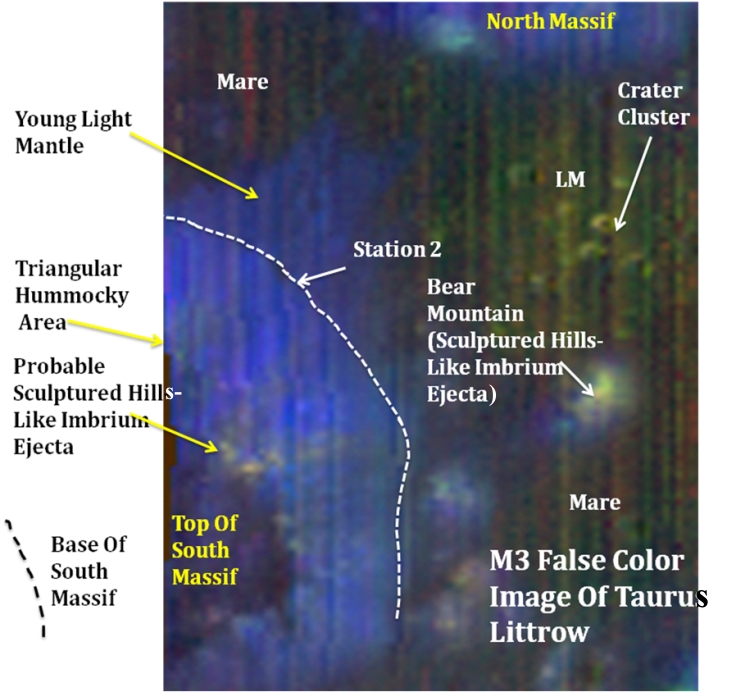 Fig. 13.44. M3 overhead image of South Massif and Taurus-Littrow (courtesy of N. Petro).
Data from LROC NAC images, M3 and Kaguya FeO and olivine analyses (Figs. 13.42↑, 13.43, 13.44; N. Petro, personal comm.) indicate the following, relative to the nature of this apparent unit:
- The Kaguya FeO image’s light green-blue triangular area on the upper third of the slope above the light mantle (Fig. 13.42↑) coincides with the triangular hummocky area apparent in Fig. 13.40↑ and Fig. 13.41a↑, Fig. 13.41b↑.
- The Kaguya olivine image (Fig. 13.43↑) shows bright green spots in the same triangular area noted in item (1).
- The Kaguya FeO image’s light green-blue triangular area in Fig. 13.42↑ also appears to be shedding fainter green-blue regolith downward toward Station 2 that may have enhanced U+Th in rake sample 72501 over light mantle sample 73121.
- M3’s false color image (Fig. 13.44↑) shows a faint signal of mafic material for the triangular area in Fig. 13.42↑ and Fig. 13.43↑ that may reflect the mafic content of Boulder 1.
- Boulder 1, Station 2 (Fig. 13.45↓, Table 13.31), has high U+Th and may be a sample of the triangular hummocky area.
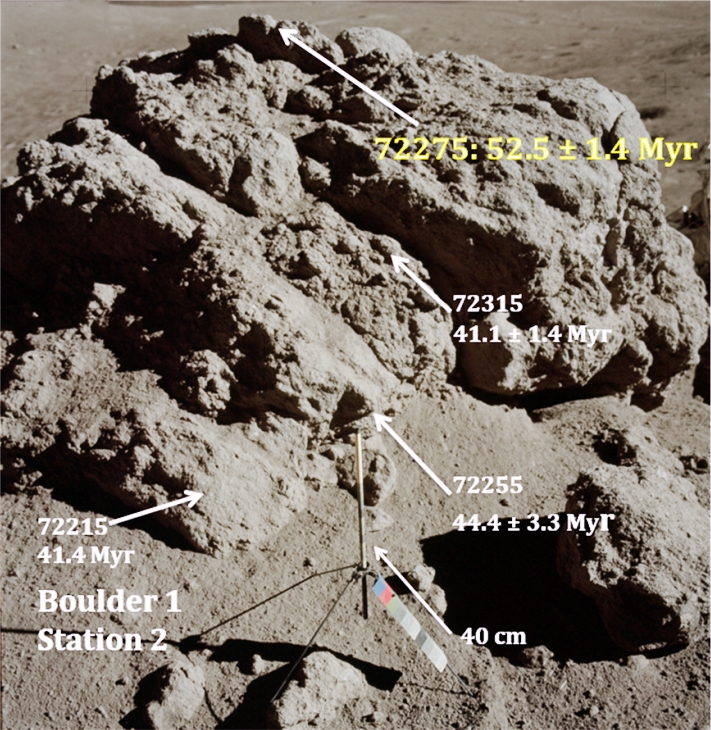 Fig. 13.45. Boulder 1 at Station 2. (NASA Photo AS17-137-20900).

Links for Meyer (2012), Stoeser et al. (1974) and Heiken (1974).The foregoing discussion leads to the following hypothesis:
The material that makes up the triangular hummocky area consists of iron- and olivine-rich material with high (4-8 ppm) U+Th, material from which Boulder 1 at Station 2 also was derived, with shredded regolith from the area adding 0.5-0.9 ppm U+Th to slope rake sample 72501 vs. the 3.45 ppm of young light mantle sample 73121.
If this correlation of new, U+Th enriched regolith particles with higher, hummocky area is correct, it would imply that the 10-15 Myr of slow mass wasting after the old light mantle avalanche and prior to the young light mantle avalanche was not long enough for that regolith to reach the base of the slope. The closest point of the hummocky area on the ~28o slope is about ~1400 m in elevation (Lunar QuickMap) above Station 2. If 21-32 Myr were enough time for the U+Th enriched regolith to reach the Station 2 area, after the slope was cleared by the young light mantle avalanche, that would indicate that the vertical rate of slow mass wasting on that slope is 67-44 vertical meters per Myr (1400 / 21 and 32).
An alternative explanation to the relationships given in Table 13.30↑ is that the slope regoliths that existed prior to each avalanche were derived, in part, from distinctly different bedrock lithologies in the South Massif, unrelated to the hummocky area discussed above. As indicated in the low sun angle LRO image in Fig. 13.33b↑, however, the young and old avalanches appear to have consisted of material from about the same portions of the massif slope, having similar run-out directions and distances.
Another complication is uncertainty in the origin of the Is/FeO = 81 for rake sample 72501. That sample may be a mix of young and old slope regolith as suggested by high-sun images (Fig. 13.33a↑, Fig. 13.33b↑, §17.2) that show areas of relatively low albedo regolith on either side of high albedo, post-young avalanche regolith. Indeed, Station 2 and rake sample 72501 appear to be at and from a part of the slope in which young and old, post-avalanche regolith might be mixed.
On the other hand, prior to the young light mantle avalanche, the pre-young light mantle slope regolith developed over ~10-15 Myr, that is, over the initial exposure age of the old light mantle before it was covered by the young light mantle. A general test of the slope-clearing hypothesis implied here lies in calculating the duration of regolith maturation on the slope of the South Massif prior to the young light mantle avalanche. That slope maturation time roughly should agree with the ~10-15 Myr exposure age of the old light mantle that likely cleaned the slope of most regolith.
The current Is/FeO of buried trench sample 73141 = 48 would be very close to the deposition value, as burial has protected the sample from both solar protons and impact gardening, the latter necessary to prolong alpha+beta maturation. As the post-old light mantle South Massif slope would have been largely devoid of regolith, the pre-young light mantle avalanche value of Is/FeO = ~48 would be equivalent to the slope’s ∆Is/FeO prior to that avalanche. ∆Is/FeO = ~48 is equivalent to 23 Myr (Is/FeO = 48 / 2.11 ∆Is/FeO / Myr). A 23 Myr initial exposure age for the old light mantle obviously does not meet the “surface exposure constraint” for the old light mantle (§17.7), that is, the old light mantle’s higher reflectance indicates that its initial pre-burial exposure age must be significantly less than the exposure age of the young light mantle (21-32 Myr; §17.4).
The reason for this 13-8 Myr (23 Myr minus 10-15 Myr) inconsistency may be contamination of 73141 by older slope material that had not been removed by the old light mantle avalanche. For the ∆Is/FeO of the slope’s post-old light mantle to match the initial exposure age range of 10-15, it would need to be 21-32 points (10-15 Myr × 2.11 ∆Is/FeO / Myr). This suggests that buried 73141’s ∆Is/FeO = 48 was contaminated by 56-33% of older slope material. Fig. 13.32b↑ in §17.2 further suggests that such slope contamination is occurring today. (The effect of this possibility of pre-avalanche contamination of 73141 on estimating the exposure age of the young light mantle is presented in indented, bracketed text in §17.4.).
As will be discussed separately below relative to the North Massif core 76001, only one potential mass wasting event of slope regolith has been postulated here for the North Massif (§5.0, deep drill core zone W*); whereas, at least 7 such events have been identified directly or indirectly as coming from the slopes of the South Massif and include evidence from deep drill core zones W and Y+Y* (§5.0). This contrast is probably the result of a degree or so higher average slope for the South Massif than for the North Massif. Regolith movement and maturation on the North Massif reaches a steady state with total Is/FeO stabilizing at ~66 near Station 6 but with a significantly lower U+Th content and alpha+beta ∆Is/FeO / Myr (1.83 vs. 4.4 ppm and 1.06 vs. 2.55, respectively). If other parameters were equal, and they are not, of course, for hypothetically similar exposure ages of 20 Myr, the more U+Th-rich South Massif slope’s Is/FeO would be ~30 points higher than that for the North Massif. The steeper slope on the South Massif also would be more susceptible to instability when physically disturbed.
Clearly, steep South Massif slopes have been subject to impact and moonquake-driven regolith removable by episodic as well as continuous small impact-driven mass wasting and creep. Pre-mare basalt evidence of such mass wasting (by avalanche, debris flow, or down slope creep) would have been buried or possibly activated by (1) the impact of Imbrium ejecta soon after 3.83 Ga (Schmitt et al., 2017); (2) lithostatic, pre-mare eruptions before 3.82 Ga (Schmitt, 2016a); (3) mare basalt eruptions around 3.82 Ga, and (4) pyroclastic ash eruptions before ~3.60 Ga. Since the Serenitatis basin-forming impact(s) and the formation of the Taurus-Littrow grabben, landslides, avalanches and debris flows have constituted the large mass wasting events (Fig. 13.33c↑).
Granular debris flows from a steep peak in the southern Sculptured Hills also have been identified (Schmitt et al., 2017). The net result of these processes is that steep massif slope regolith remains relatively more immature than a comparable level area would. Valley floors also remain relative immature due to impact mixing of relatively old and relatively young regolith and pyroclastic ash, as well as the effect of macro- and micro-meteor impact resetting of near-impact Is/FeO values.
17.11 Basaltic Regolith and Pyroclastic Ash Ejecta Deposition on the South Massif Slope
Drive tube core 73001/2 (Neuman et al., 2022) provides specific indications of basaltic and pyroclastic ash related ejecta impacting the slope of the South Massif (Fig. 13.46↓). The three prominent and correlated spikes in FeO, TiO2 and basalt fragments recorded in Fig. 13.46 at 1, 8.5 and 13 cm probably represent the deposition on the South Massif slope of relatively large amounts of regolith ejecta from impacts into ilmenite basalt regolith on the valley floor. On the other hand, only the lowest of these correlated spikes at 13 cm, in turn, correlates with a spike in orange ash. (A weak such correlation exists at 16 cm, as well).
 Fig. 13.46. Comparison of FeO and TiO2 (wt%) and mixing calculations for basalt and orange ash (wt%) as function of depth in core 73002 (FeO and TiO2 after Neuman et al., 2022).
The 3-4 other, non-correlated orange ash spikes indicate impacts that did not penetrate into basalt regolith in areas of high orange+black ash concentration. These ash ejecta spikes might be from impacts that penetrated slope regolith into mass wasted ash concentrations now buried beneath slope regolith accumulations at the base of the massif.
A line of about six overlapping, 100-200 m diameter, relatively young impact craters ~2 km northeast of the base of the South Massif might have been a source of basaltic regolith ejecta. If this hypothesis were correct, the impact(s) would have occurred during the accumulation of slope regolith prior to the old light mantle avalanche. The quantity of ejecta apparently was too great to be completely integrated into the slope regolith before the old light mantle avalanche or to be fully mixed during that avalanche.
17.12 Relationships of Station 3 Trench Samples to Core 73001/2
Some additional insights into both the young and old light mantles are provided by samples from a half-trench dug and sampled on the southeast rim of an ~10 m diameter crater (Fig. 13.47↓) about 20 m from the location of the double drive tube core 73001/2. It is probable that the rim ejecta of this crater is light mantle material from about 2 m depth and residual units in that material are over-turned relative to their pre-impact stratigraphic positions. It is also likely that nearby, post-impact cratering has deposited thin layers of secondary, young light mantle regolith ejecta on the larger crater. These surface deposits, as well as all the samples from the trench, may have had some impact resets of their Is/FeO values (§4.2).
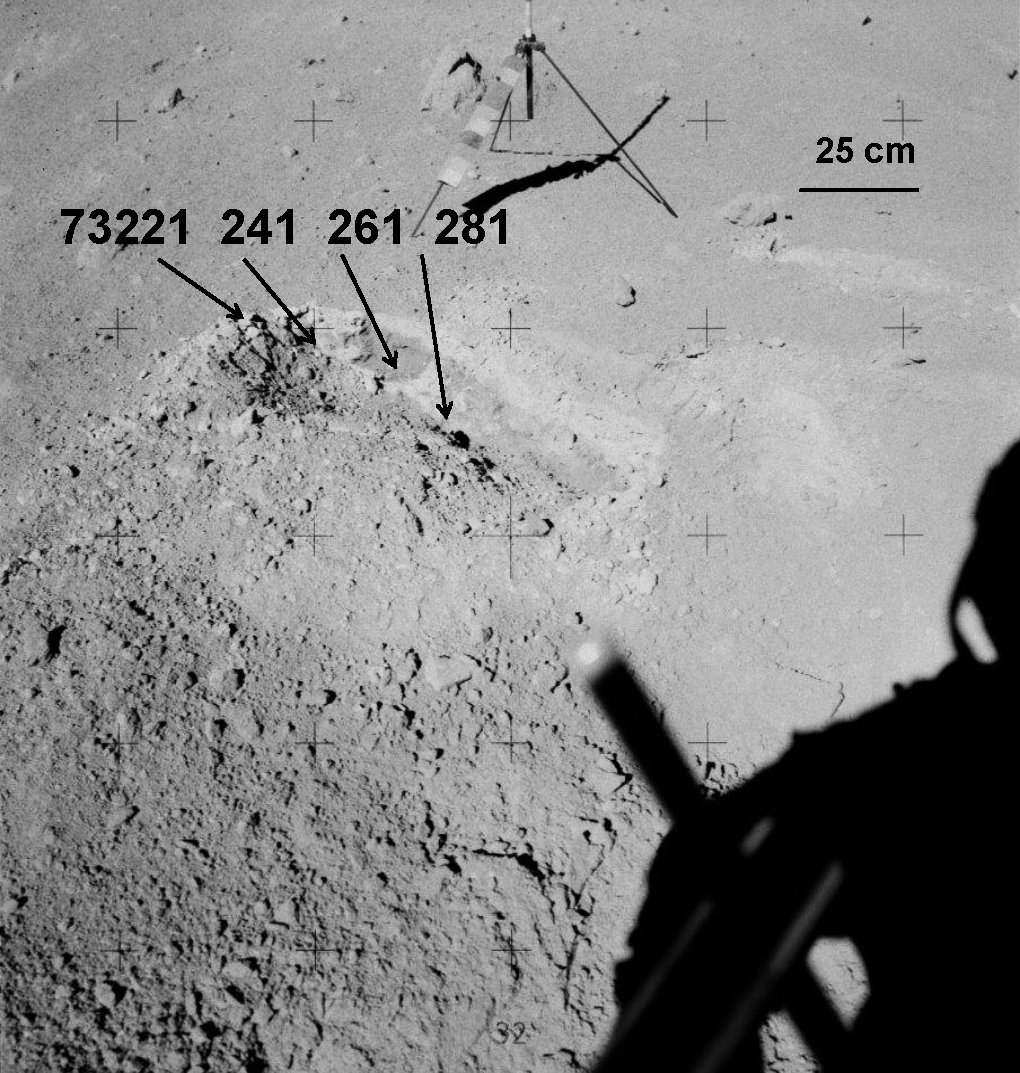 Fig. 13.47. Location of samples taken from half-trench dug in rim of an ~ 10 m diameter impact crater about 20 m from the location of double drive tube core 73001/2. (NASA base photo AS17-138-21149)
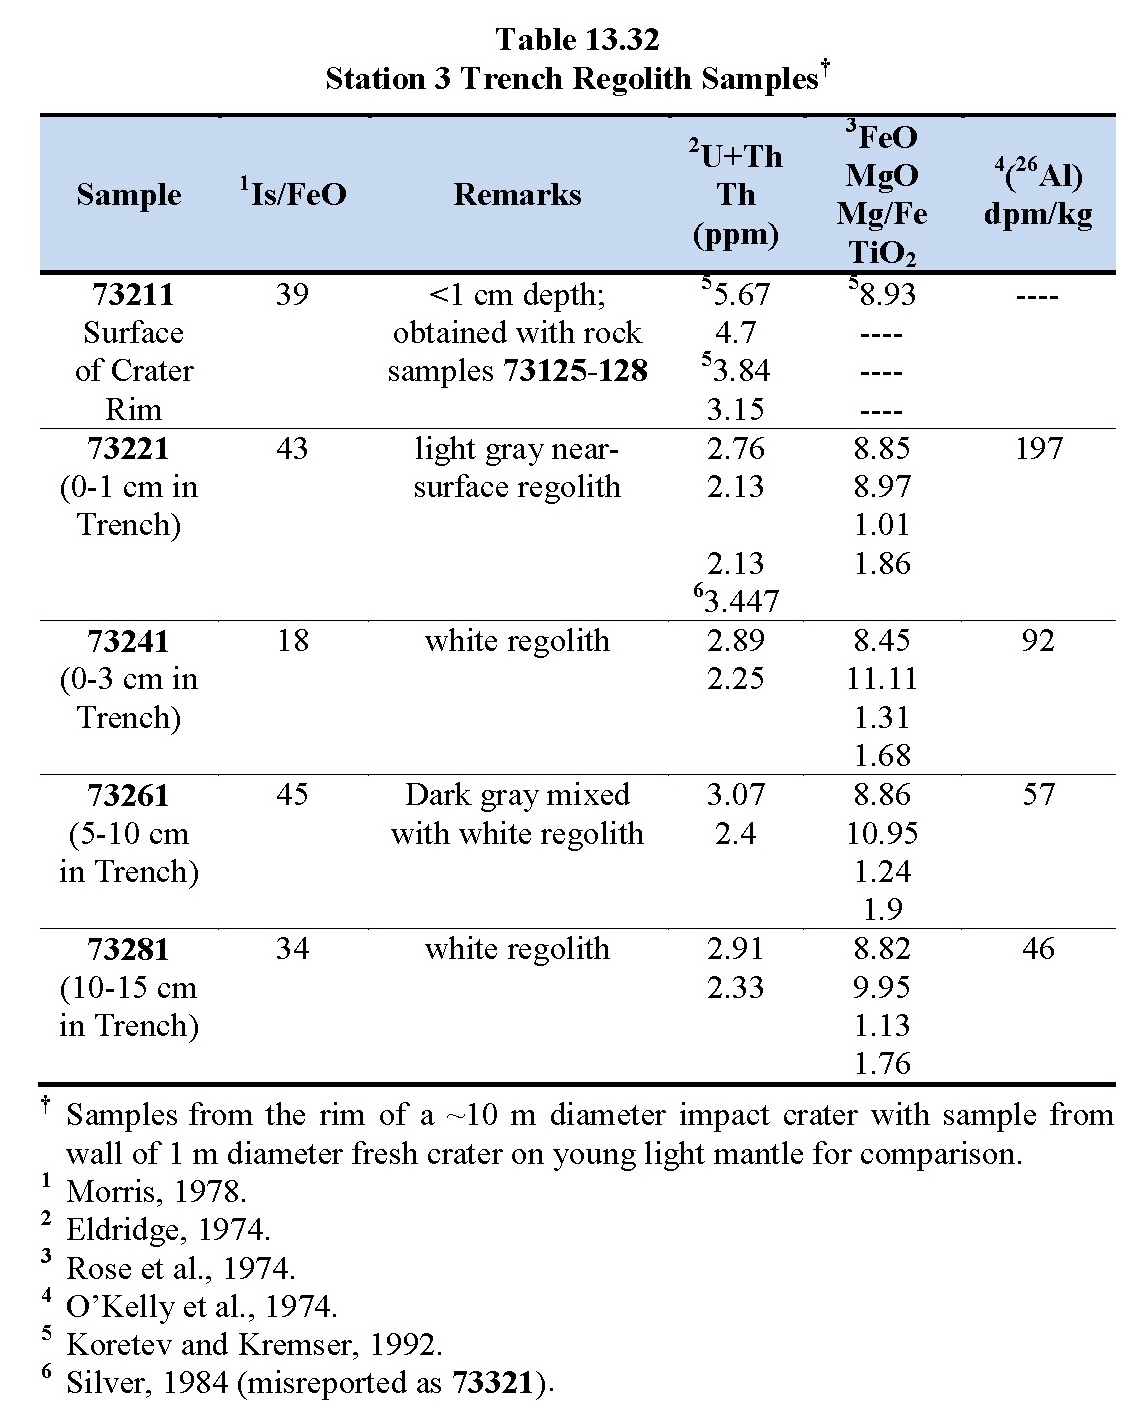
Links for Morris (1978), Eldridge et al. (1974), Rose at al. (1974), O’Kelley et al. (1974), Korotev and Kremser (1992), and Silver (1974).Table 13.32 provides information on the four samples obtained from various depths in the trench based on observations, documentation images, and post-mission analyses. Some of the indications of the relationship between the four trench samples and core 73001/2 are as follows:
- The FeO and TiO2 contents (Rose et al., 1974), as compared with the increasing trends in Fig. 13.46↑ (Neuman et al., 2022) indicate that all the trench samples are equivalent to the material in the upper core 73002.
- Is/FeO values (Morris, 1978) for all samples suggest they were possibly exposed to impact reset, however, they are generally consistent with values in zones M-O the core 73002 (Morris et al., 2022a).
- 73221 consists of gardening redistributed young light mantle regolith with recent exposure as indicated by significantly higher 26Al values (half-life 717,000 years) than samples lower in the trench. The reported 26Al value probably was enhanced by the intense solar flare in August 1972.
- 73241 is largely overturned old light mantle as indicated by Is/FeO = 18 that approaches the Is/FeOm = 14 of the old light mantle, as well as by its higher reflectance than 73261.
- 73261 darker gray regolith in the marbled zone is related to young light mantle as indicated by low reflectance and Is/FeO = 45 being > 36, the mean Is/FeO of the mixed zone of core 73002.
- 73281 with high reflectance and Is/FeO = 36 is relatively mature old light mantle, probably overturned.
- 73211’s high uranium and thorium values suggest that it was contaminated by the rock samples (73215-18) contained in the same bag. 73215, for example, has Th = 4-7.4 (Meyer, 2012), although the other rock samples have less.
17.13 Lee-Lincoln Thrust Fault Activity Triggers for Light Mantle Avalanches
It has been proposed by (Arvidson et al., 1976; Lucchitta, 1977: Drozd et al., 1977) that the young light mantle deposit was the result of the impact of ejecta from Tycho Crater some ~2350 km (Lunar QuickMap) to the southwest. This correlation is based on the interpretation of a possible ejecta ray from the crater Tycho that appears to cross the valley of Taurus-Littrow, as well as on estimates of the age of the Crater Cluster several kilometers east of the old and young light mantles. A cluster of craters on the top of the South Massif also has been proposed as Tycho secondaries (Robinson and Jolliff, 2022). These suggestions and conclusions predated the identification of many other mass wasting events of different relative ages from the slopes of the South Massif and thus would make a Tycho origin for the young light mantle avalanche unlikely, but not impossible.
Movement along the Lee-Lincoln thrust fault in the same part of the valley as the light mantles provides a more likely alternative for triggering repeated large mass wasting events. Further, this recent work on the relative and absolute ages of 400-800 m diameter craters that make up the Crater Cluster and their regolith ejecta sampled by the deep drill core, indicate that the Cluster is comprised of at least five different impact events, including four elliptical, apparently simultaneous impacts that may be from a disaggregated comet (§5.0).
The record in double drive tube core 73001/2 that includes evidence of three separate avalanches during the last ~100 Myr or less is suggestive that at least three Moon-quakes occurred along the Lee-Lincoln thrust fault, that is, one more than the two suggested by Schmitt et al. (2017). Further, there is compositional evidence of at least one more even older light mantle avalanche in deep drill core regolith ejecta from craters in the Crater Cluster (§5.0). Schmitt et al. (2017) proposed that thrust faulting along the Lee-Lincoln thrust fault has created the ~500 m wide Nansen moat, as well as producing an estimated total hanging wall throw of about the same 500 m. With each trusting episode, support also would be removed from the regolith at the base of South Massif slope, triggering the light mantle avalanches. At least two generations of granular debris flows from the Sculptured Hill’s “paint splatter” peak (Lunar Quickmap) also may well have resulted from such seismic activity.
18.0 Thermoluminescence of Taurus-Littrow Regolith
18.1 Introduction
Thermoluminescence of lunar regolith results from thermal release of trapped electrons activated in minerals by alpha, beta, gamma and cosmic radiation (Sears et al., 2024). These radiation sources create electron traps in the crystalline minerals and glass that comprise the regolith. One of the possible opportunities of Apollo 17 sampling discussed during preparation for Taurus-Littrow exploration included continuously shaded regolith, if any were encountered during our exploration. Samples obtained beneath boulders at Stations 6 as well as those of the deep drill core provide new information on thermoluminescence related to sunlit, shaded and buried regolith.
Apollo 17 samples have been the subject of extensive thermoluminescence study (Durrani et al., 1976, 1977; Sehlke and Sears, 2022 ; Schmitt, 2023b; Sears et al., 2024). Durrani et al.’s original, relative thermoluminescence “glow curve” patterns for samples 76240, 76260 and 72320, obtained in 1974, are copied in Fig. 13.48 and labeled A, B, and C, respectively. Durrani et al.’s glow curve sketches indicated that fully shaded 76240 shows a low temperature) maximum at ~200ºC and a high temperature maximum at ~440ºC. The two distinct maxima in thermoluminescence intensity indicate the existence of at least two groups of electron traps with distinctly different thermal energies being required for their release and resulting luminescence.
Samples 76240 and 72320 (refer to Fig. 13.49a↓, below) were placed at –25ºC (248ºK) at the Lunar Receiving Laboratory in Houston within 4 weeks of their collection on the Moon (a few later warming events may have occurred due to power outages in Houston).
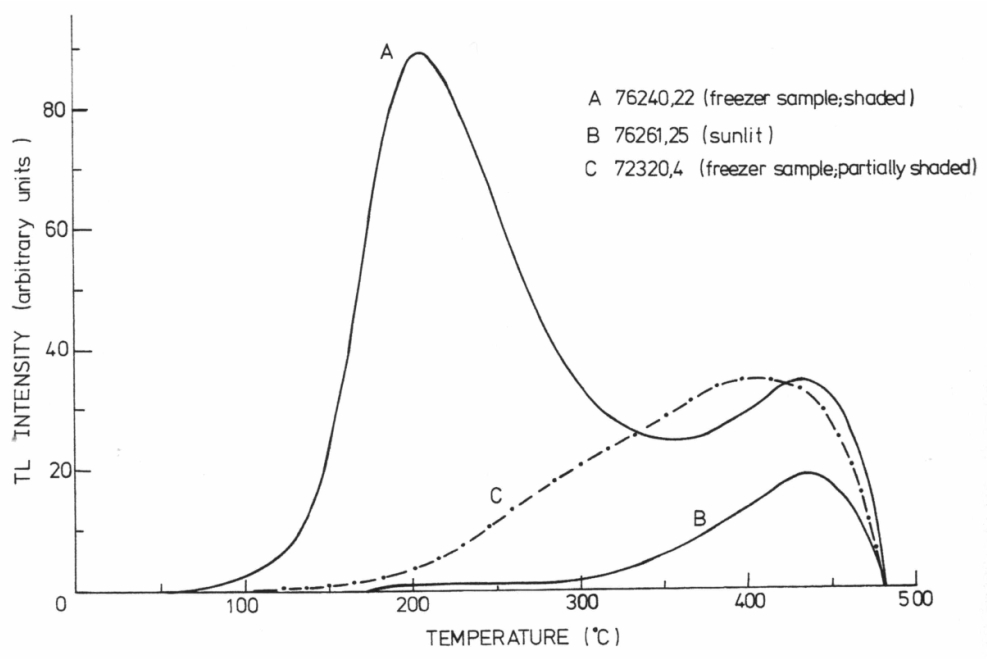 Fig. 13.48. Original sketches of the 1974 thermoluminescence glow curves for completely shaded sample 76240 (A), fully sunlit control sample 76261 (B), and partially shaded sample 72320 (C). Note that relative intensity is given in arbitrary units. (after Durrani et al., 1976).
Portions of the samples distributed for analysis were kept frozen by Durrani et al. with CO2 ice (–78.5ºC, –195.6ºK) and liquid nitrogen (–196ºC, –77.2ºK) temperatures while in interim storage and during the period of analysis. Sample 76261 was kept at room temperature during a ~3-year period before data were collected.
Sears et al. (2024) have undertaken a comprehensive, as well as a theoretical analysis of the Thermoluminescence of these Apollo 17 samples and the interested reader is referred to that work for details. The following discussion sets the geological foundation for the Sears et al. analyses.
18.2 Continuously Shaded Regolith Sample 76240
The geologic context of sample 76240, continuously shaded for ~19.5 Myr (§6.0), is shown in Fig. 13.49a↓–d. The sample was obtained from shadow, about 30 cm in and beneath Fragment 4 of the Boulder at Station 6. Sunlit samples 76220 and 76260 and buried 76280 provide comparison data relative to 76240. The main boulder bounced across and down an ~26° slope, leaving a chain of impact craters about 1.5 km long, until it encountered an ~6° lower break in slope where it stopped. As it bounced, it shed rock debris from its surface material onto nearby regolith, resulting in a significant addition of uranium and thorium to the surfaces of nearby regolith (comparison of high U+Th shadowed 76240, sunlit 76260 and sunlit 78220 with low U+Th buried 76280, down slope sample 76320, and rake sample 76501). In stopping, impact forces broke the main boulder into five large fragments and splashed a few centimeter thick blanket of U+Th-rich regolith around the point of impact (Fig. 13.49a).
Continuously shaded regolith sample 76240 has a very strong thermoluminescence pattern (Fig. 13.50d↓ for the 223ºC maximum. After ~46 years of storage, however, Sehlke and Sears (2022 ) conclude that, in the freezer sample of 76240, the 223ºC maximum has faded by ~43 ± 8% as compared with their estimates based on Durrani et al.’s (1977) sketches. On the other hand, the 440ºC maximum has remained essentially unchanged. The drop in the freezer maximum for 76240 over ~50 years indicates that the in situ temperature of 76240 was significantly lower than the freezer temperature of 248ºK (–25ºC), an issue discussed further below.
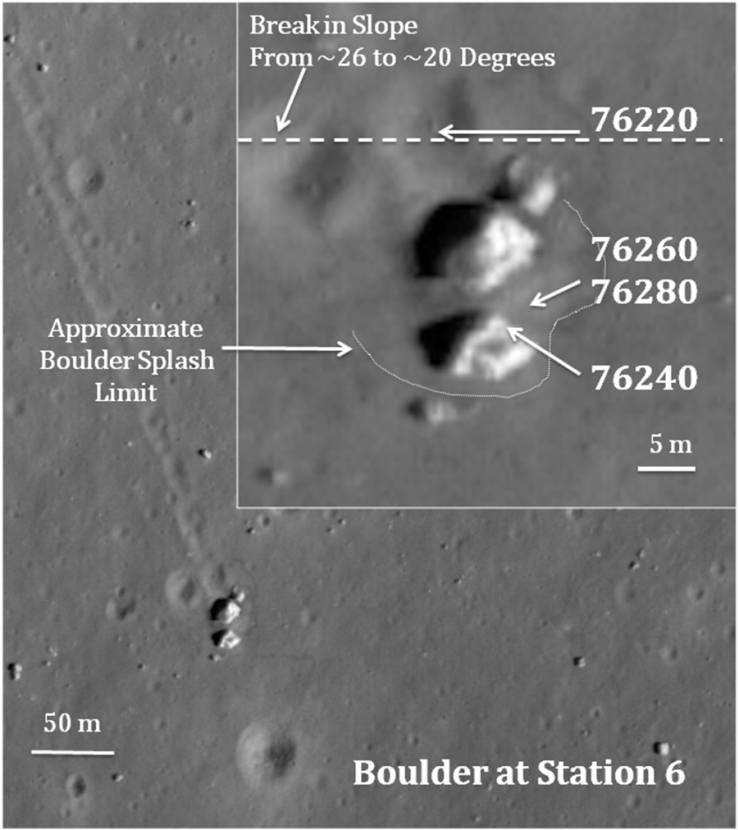 Fig. 13.49a. Area of Station 6 near the base of the North Massif showing location of individual regolith samples in the inset at upper right. (after Le Mouélic et al., 2022, 2024).
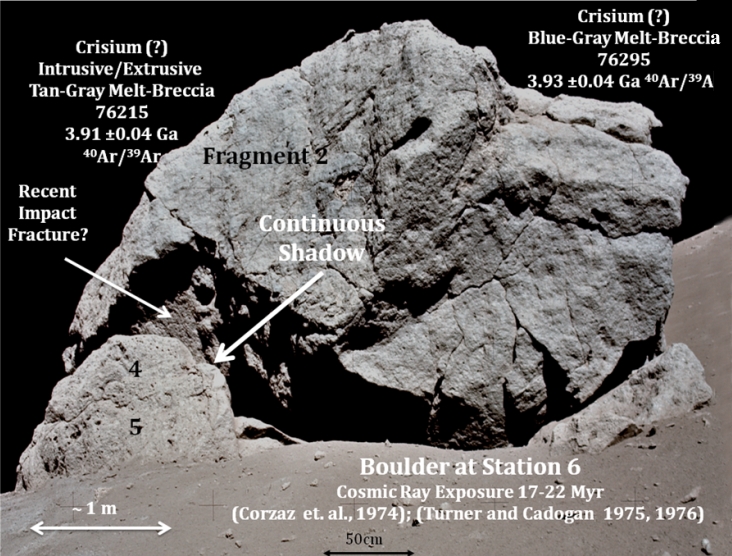 Fig. 13.49b. Geological context of continuously shaded sample 76240 beneath Fragment 4 of the boulder at Station 6. (NASA base Photo AS17-140-21436).
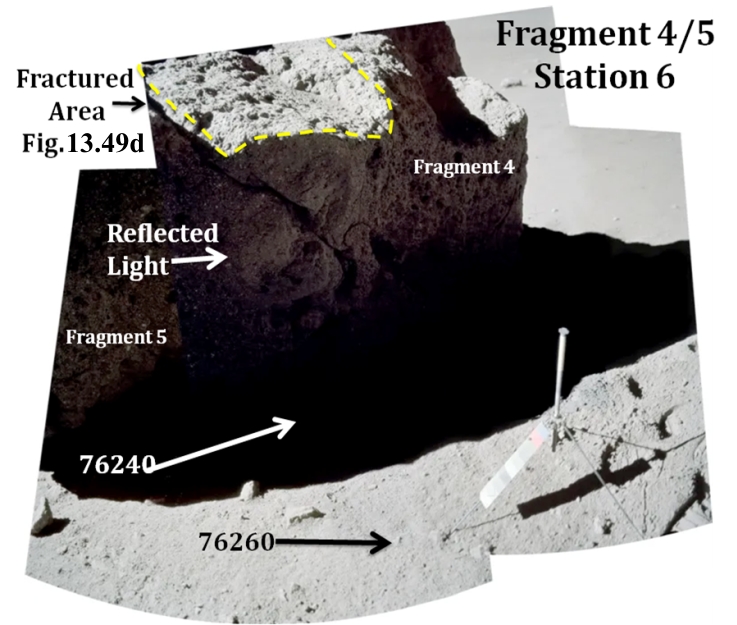 Fig. 13.49c. Location of continuously shaded sample 76240 beneath Fragment 4 of the boulder at Station 6 and of the nearby sunlit control sample 76260. Length of gnomon’s vertical rod is 40 cm. (NASA base photos AS17-140-21401,-02,-03,-04; mosaic by R. A. Wells, ed., in Schmitt, 2024c, Fig. 12.44, p. 56).
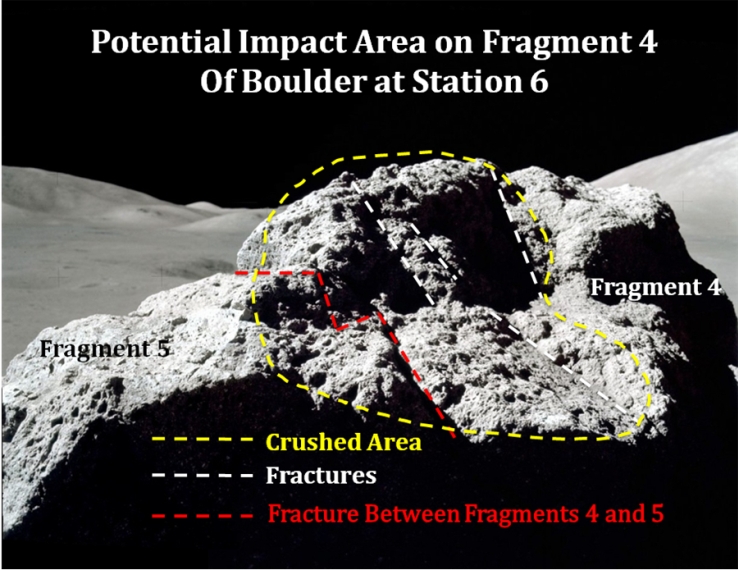 Fig. 13.49d. Disrupted area of fragment 4 that may have been the result of an impact that broke fragment 4 off fragment 2 (located behind the viewer; see Fig. 13.49b↑). (NASA base photos AS17-140-21417,-18; mosaic by R. A. Wells, ed.)
The Durrani et al. (1977) analysis showed that shaded 76240 has two distinct maxima in thermoluminescence intensity indicated at least two electron traps with distinct activation energies, separated by traps with a range of activation energies. This conclusion is supported by the more detailed recent work of Sehlke and Sears (2022 ) and Sears et al. (2024) on the thermoluminescence of shaded and frozen 76240, sunlit 70180, and samples from seven depths in the deep drill core 70001/9. The recent Sears et al. study (Fig. 13.50a-e↓) also has identified five specific natural thermoluminescence maxima or peaks with activation temperatures of 223±15, 270±18, 339±29, 413±14, and 475±9 ºC as well as three lower temperature traps at 108±3, 147±2 and 192±2 ºC identified by induced beta radiation. The two Durrani peaks, confirmed by Sehlke and Sears (2022 ), probably represent the combined effect of the 223ºC and 270ºC and 413ºC and 475ºC peaks of Sears et al. (2024).
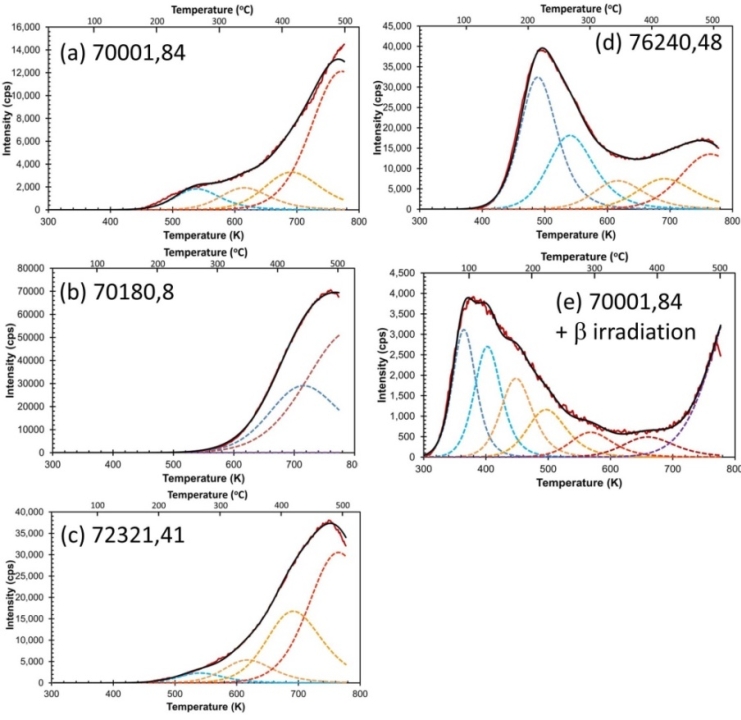 Fig. 13.50a-e. Thermoluminescence glow curves for samples of Taurus-Littrow regolith (Sears et al., 2024).
The 213ºC and 270ºC maxima may be the result of post-boulder shading, exposure to low energy alpha particle (4.2 Mev) and beta radiation from 238U and somewhat higher energy alpha particles and beta radiation from longer half-life 232Th (12 Mev), respectively, both of which exist in 76240 (U+Th = 2.43 ppm) (Silver, 1974). Although there is an assumption that ionizing radiation does not create electron traps (Sehlke, 2025, pers. comm.), gamma rays and their secondaries probably cannot be the sources of these peaks as such radiation would not penetrate the thickness of the overlying rock of Fragment 4. The 413ºC (450 º C) and 475ºC maxima are likely inherited from pre-shading exposure to gamma rays (up to 8 Mev), solar protons (10 Gev from solar flares and mass ejections (CMEs)), and solar and galactic cosmic rays (1 Gev to much higher). There is a plausible, but low probably coincidental alternative that the 213ºC and 270ºC maxima could be inherited cosmic ray effects; however, this would require that the arrival of the boulder and the shading of 76240 regolith took place prior to heating after sunrise so that electron traps formed by cosmic rays during the preceding lunar night would be preserved.
[Durrani et al. (1977) report a calculated age of ~65,000 years for the dynamic shading of 76240, based on techniques used for terrestrial archeological dating. This is in contrast to the exposure ages for the Station 6 boulder of 17-22 Myr (Corzaz et al., 1974; Turner and Cadogan, 1975; Cadogan and Turner, 1976), discussed further in §6.3 of this Chapter. If the Durrani et al., analysis is correct, a shadow age of ~65,000 years would indicate that Boulder 4 was split off from Boulder 2 by a recent impact with the current shadow forming at that time. There is some evidence of such an impact having occurred in the extensive fracturing and disruption in the upper right area of Boulder 4 and 5 (Fig. 13.49d↑).]
[On the other hand, in §6.3, the analysis of the Is/FeO relationships between regolith samples collected at Station 6 indicate that shading of 76240 occurred simultaneously or soon after the boulder at Station 6 rolled into place about 19.5 ± 1.5 Myr ago.]
18.3 Periodically Shaded Regolith Samples 72220 and 72320
Thermoluminescence analyses have not been conducted on periodically shaded sample 72220 from about 70 cm inward and underneath Boulder 1 at Station 2. Additional constraints on lunar Thermoluminescence history might be realized from study of this sample.
 Fig. 13.51a. Context of periodically shaded regolith sample 72220 under Boulder 1 at Station 2 on the slope of the South Massif as viewed looking northwest. (NASA base photos AS17-138-21030,-31; mosaic by R. A. Wells, ed.).
 Fig, 13.51b. Context of periodically shaded regolith sample 72220 under Boulder 1 at Station 2 on the slope of the South Massif as viewed looking northwest from the northeastern corner of the boulder (also see Fig. 13.51a). (Enlarged portion of NASA photo AS17-137-20902).
Another periodically shaded regolith sample, 72320, was collected at Station 2 from about 20 cm underneath Boulder 2 on the slope of the South Massif. The glow curve pattern of 72320 (Fig. 13.50c↑) is the same as other sunlit samples.
18.4 Buried Zones in the Deep Drill Core
Thermoluminescence related to the deep drill core (70001/2), as a function of depth, have been studied in great detail by Sehlke et al. (2026), and the reader is referred to that paper for their additions to this synthesis. All samples from the deep drill core 70001/2 were stored since late December 1972 at room temperature. In contrast to shaded sample 76240, Sehlke and Sears (2022) report that the deep drill core control regolith sample 70180 has only a single, strong 413º C maximum (Fig. 13.50b↑). (Sears et al., 2024; Sehlke et al., 2026) have updated the temperature of this strong peak to 450º C). 70180 was exposed to maximum solar heating at the surface of ~113º C during lunar day (Langseth, et al., 1973), off and on, for about 59 Myr (Table 13.15↑). Similar to 70180, a single 413º C (450º C) maximum also is present in the “surface” (sunlit) sample (70009) of the deep drill core (Fig. 13.52). The numbers in red in Fig. 13.52 are reported U+Th in ppm (Silver, 1974 or Meyer, 2012) vs. the estimate of the mean U+Th (Table 13.11↑) during a zone’s surface exposure.
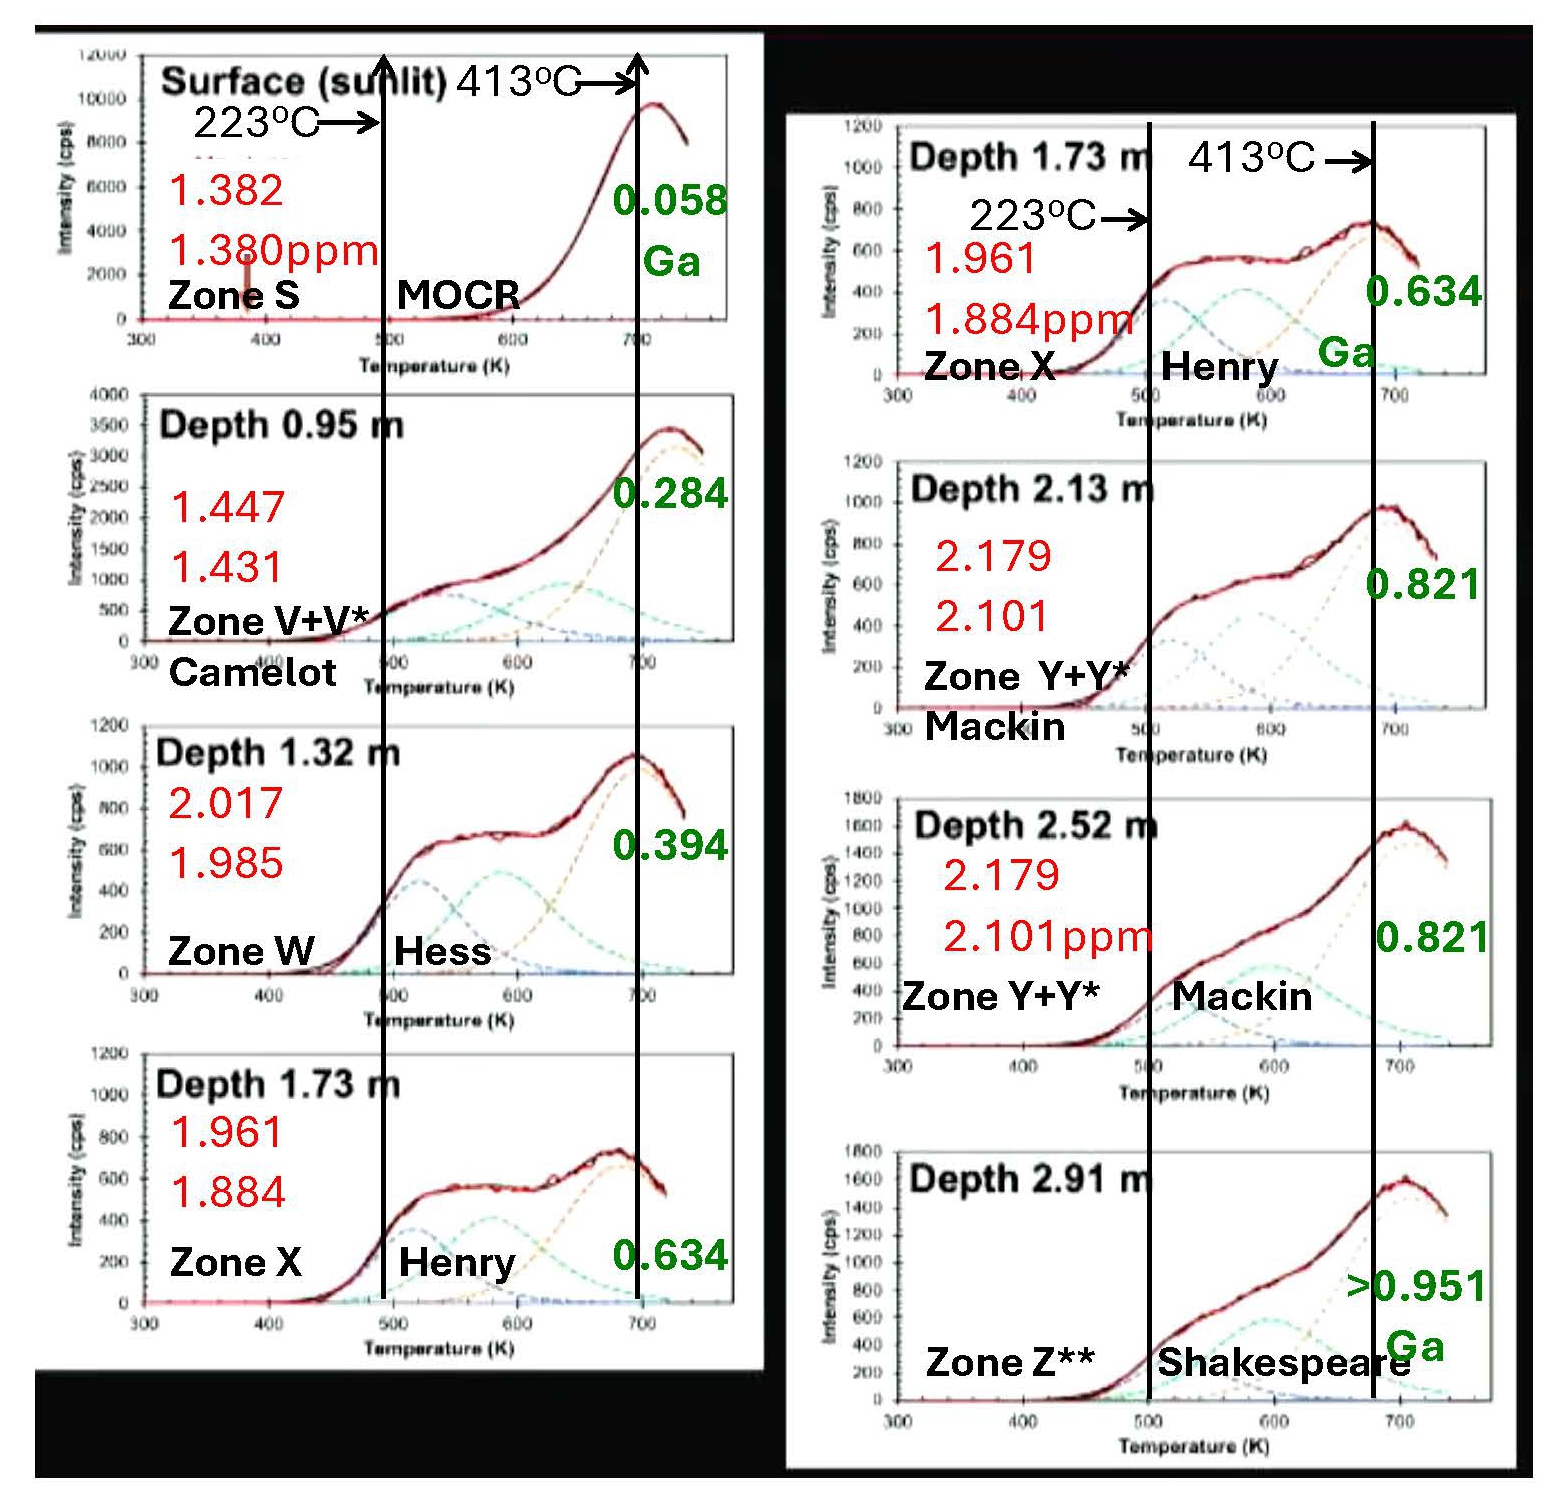 Fig. 13.52. Thermoluminescence glow curves for locations in the deep drill core 70001-9 (after Sehlke and Sears, 2022). Red figures at left are estimated changes in deposition U+Th contents in ppm (Table 13.11↑) due to decay to today’s contents (Silver, 1974). Green figures at right are zone deposition ages from Table 13.15↑. The interested reader should also refer to Sehlke et al. (2026) for a detailed, up to date analysis of thermoluminescence in the deep drill core.
The history of buried zones in the deep drill core represented in Fig. 13.52 can be outlined as follows:
- At deposition, a zone’s thermoluminescence roughly would become that of today’s zone S (59 Myr since deposition, Table 13.15↑) and of 70180 (current surface at the core site), with only a single, ~413º C (450º C) peak. Any nighttime accumulated 170º C and 270° C electron traps apparently disappear during maximum solar heating to a brightness temperature of ~113º C (386º K) as measured by both the Apollo 17 Heat Flow Experiment (Langseth et al., 1973) and the LRO Diviner sensor (Williams et al., 2019). This apparent contradiction between temperatures (270º vs. 113º C) may indicate that the bulk temperature of the regolith to ~5 cm depth (70180) is at least ~157º C higher than both the ALSEP Heat Flow surface sensor reading and the surface measurement by LRO’s Diviner instrument. This probably indicates the ~113º C measurements are a balance between solar heating and radiation to deep space, the latter not being a factor in the temperature of the regolith at depth.
- With burial below the reach of diurnal heating at ~66 cm (Langseth et al., 1973) and below the effect of cosmic rays and their secondaries at ~40 cm (Eugster et al., 1978), alpha particles (4.2 and 12 Mev) and beta radiation from uranium and thorium decay, respectively, may create electron traps that gradually broaden lower temperature thermoluminescence into a plateau with a low temperature edge at roughly 223º C. This plateau is stable between ~2.13 m (upper zone Y+Y*) and ~1.32 m (zone W) and represents a balance between trap formation and trap leakage due to temperature between –17.15 and –16.65° C (256-256.5º K; Langseth et al., 1973).
- As temperature increases below ~2.13 m to > –16.65° C (256.5- >257° K) (upper zone Y+Y*), thermally induced trap leakage becomes more dominant and the traps that create the lower temperature portions of the thermoluminescence plateau are drained more efficiently. The higher temperature traps of the original plateau persist below 2.13 m.
- After deposition, sample 70001 from zone Z** was initially exposed to a maximum mean diurnal temperature of 214º K (~100º to ~375º K) (Langseth et al., 1973) and then, at ~0.951 Ga (Zone Z+Z* deposition), it began to be progressively buried by younger regolith ejecta zones until, at about ~0.821 Ga, its temperature stabilized between 256° K and 256.5º K (–17.15° C and –16.65° C; (Langseth et al., 1973) with more than 130 cm of regolith ejecta (zone X-S) above it.
- The 223º C peak in 76240 is due to continuous build up of traps probably due to alpha+beta radiation from U and Th decay over ~19.5 Myr rather than by largely attenuated cosmic rays.
19.0 Regolith Core 76001 From North Massif Station 6
19.1 Introduction
A 31.5 cm drive tube core (76001) into the regolith near the base of the North Massif provides insights into down-slope migration of impact and seismically mobilized debris. Papike and Wyszynski’s (1980) study of this core concluded that the material in the core developed largely from “slow accumulation by down-slope movement.” They divide the sample into two units (Fig. 13.53↓), a lower unit A (31-20 cm) and an upper unit B (20-0 cm), with the distinction between the two resting on clast type-frequency analysis in thin sections (13.5% vs. 5.1% anorthosite+ norite+troctolite, and 4.4% vs. 8.4% melt-breccia, respectively). They report 2% more fine-grained material in unit B and ~1% more lithic clasts in unit A. Agglutinate contents of the core are 43.2% (A) and 48.6% (B).
In contrast to the delineation by Papike and Wyszynski of two units, Nagle (1979) describes six units in the core, based on detailed binocular observation of particle characteristics and size- and type-frequency determinations during dissection. Nagle’s units 1 and 2 and 3-6 appear roughly to match Papike and Wyszynski’s (1980) lower and upper units A and B, respectively. Nagle also reports a paucity of glass particles (pyroclastic ash?) in the core as a whole relative to other lunar regolith samples. These various factors indicate a much more consistent mixing environment and prolonged maturation than for the distinct regolith ejecta units in the deep drill core from the central valley area.
The reported observations would suggest significantly different sources and maturation histories for units A and B. Indeed, Morris and Lauer (1979) report (Fig. 13.53↓) that Is/FeO is variable between 65 and 88 for upper unit B and variable between 60 and 78 for lower unit A. The cosmic ray track density pattern in plagioclase grains as a function of core depth (Corzaz, 1980) suggests that such densities between 5 and 20 cm are significantly greater than below 20 cm, that is, less near-surface exposure for the regolith in Papike and Wyszynski’s lower unit A. This conclusion is supported by a significant statistical reduction in “quartile” track densities between 20 and 27 cm.
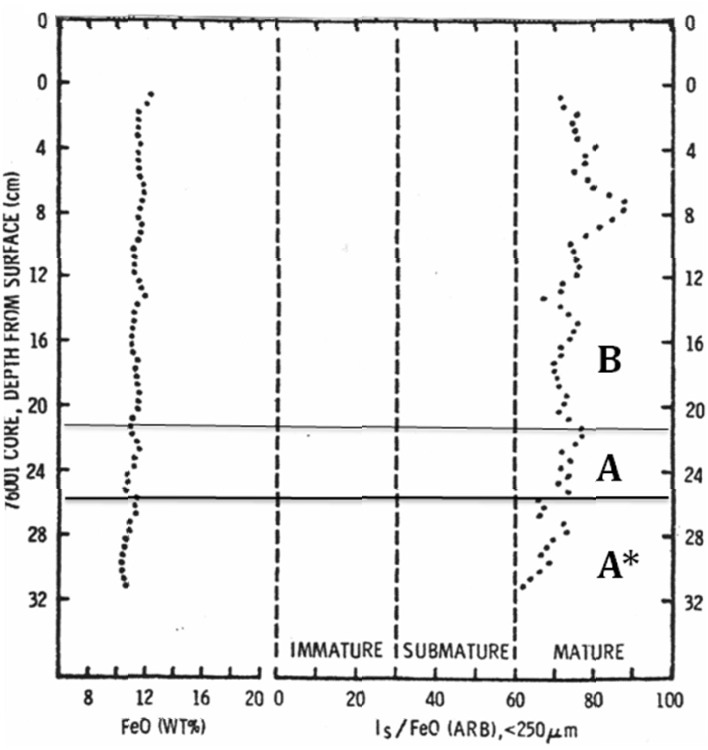 Fig. 13.53. Maturity index and FeO variation with depth in drive tube core 76001 (after Morris and Lauer, 1979). Units A and B division is after Papike and Wyszynski’s (1980). Unit A* is distinct from A in trace element composition and plagioclase abundance as well as in the values and pattern of Is/FeO.
Relative to the August 1972 solar flare, Evans et al. (1980) report a steep upward increase at ~6 cm depth in the quantity of cosmogenic radionuclides 26Al and 22Na, roughly corresponding to their model expectations, however, they do not see such an increase in 53Mn. Nishiizumi et al. (1990) also show a pattern of increase above ~5 cm for radionuclides 14C and 36Cl.
19.2 Petrographic, Petrological and Maturation Variables in Core 76001
A comparison of the available compositional data on 76001 with other potentially relevant samples is given in Table 13.33. A comparison of the few major element compositions determined for units A and B shows no great differences in FeO, CaO or Na2O; however, comparison of Sc, Sm, Fe and Ni contents (Korotev and Bishop, 1993) show consistent differences between the units (Fig. 13.54↓) as well as within Papike and Wyszynski’s unit A. Meyer’s (2012) list of unpublished Korotev data also indicates that similar variations may exist in all of the reported trace element concentrations. Although Ni concentration is relatively constant through the two units, major peaks in Ni concentration are confined to upper unit B.
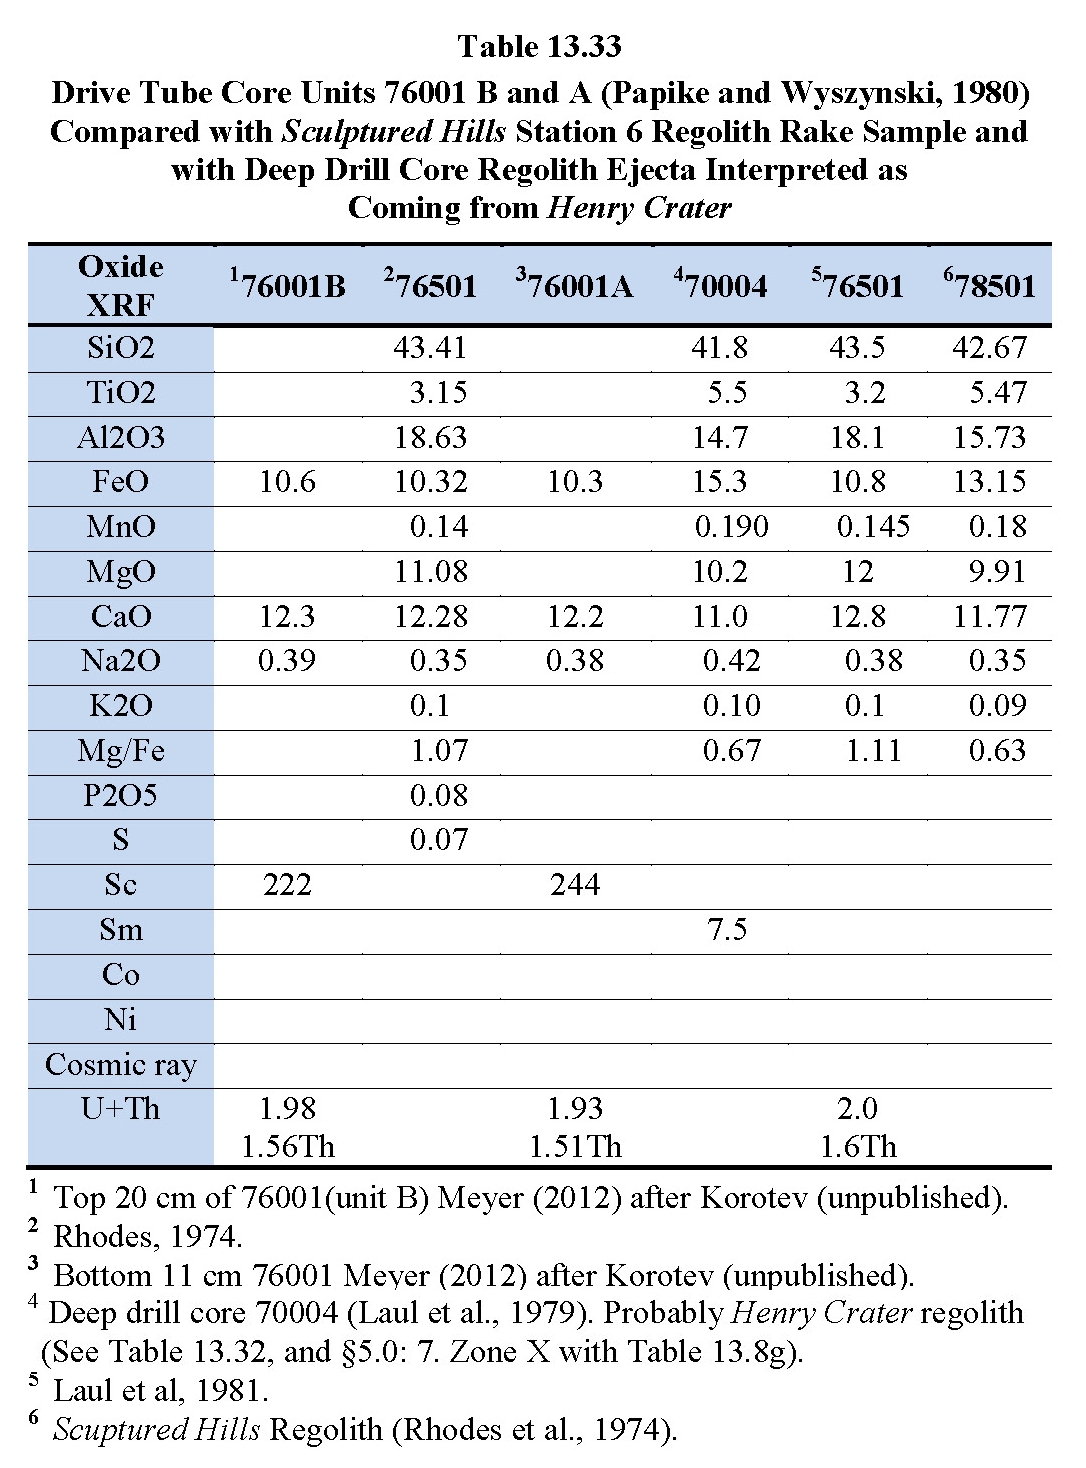
Links for Papike and Wyszynski (1980), Meyer (2012), Rhodes et al. (1974), Laul et al. (1979, 1981), Table 13.32↑ and 7. Zone X↓.The detailed comparison of Morris and Lauer’s Is/FeO variations (Fig. 13.53) with the work of Nagel’s Fig. 2 and Papike and Wyszynski’s Fig. 4 strongly suggests that the 76001 core is made up of numerous thin regolith ejecta units from sources of variable maturity within the broad differences between units A and B. Within Papike and Wyszynski’s unit A, however, there are indications of two regolith ejecta units, as also noted by Nagel in his separation of Units 1 and 2 at 25.5-25 cm. Those indications are:
- The sharp, 8-point increase in Is/FeO at 25.5-25 cm (Fig. 13.53↑), rather than the steady rise expected for long term surface exposure, suggests deposition of a regolith ejecta unit before that of unit A, labeled in Fig. 13.53 as unit A*.
- Is/FeO in A* shows a steady rise from 60 to 72, followed by a 7 point sharp reset to 65 before the sharp 8-point increase, whereas, unit A’s Is/FeO is relatively steady around 72 ± 2.
- In Fig. 13.54↓ unit A* shows a distinctly oscillating concentration pattern of Sc and Sm variations as well as lower average FeO content. A small Ni spike appears at ~25.5 cm, possibly associated with its source impacting object.
- In Fig. 13.55↓, Papike and Wyszynski show the amount of anorthosite+ norite+troctolite clasts in A* is about 50% greater than that in A with a distinct reduction from A* to A at about 25.5 cm.
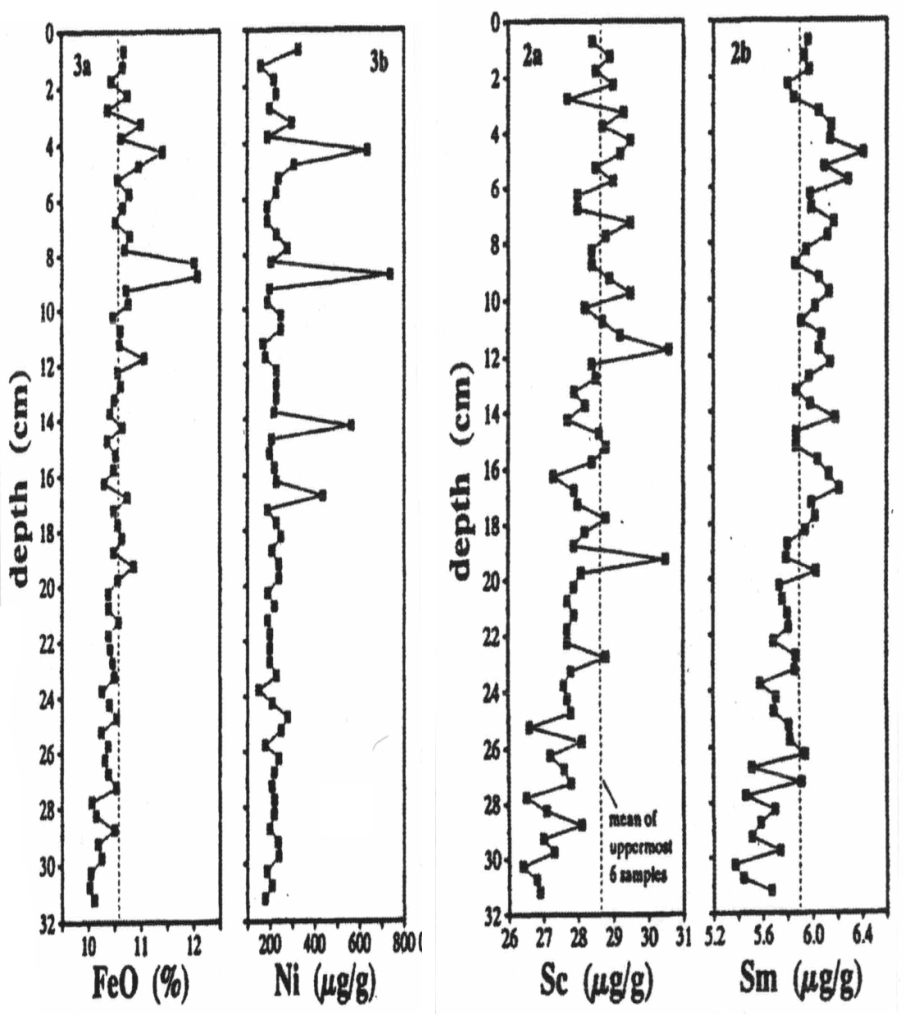 Fig. 13.54. Variations in Sc, Sm, FeO and Ni with depth in drive tube core 76001. (After Korotev and Bishop, 1993).
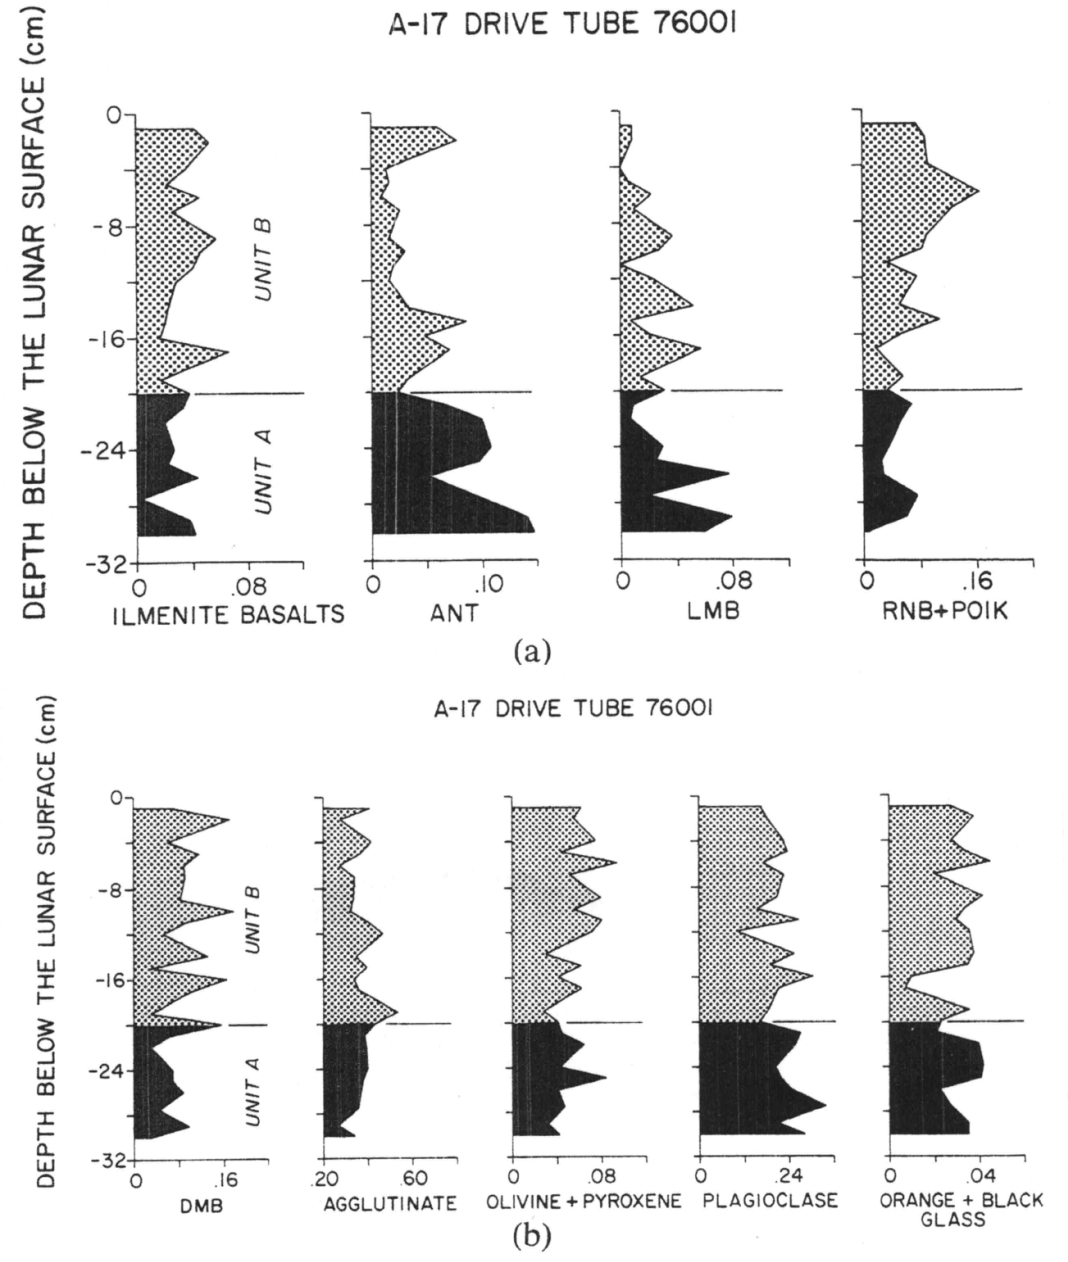 Fig. 13.55. Papike and Wyszynski (1980): “(a) Modal variations of ilmenite basalts (mare), ANT (anorthosite, norite, troctolite), LMB (light matrix breccia), and RNB+POIK (recrystallized noritic breccias and pyroxene-poikilitic melt rocks) in drive tube 76001. Note the different scales on the horizontal axes. (b) Modal variations for several soil components in drive tube 76001. DMB stands for dark matrix breccias. Note the different scales on the horizontal axes.”
Fig. 13.55 is Fig. 4 from Papike and Wyszynski (1980). It shows variations in modal percentages for the indicated components as a function of depth in core 76001 as measured in thin section.
Table 13.34 compiles the Is/FeO variations as a function of related depth intervals with red and black text distinguishing between increases and decreases, respectively. The table also shows the relation of Is/FeO changes to the units identified by Nagel and the modal percentages of clasts noted by Papike and Wyszynski.
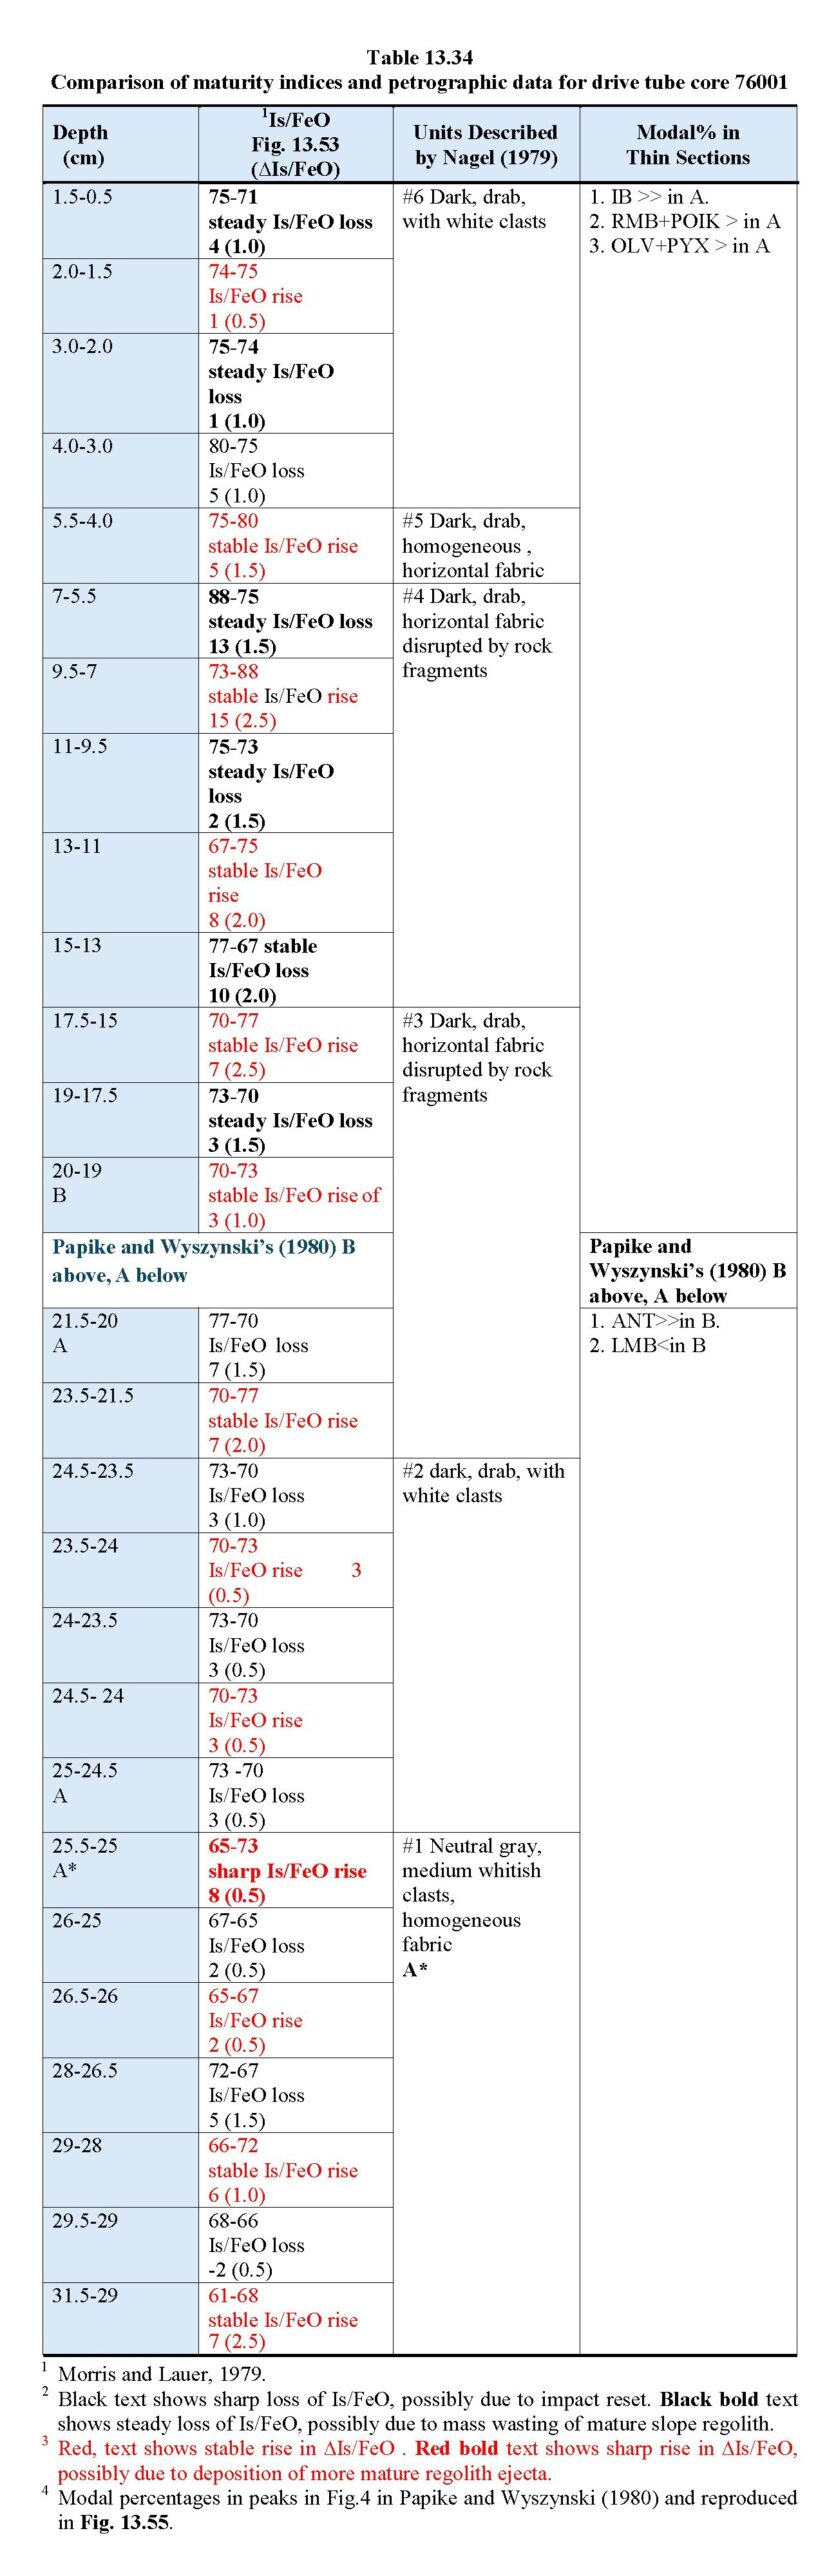
Link for Morris and Lauer (1979), Papike and Wyszynski (1980) and Fig. 13.55↑.A general synthesis of the data in the preceding figures and tables related to core 76001 is as follows:
- Fig. 13.53↑ shows that Is/FeO ranges are significantly different in A* (61-73), A (70-77) and B (65-88) (Morris and Lauer, 1979), i.e., indicating different exposure histories.
- The patterns of variation in Is/FeO in the A and A* units ( Fig. 13.53) versus unit B are distinct, with B showing stable increases alternating with steady decreases, whereas, with the exception their interface at 25.5-25 cm, A and A* show stable increases alternating with sharp decreases, similar to that observed in half-centimeter by half-centimeter logging of deep drill core regolith zones (§4.3). This latter pattern suggests stable maturation environments with little or no over-riding mass wasting or ejected regolith.
- Cosmic ray track densities in plagioclase are generally lower in A and A* than B (Corzaz, 1980), i.e., they have different total near surface exposure durations.
- Average FeO, Sc, and Sm concentration in A and A* are slightly lower than in B (Korotev and Bishop, 1993), and Sc and Sm concentration patterns oscillate ± 1 ppm and ±1ppm, respectively, on a half-cm frequency in A* vs. very little oscillation in A (Fig. 13.54↑, Korotev and Bishop, 1993). These differences are consistent with different original sources for the three units.
- With one small exception at the interface between A and A*, spikes in Ni content in A and A* are absent, unlike the four large spikes present in unit B (Fig. 13.54, Korotev and Bishop, 1993), suggesting greater exposure to meteoritic gardening in B.
- FeO concentration decreases gradually from 12% to 10% from the top of A at 21.5 cm to bottom in the core (Fig. 13.54; Korotev and Bishop, 1993). This decrease is not as clear in the Morris and Lauer (1979) data in Fig. 13.53↑.
- “Crystallized matrix breccia” is slightly less abundant in A than in B (Nagel, 1979).
- “Light matrix breccia” is slightly more abundant in A than in B (Nagel, 1979).
- There are ~10% anorthosite+norite+troctolite clasts in A and ~15% in A* vs. 2-8% in unit B (Fig. 13.55↑, Papike and Wyszynski, 1980).
- There are 3-8% melt-breccia clasts in A vs. 2-16% in unit B ( Fig. 13.55, Papike and Wyszynski, 1980).
- Papike and Wyszynski (1980) report 2% less fine-grained material and 1% more lithic clasts in A vs. B, although, with respect to the latter, Nagel (1979) and visual observation of images of the core indicate that lithic fragments are more abundant in unit B. This contradiction may be the result of observation in thin-section (Papike and Wyszynski) vs. binocular microscope (Nagel).
- Both Papike and Wyszynski and Nagel report minor orange+black pyroclastic ash in the core with no apparent differences between units A and B.
- The rim of the 724 m diameter, 0.634 Ga Henry Crater lies about 600 m south of Station 6 and probably contributed ejecta sheath regolith to the site of core 76001. There is no indication, however, that such ejecta is represented in the core. For example, the compositional modeling in §5.0, for deep drill core zone X suggests that as much as ~7% VLT ash 70007 and little or no orange+black ash 74220 may be in regolith ejecta from Henry Crater. The Shorty Crater type orange+black ash (74220) mean grain size is 40 µ (Heiken and McKay, 1974), so, except for Papike and Wyszynski, published modal data on sizes >90 µ would miss most pyroclastic ash. Papike and Wyszynski, however, report modal data at 12 depths for 20 to 200 µ glass particles that probably included most ash particles except for fine shards. The amounts of ash found are as follows: orange+black as <6%, yellow+green (VLT) as <0.6%, brown as <0.5%, and clear as <0.5%. The modes show no obvious systematic variations with depth, although the highest concentrations of orange+black ash (1.0-1.6%) are in their zone A. It is unlikely, therefore, that Henry Crater impact contributed to unit A, although variability in pre-Henry regolith distribution might explain these differences.
- The minor content of reported orange+black ash and FeO content of ~10 wt% point to a North Massif slope source for unit A, as no regolith samples from Taurus-Littrow, except those from Station 6, appear to meet both these constraints, particularly that of the low FeO.
- These various differences strongly indicate that the nature of source materials feeding regolith development in the vicinity of Station 6 changed measurably during the time represented by the 35 cm length of core 76001. A very close compositional match for core units A and B is found in the nearby rake sample 76501 (Table 13.34) and strongly suggests that at least unit B is comprised of regolith developed in situ. Small scale variations over a few centimeters in unit B indicate that its stratigraphy is the result of small impact and mass wasting of regolith of varied maturity present on the nearby slope of the North Massif (~26º above Station 6) but which is subjected to intervals of relatively stable increases in Is/FeO. These increases have been interrupted by sharp partial resets due to local impacts. In this context, significant variations in optical maturity are visible in many images of the slope rising above the site of the core. Impacts in the valley occasionally added small amounts of basalt and orange+black ash to this mix, now accounting for 1-8% (Papike and Wyszynski, 1980) and 1-4% (Nagle, 1979) in various levels of the unit B. Over time, agglutinate particles have grown in abundance.
- Unit A also resembles rake sample 76501 in composition, however, its detailed Is/FeO pattern suggests that the unit consists of thin regolith ejecta units rather than being the product of mass local wasting. Also, comparison of Is/FeO values in Column 2 of Table 13.34↑ with the modal variations below ~20 cm in Fig. 13.55↑ show a strong correlation between changes in Is/FeO and those in various components with a large increase in the anorthosite–norite–troctolite (ANT) component in Papike and Wyszynski’s unit A. A’s possible source is the ~15 m diameter crater (Wolfe et al., 1981), the rim of which is about 17 m up-hill from the core site (Fig. 13.56↓). (This is the same crater from which Hasselblad panorama AS17 141- 21575 to 21603 was taken (Chapter 12; Schmitt, 2024c). If the unit A impact occurred farther up the slope from Station 6, it has been obscured by mass wasting. Such mass wasting on a slope as steep as ~26° would be geologically rapid compared to the valley floor due to the likely collapse of the over-steepened upslope crater walls as well as more rapid and longer distance movement of material downhill.
- Like unit A, unit A* resembles 76501 in general composition and has an Is/FeO pattern that suggests regolith ejecta rather than slope regolith; however, the abundance of anorthosite+norite+troctolith clasts indicates the presence of Sculptured Hills source rocks in the area of its source crater impact, possibly on top of the North Massif. Examination of the Lunar QuickMap images indicates that there is a ~500 m diameter crater near the crest that appears to straddle the contact between the terra-like top of the massif and the Sculptured Hills physiographic area. Although this crater is of uncertain age, it is a candidate as the source crater for unit A*.
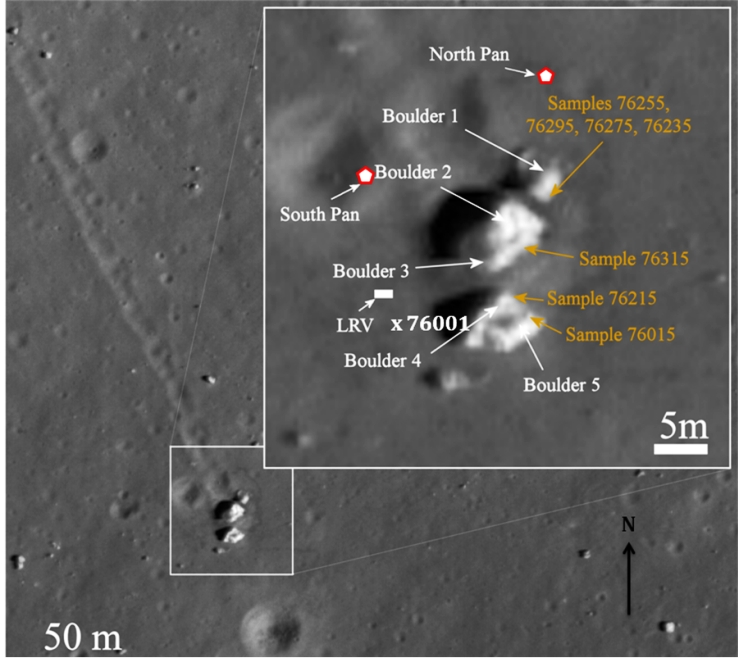 Fig. 13.56. Plan view of Station 6 boulders and craters, showing location of core 76001 relative to the “South Pan” potential source crater for unit A (after Le Mouélic et al., 2024).
Fig. 13.57 shows a graphical analysis of potential trajectories from a hypothetical large crater near the crest of the North Massif. The figure suggests that maximum deposition from an impact regolith ejecta parabola could reach the Station 6 location at ~4.0 km from the crest of the North Massif.
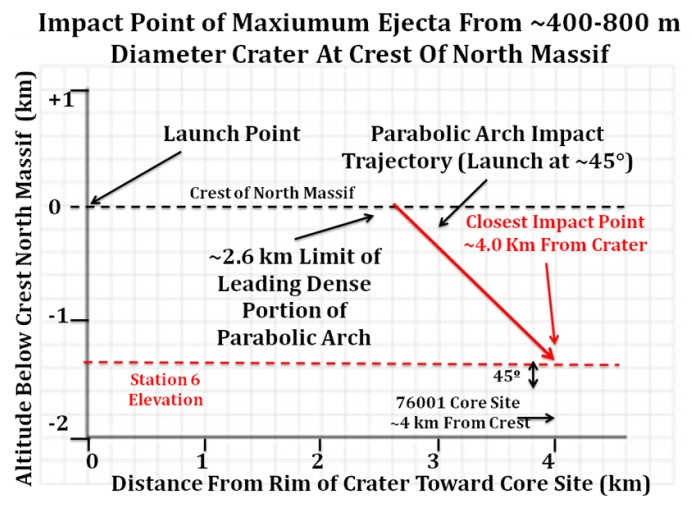 Fig. 13.57. Graphical representation of the reach of regolith ejects deposition from a large impact at the south crest of the North Massif relative to the location of Station 6 core 76001.
19.3 Exposure Age Considerations Related to Core 76001
The sum of increases in ∆Is/FeO values given in Table 13.34↑ is 39 for surface unit B. With a U+Th content of 1.98 ppm (Table 13.33↑, col. 2), unit B’s ∆Is/FeO / Myr would be ~1.25 (0.58 × 1.98 ppm + 0.11). The solar proton-only ∆Is/FeO / Myr would be essentially the same as 0.11 calculated for sunlit sample 76220 (§6.3.3) relative to a comparison with shaded sample 76240 as measured against an ~19.5 Myr cosmic ray exposure age for recent exposure of the boulder at Station 6. This gives an exposure age for unit B = ~31 Myr (39 / 1.25). This exposure age implies that North Massif slope regolith began to migrate downward to cover unit A regolith ejecta approximately 31 Myr ago. The average rate of mass wasting deposition at this location (~20° slope), therefore, is ~0.65 cm / Myr (20 cm / 31 Myr).
There are six possible Is/FeO resets in unit B, indicating an average reset impact near the core site about every 5.2 Myr years. The steady loss of 10 Is/FeO points at 15-13 cm and of 13 at 7‑5.5 cm might be the result of the introductions of younger ejecta; however, that would only change the rate of resets to one every 6.2 Myr and every 7.8 Myr, respectively. All three of these possible reset rates are close to every 5.7 Myr calculated for the deep drill core (§9.1).
Similarly, the sum of increases in ∆Is/FeO values in Table 13.34 is 13 for unit A. With U+Th = 1.93 ppm (Table 13.33, col. 4), the ∆Is/FeO / Myr for unit A is 1.25 (0.58 × 1.93 ppm + 0.11). A’s exposure age would be ~10 Myr (13 / 1.25). The ~41 Myr total exposure for units B and A may roughly date the “South Pan” source crater’s impact.
As the core 73001 probably did not sample all of unit A*, its Is/FeO = 15 only provides a minimum exposure age of about 12 Myr and a minimum absolute age of its source crater of about 53 Myr (12 + 41). This fact makes it more likely that the age of A* is only a few Myrs older that A, that is, a time significantly less than the 31 Myr necessary to accumulate slope regolith on the upper surface of A* comparable to unit B.
20.0 Orange+Black and VLT Ash Distribution in North Massif Slope Regolith.
Pyroclastic ashes, both orange+black and VLT, erupted throughout Taurus-Littrow (§10.0; Schmitt et al., 2017) between about 3.82 Ga and 3.60 Ga, soon after the ~3.82 Ga eruption of the last ilmenite basalt lava. The 70 cm double drive tube 74001/2 in ash at Shorty Crater (Station 4) indicates that about a half-meter to a meter of ash probably initially fell on the slopes of the North Massif and probably on the South Massif as well. There also are LRO NAC stereo images that indicate pyroclastic fissures cross the Sculptured Hills (Schmitt et al., 2017). Mini-RF data show a probable fissure on the south-facing slope of the North Massif.
After ash eruptions ceased, ancient regolith near the base of the North Massif debris apron above its intersection with the valley basalt regolith would have been ash covered as well as the valley floor. There are now only small amounts of orange+black pyroclastic ash present in core 76001 (2-4% in units A* and A and 1-5% in unit B, Fig. 13.55↑) and in other samples of North and South Massif slope regoliths. This contrast is likely the result of the dominance of down-slope movement of the original ash cover over that of indigenous massif regolith, until essentially all initial ash on the massif slopes had been removed to their base apron. Indeed, Schmitt et al. (2017) and Petro and Schmitt (2018) have concluded that a large, largely exposed debris flow of ash accumulated down slope from the pyroclastic fissure on the North Massif, north of Camelot Crater.
Ash from higher slopes would have mixed with and covered the original ash deposits at the base of the massifs. Subsequently, these ash accumulations then were covered by the gradual increase in indigenous massif regolith like that which currently forms the upper portions of the apron at Station 6. A significant concentration of orange and black pyroclastic ash, including both original ash deposits and ash particles transported down-slope, very likely lies beneath the existing regolith apron. An estimate based on the above mass wasting deposition rate of 0.65 cm / Myr would suggest that the ash has been covered by about 23 m of apron regolith in 3600 Myr since the last orange+black ash eruption.
21.0 Boulder Tracks in Massif Regolith
21.1 Introduction
Boulder tracks in regolith on the slopes of massifs provide a major asset in determining the stratigraphic sequence of samples from the boulders at the base of a massif (Schmitt et al., 2017). The degradation of these tracks, however, by micro- and macro- meteor impact and seismic induced mass wasting, limits selection of boulders whose investigation would be useful to stratigraphic interpretation of the units underlying a given massif slope, although samples and observations of trackless boulders will be valuable for other reasons. Determination of the rate of degradation of tracks also provides insights into the rate and depth of slope regolith overturn.
Tracks in one-sixth g tend to be strings of bouncing boulder impact craters rather than continuous troughs. The longevity of tracks, of course, depends on the depth and width of a track that, in turn, depends on the mass of the boulder, the steepness of the slope, and the kinetic energy at each impact with the slope regolith. As massif slopes that define the valley of Taurus-Littrow are roughly the same (~26°) for most of their height, boulders of roughly the same size bouncing directly down hill would have roughly the same kinetic energy while producing a track.
21.2 Longevity of Massif Boulder tracks
The boulders sampled at Station 6 and 7 both have tracks in the North Massif regolith that lead to their sources higher up on the slope behind them (Schmitt et al., 2017). These tracks led Schmitt et al. to the rough stratigraphic delineation of Crisium and Serenitatis melt-breccia ejecta units, overlain by Imbrium ejecta (Sculptured Hills), that make up the massif. On the other hand, no tracks have been identified behind the boulders sampled at South Massif Station 2 that have rolled into place since the light mantle avalanche occurred sometime between 27 and 34 million years ago (§17.4 indented, bracketed text). Exposure ages measured for the North and South Massif boulders sampled at Stations 2, 6 and 7 help define the longevity of tracks impressed on massif slopes of ~26º -28º (Fig. 13.58).
 Fig. 13.58. Rough indication of the trend in boulder track degradation based on boulders at Station 6 (6-2) and Station 7 (7-1). Boulders at Station 2 have no visible tracks. Note that the indicated dashed trend would eventually become asymptotic to exposure age as track depth approached zero.
Exposure ages determined for surface samples from the North Massif Station 6 boulder (76015, 76215, 76315) (Corzaz et al., 1974; Turner and Cadogan, 1975; Codogan and Turner, 1976) indicate that its well-defined track in the slope regolith, ~1-2 m deep and ~8 m wide (Wolfe et al., 1981), formed 17-22 million years million years ago. This boulder’s track, however, is not directly down slope, but at a large angle to that slope. (Note that the exposure age for the Station 6 boulder sample 76315 should be very close to the time the boulder rolled into place as it is likely from a fracture surface that formed as the boulder came to rest.)
The significantly fainter, ~0.5 m deep track behind the smaller boulder at Station 7, identified only after LROC images were obtained (Schmitt et al., 2017), formed 25-32 million years million years ago (77075, 77135) (Stettler et al., 1974, 1978; Turner and Cadogan, 1975; Corzaz et al., 1974; Eberhardt et al., 1974). There is strong evidence in the comparison of U+Th in regolith samples at Station 6 that bouncing boulders shed significant material from their surfaces (§6.0). It is likely, therefore, that the cosmic ray exposure ages on tracked boulder samples are close to the roll age for a given boulder. Close examination of LROC images indicates that the Station 7 boulder broke off a larger boulder just before coming to rest (Schmitt, 2021). This boulder rolled almost directly down slope from a point ~500 m vertically above the Station 6 boulder (LRO topographic map analysis).
No tracks have been defined leading to boulders sampled at the base of the South Massif (Station 2), although, tracks are visible to the northwest of the station. Tracks older than the young light mantle avalanche have been erased. Boulder #1 at Station 2, comparable in size to the Station 7 boulder, has measured Kr exposure ages of ~41 Myr for partially shielded samples 72215 and 72255 (Leich et al., 1975). Leich et al. also report that sample 72275 from the top of the same boulder has a Kr exposure age of 52 ± 1.3 Myr that is likely the actual, unshielded exposure age and probable roll age. The range of exposure ages for boulders at Station 2 is 27-110 Myr (compiled by Schmitt et al., 2017). 52 Myr, therefore, is very likely older than the age when the track for Boulder #1 completely disappeared (Fig. 13.58↑).
As noted previously, the reported exposure ages for the Station 7 boulder range from 25 to 32 Myr. In addition, the track for this boulder is much less distinct that that for the much larger Station 6 boulder with reported exposure ages for the latter ranging from 17 to 21 Myr. On the other hand, from an energy of formation perspective, the Station 6 boulder rolled at an angle of about 60°-70° from the horizontal across the slope of the North Massif, limiting its kinetic energy and making its original track depth more comparable to the original straight downhill track for the Station 7 boulder. The greater degradation observed for the Station 7 boulder track, however, indicates that the track clearly formed before the Station 6 track.
Although limited, the evidence from the Stations 6 and 7 boulders plotted in Fig. 13.58↑) indicates that boulders rolling with comparable kinetic energy leave tracks that largely disappear within about 50 Myr.
22.0 Age of Imbrium Basin-Forming Impact Between 3.850 and 3.795 Ga
[Unless otherwise noted, the ages used in the following discussion are 39-40Ar ages uncorrected for a more recent 40K decay constant revision in order to compare earlier reported relative age differences. Those few recently reported ages that have reported downward revisions have been increased back to values based on the old decay constant in order to compare with past age determinations. This adjustment used a 0.52% reduction in reported ages based on old decay constant as calculated by Schmitt et al. (2017) in their tables 1 and 2.]
The regional relationships of the Sculptured Hills strongly suggest that it is comprised of ejecta from the Imbrium basin-forming impact (Schmitt et al., 2017). In §11.2, the analysis of the exposure age of the light gray regolith at Shorty Crater pointed toward a deposition age of ~3.9 Ga for Sculptured Hills-like material with a mean regolith exposure age of ~3.8 Ga, consistent with the 3.8-3.9 Ga ages of Imbrium proposed by many other earlier analyses (Wilhems, 1987; Heiken et al, 1992; Schmitt et al., 2017; Nemchin et al., 2021).
The data available from Taurus-Littrow that helps to refine the age of the Imbrium basin-forming event are as follows:
- Compositional characteristics indicate that light gray regolith initially developed on Sculptured Hills-like material from the Imbrium Basin-forming event (§11.0), arriving in the Taurus-Littrow valley after 3.875 ±05 Ga, based on an average of the Serenitatis Basin formation ages reported as 3.880 ± 0.05 (39-40Ar, Stettler et al., 1978) or 3.870 ± 0.05. Alternatively, it was deposited after 3.865 Ga. (Schmitt et al., 2017, adjusted to a 39-40Ar age from 3.840 Ga), based on analysis of Taurus-Littrow’s ages of impact melt breccias in boulders traced to specific stratigraphic locations on the North Massif.
- The last eruption of post Imbrium ilmenite basalt was at 3.820 ±05 Ga.
- The ages for the events in items (1) and (2) suggest about a 45-55 Myr window in which the Imbrium event could occur between the Serenitatis event and the last basalt eruption, assuming that basalt eruptions were short-lived.
- The probable 160 ± 50 Myr cosmic ray exposure (§4.2; Table 13.5↑) for the light gray regolith before being covered by ash sometime after 3.82 (3.60 Ga + 221 Myr) suggests that effective ash coverage occurred roughly at 3.715 Ga (3.820 Ga minus 160-55 Myr), with excavation by Fitzgibbon Crater occurring at ~58 Ga (3.60 Ga-24 Myr.)
- An Imbrium basin-forming event between 3.875 and 3.820 Ga (39-40Ar) or 3.850 and 3.795 Ga (corrected for new 40K decay constant) would appear to be consistent with the above data and reported error limits.
23.0 Dark Mantle Dilution of Light Mantle Regolith
With a measure of the dark mantle content in light mantle regolith samples, a model of the regolith diffusion as a function of distance from their contact should be possible. A first cut at such a model is shown in Fig. 13.59↓ based on data in Table 13.35. To obtain a rough measure of the dilution of a light mantle sample by material distributed by impact in the dark mantle, the variation in FeO (∆FeO) in surface samples of light mantle relative to the FeO in sample 73141 (13.5%) is shown in column 4 of Table 13.35. Sample 73141 was taken from ~15 cm down in a trench in the light mantle and below the obvious discoloration (darkening) caused by new regolith formation (sample 73121).
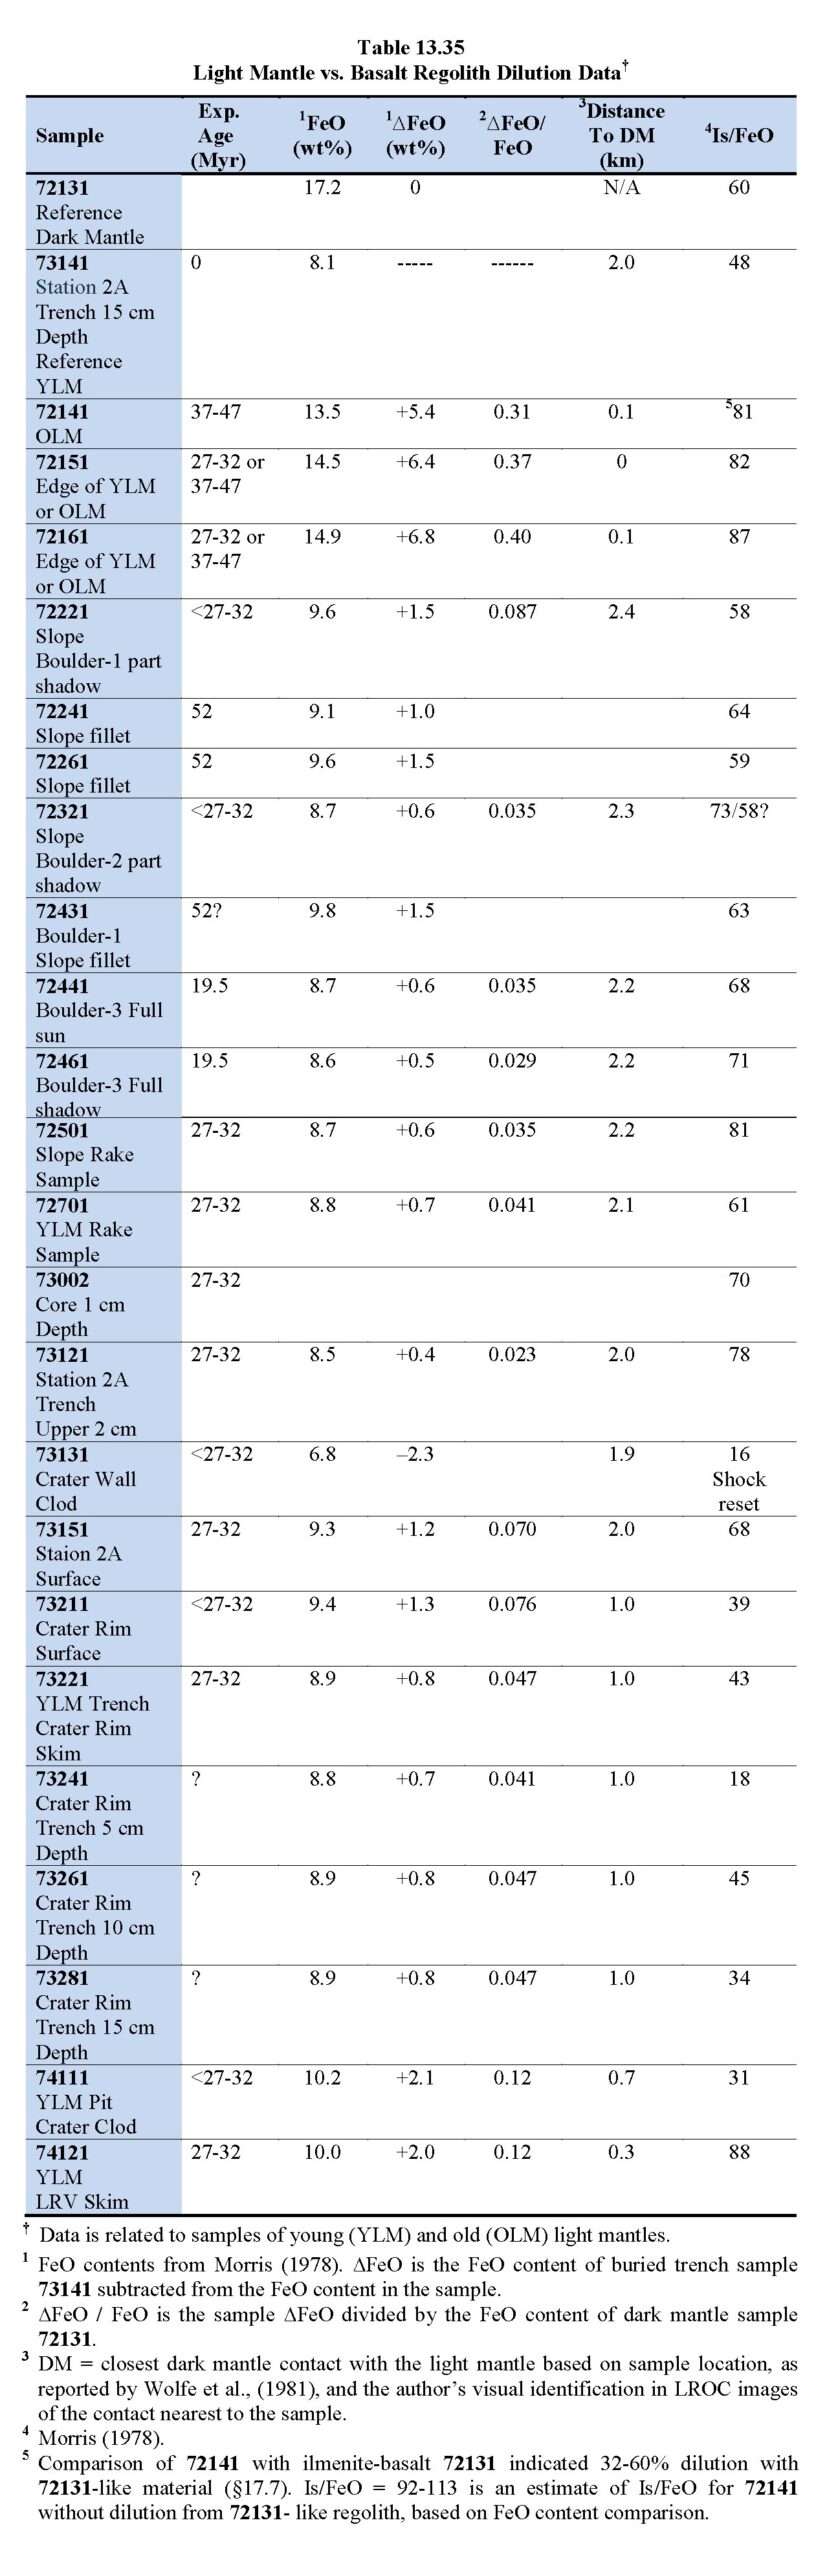
Links for Morris (1978), Wolfe et al. (1981) and §17.7.Normalizing these ∆FeO values by dividing by the FeO content of dark mantle sample 72131 (17.2%) (Column 5 in Table 13.35↑) provides a consistent reference for plotting the proportion of dilution as a function of the distance of a light mantle sample from the nearest approximate contact with the dark mantle (column 6 in Table 13.35). (Dark mantle reference, 72131, is ~1.3 km to the east of a contact with the nearest light mantle.) Only samples that have a clear light mantle relationship are taken from Table 13.35 and plotted in Fig. 13.59.
 Fig. 13.59. Plot of ∆FeO/FeO vs. distance to dark mantle contact for samples of old (red) and young (light green) light mantle samples listed in bold text in Table 13.35. Purple samples are in shadow or partial shadow. Curve is approximately of the y = 1/x class.
The dashed, hand-drawn curve in Fig. 13.59 appears to show what would be expected from age dependent dilution of the light mantle by dark mantle ejecta, namely, an asymptotic relationship with respect to both degree of dilution (∆FeO / FeO) and distance from contact with the light mantle. The curve is approximately defined by the equation y = 1/x.
One bias issue with the curve in Fig 13.59 is that the highly diluted samples are from the old light mantle and were obtained close to the contact with dark mantle, whereas, the slightly diluted samples are from the young light mantle were obtained at 0.5 to 2.2 km from that contact. On the other hand, the shape of the curve would be the same independent of age, but would move in the directions indicated in Fig. 13.59 depending on age. Within the limits of available sample data, however, and in the absence of samples from other locations relative to the light mantle-dark mantle contacts, it would be difficult to distinguish the difference between curve positions for the two ages.
There is one further point to make relative to the curve in Fig. 13.59↑. The apparent zero distance intercept of the empirical curve at ∆FeO / FeO = ~0.40, rather than being asymptotic to zero value of distance, probably is the result of pre-avalanche dilution of the South Massif source regolith.
The data in column 5 of Table 13.35↑ further indicate that, (1) in addition to sample 72141, samples 72151 and 72161 are from points very near a dark mantle contact and likely are significantly diluted old light mantle, as also found in the Is/FeO test for 72141 in §17.7; and (2) that the four Station 3 trench samples from the rim of a ~10 m diameter crater at Station 3 have had roughly the same exposure to dilution by dark mantle regolith. Station 3 trench sample 73261 has about ~8-10 percentage points more agglutinates and slightly more orange+black ash (Heiken and McKay, 1974), comparable to the light mantle pre-avalanche reference soil 73141, and its darker color (lower reflectance) indicates that it is from the transition zone in drive tube core 73001/2 (§17.5).
24.0 ∆Is/FeO / Myr Considerations Related to Station 1 Samples
The Station 1 regolith samples, 71041 and 71061, from the rim of a 10 m crater appear to be regolith developed since the impact that formed that crater. The boulders at the rim, 71035-37 and 71135, as the most deeply derived ejecta, appear to be from the rubble zone on top of the underlying basalt bedrock or from such a zone ejected intact by the Steno impact.

Table 13.36 provides the reported data on samples from Station 1. Regolith sample 71041 was a skim sample of the upper 1-2 cm and 71061 was a bulk sample of the upper 5 cm (Chapter 10; Schmitt, 2024a). The measured Is/FeOs of the two samples are very different, namely 29 and 14, respectively (Morris, 1978). This large difference in Is/FeO suggests that gardening since the crater formed had taken place only to about 2 cm depth; however, the low Is/FeO of 71061 = 14 further suggests that this would be regolith largely associated with the basalt rubble that formed on the basalt lava rather than having formed from the disintegration of rim boulders. Both samples were partially shaded down sun by the small rim boulder (71055). The Is/FeO = 34 from the sunlit rake sample (71501) taken on the crater’s ejecta blanket, however, suggests that shading of 71041 did not cause a major reduction in accumulated Is/FeO.A cosmic ray exposure age of 110 ± 7 Myr (Arvidson et al., 1976) was measured on rim boulder sample 71035-37. Another exposure age of 102 ± 3 Myr measured on sample 71135 from another nearby rim boulder (Niemeyer, 1977). As rough confirmation of these ages, one of 12 impact glasses from rake sample 71501 also gave a 39-40Ar age of 102 ± 40 Myr (Zellner et al., 2009).
The U+Th data suggest that the regolith sample 71041 has been largely derived from boulders similar to the two rim boulders, whereas regolith sample 70161 may include material of slightly greater U+Th content.
With the data in Table 13.36↑, and using the alpha+beta ∆Is/FeO / Myr / ppm U+Th = 0.58 and the solar proton ∆Is/FeO / Myr = 0.11 derived from Station 6 regolith samples, ∆Is/FeO / Myr for 71041 = 0.61 (0.58 × 0.86 ppm + 0.11) and for 70161 = 0.79 (0.58 × 1.17 ppm + 0.11). For an exposure of 110 Myr (71035-36), the ∆Is/FeO = ~67 (0.61 × 110 Myr) for 71041 and ~87 (0.79 × 110 Myr) for 71061. For an exposure of 102 Myr (71135-36), the alpha-only ∆Is/FeO = ~62 (0.61 × 10² Myr) for 71041 and ~81 (0.79 × 10² Myr) for 71061.
These high, calculated ∆Is/FeO values for regolith associated with boulders on the rim of the Station 1 crater, as compared to their low measured values, would indicate that the cosmic ray ages of the boulders, as well as the calculated ∆Is/FeO values, reflect exposure prior to being excavated at Station 1. Impact reset of the calculated regolith ∆Is/FeO values probably were in play as well. This pre-impact exposure may have been during basalt rubble formation after the youngest lava eruptions at 3.82 Ga and before burial by pyroclastic ash at ~3.60 Ga (see §22.0).
25.0 Lithoclastic Debris Erupted Prior to Basalt Eruption
[The following comparison of North and South Massif regoliths is after Schmitt (2016a), submitted as an abstract for the 2016 annual meeting of the Lunar Exploration Analysis Group.]
25.1 Introduction
Mare basalt lavas partially filled the valley of Taurus-Littrow about 740 million years after the accretion of the Moon with those eruptions ending at ~3.82 Ga, as discussed previously. Like other mare basalts exposed in topographically low areas and regions of the Moon, the Taurus Littrow ilmenite basalts originated through the partial melting of the solidified lunar magma ocean (Wood et al., 1970; Smith et al., 1970) that now forms the fractionally crystallized and differentiated upper mantle. The lowest density differentiates from the magma ocean formed the ferro-anorthosite lunar crust that was continuously exposed to post-accumulation impacts, creating a mega-breccia on the order of 60 km thick. As discussed below (§26.0), the proposed very large Procellarum basin-forming impact at ~4.35 Ga (age based on Borg, et al., 2015 ages for Mg-suite rocks) caused associated overturn of the upper mantle and pressure-release partial melting of the still hot mantle cumulates. The resulting Mg-suite magmas intruded the lower crust and slowly crystallized as large plutons and dikes.
The addition of Procellarum ejecta over the crustal mega-breccia enhanced the insulating thermal blanket of pulverized impact debris, creating a downward migrating accumulation of radiogenic heat that began the additional partial melting of upper mantle cumulates and eventual production of the mare basalts.
[Until the Procellarum basin-forming impact, it is likely the residual, radiogenic heat from the decay of K, U and Th isotopes in residual liquid (UR-KREEP) from magma ocean crystallization was a significant contributor to heat accumulation beneath the lunar crust. The low lithostatic pressure regime created by Procellarum excavation, however, probably resulted in the migration of UR-KREEP-rich magma to the Procellarum region and into the lower crust, ultimately producing the KREEP chemical signature there after its excavation by the Imbrium and other post-Procellarum basin-forming events.]
Preceding the production of basalt magmas, however, there would have been a release of any volatiles remaining from the parent magma oceans. The vesicular nature of many of the ilmenite basalt samples returned from Taurus-Littrow (Chapter 10, Schmitt, 2024a; Meyer, 2012) document that volatile components evolved along with basalt magmas. On the other hand, these remaining volatiles probably came out of solution in the magma as it moved upward to lower lithostatic pressures; but the vesicles still confirm that volatiles inherently were present in the upper mantle source rocks at the time of partial melting.
The initially released very low-density volatiles would have moved rapidly and violently upward through the mantle and broken crust. The absence of non-basalt, crustal rock inclusions in returned mare basalt samples, as well as their visual absence in large boulders of basalts, indicate that such volatile-rich eruptions cleared crustal debris from conduits in the highly fragmented lunar crust that were subsequently followed by mare basalt lava. That crustal debris removed by the volatile-rich eruptions would have consisted of Ca-plagioclase from the anorthositic crust and orthopyroxene, clinopyroxene, olivine and additional plagioclase from broken Mg-suite plutons and dikes.
25.2 Presence of Lithoclastic Debris in North Massif Slope Regolith
Evidence of pre-mare lithoclastic eruptive events would exist on large geological surfaces that were not buried by basalt. “Kilogram” rake samples of regolith, 76500 and 72500, were obtained from the slopes of the North and South Massifs at Stations 6 and Station 2 (Fig. 13.60↓), respectively. These samples provide (1) an example of North Massif slope regolith that all observational and image evidence indicate has been accumulating since the Serenitatis basin-forming impact at ~3.865 Ga (Schmitt et al., 2017); and (2) an example of South Massif slope regolith that only has accumulated since being cleared by multiple avalanches (§17.0) over at least the last 37-47 Myr. Boulders observed and sampled at the base of the two massifs indicated that the underlying bedrock of both consist largely of similar impact melt breccias so the South Massif slope regolith can serve as a control on the amount of exotic, non-melt breccia material that may be included in the North Massif slope regolith.
 Fig. 13.60. Context of potential lithoclastic debris in North Massif slope regolith. (NASA LRO image.)
Table 13.37 shows the contrast in the particle makeup of North Massif regolith 76500 and post-avalanches South Massif regolith, using the particle analysis (90-150 μm) of Heiken and McKay (1974). The amount of potential lithoclastic debris shown is, of course, a minimum amount, as some lithoclastic debris has been incorporated into agglutinates; however, the following is apparent from Table 13.37:
- Whereas, impact breccia particles dominate the non-agglutinate component of the South Massif regolith, combined plagioclase, clinopyroxene and orthopyroxene mineral fragments dominate the non-agglutinate component of the North Massif regolith (highlighted in red in Table 13.37). The absence of a difference in olivine content between the two samples may indicate that the changing pressure-temperature conditions during lithoclastic eruption converts olivine to clinopyrocene.
- Regoliths on the two massif slopes have approximately the same agglutinate concentration, although maturity indexes differ significantly, that is, 58 and 81, respectively, for 76500 and 72500, due to a factor of 2 higher U+Th content in 72500.
Although a direct comparison of different particle analyses of the two regoliths is difficult due to different particle definitions and size classifications, the work of Simon et al. (1981) largely confirms the above conclusions. Particle size-frequency analysis (Graf, 1993) also indicates a major difference between North and South Massif regoliths, with South Massif regolith showing a bell-shaped distribution, peaking smoothly at ~60 μm whereas, North Massif regolith has as highly asymmetric distribution, peaking at ~25 μm. The concentration of North Massif regolith particles at a much finer grain-size may reflect particle sorting of the lithoclastic debris in volatile-rich eruptive conduits. Data on mineral grain compositions (Simon et al., 1981) appear consistent with a portion of North Massif regolith having been derived from a different source than that contributing to South Massif regolith. This different source may have been primary ferran- anorthositic crust containing Mg-suite plutons.
25.3 Summary
If volatile-rich, lithoclastic volcanic eruptions preceded mare basalt eruptions, comparison of North Massif regolith with post-avalanche South Massif regolith suggests that the deposited debris on the massifs was mineral fragment-rich rather than impact breccia-rich. This contrast in apparent sources of regolith material can be explained by incorporation of fine debris in the ferran-anothositic crust’s mega-regolith through which the eruptive material passed. This crust apparently also includes extensive Mg-Suite intrusions. Formation of the mega-regolith largely by impact shock induced mechanical comminution would produce fine lithoclastic debris of the type indicated by this analysis. Potentially, similar lithoclastic materials may comprise some areas of the light-colored, smooth Caley Formation (Wilhelms, 1987) in many regions identified by lunar photogeological mappers.
26.0 Volatile Concentrations in Bulk Regolith vs. Regolith Breccias
Schmitt (2006) and Meyer (2012) concluded that data reported for Apollo 11 samples indicated that regolith breccias are characteristically richer in solar wind volatiles than an area’s associated bulk regolith. Regolith breccias are rare in the Apollo 17 sample suite, even in rake samples. It may be that the much higher ash content of Taurus-Littrow regolith reduces the formation of breccias associated with impacts, so this hypothesis cannot be tested by this synthesis. The conclusion of regolith enrichment in volatiles can be tested, however, against the large suite of basalt- and massif-derived regolith breccia samples and bulk regolith retuned by the Apollo 15 mission.
Regolith breccias are formed by impact lithification (turn to rock) of bulk regolith by the shock and heat of meteor impacts. Such impacts include the generation of melted regolith that generally forms an enclosing matrix that constitutes 50 ± 10 modal% of regolith breccia samples (Simon et al., 1984). Separate impact melt also is present as veins and coatings in and on some samples. Additionally, in several of the above sections (see §4.0), it has been shown that the “Is,” ferromagnetic component of Is/FeO values is partially to largely reset by impact related shock and heat. The conclusion in this regard is supported by the detailed comparison of Is/FeO values reported by Morris (1976) and Morris et al. (1978, 1979) as follows:
- in the half-cm logging of the raw data recorded by Morris (pers. comm.) and Morris et al. (1979) for the Apollo 17 deep drill core;
- in regolith samples at relatively young Shorty (3 Myr) and Van Serg (<1 Myr) Craters; and
- with comic ray exposure ages vs. Is/FeO calculated impact ages of large craters.
Data for bulk regolith and regolith breccias from Apollo 15 show large variations between both 4He and Is/FeO values for Apollo 15 regolith breccias reported by McKay, et al. (1989) and those values for bulk regolith reported by Becker and Clayton (1975), Bogard and Nyquist (1973), Bogard et al. (1973), Frick et al. (1987), Heymann and Yaniv (1970), Heyman et al. (1972), Kirsten et al. (1973), and Morris (1978).
Fig. 13.61↓ is a plot of reported 4He contents versus Is/FeO values for regolith breccia and bulk regolith samples from Apollo 15. The follow conclusions appear warranted from the trend of data shown:
- Bulk regolith 4He content as well as Is/FeO values are generally higher than those in regolith breccias for both basalt and massif dominated materials.
- The concentration of volatiles in vesicles in agglutinates, other impact melt, and matrix glasses of regolith breccias reported by Noble et al. (2003) and others (Cymes, et al. 2022a, 2022b) appears to take place in spite of the overall loss of helium during lithification.
- The trend of data plotted in Fig. 13.61 (dashed line) does not directly support the original hypothesis that “loosely held helium” in bulk regolith was lost due to agitation by scoop sampling and further handling prior to Apollo sample analysis.
- Although there is a clearly identifiable trend in Fig. 13.61 (dashed line), the large scatter of points outside that trend may be the result of any one of several possibilities:
- The processes of Is/FeO reset and 4He liberation during impact varies with the kinetic energy of the impactor, the original values of these variables in the target regolith, the melting point of the target regolith, or all three of these factors.
- The scatter may represent errors in the precision of Is/FeO (5% as stated by Morris, 1976) and 4He analyses (error limits unreported). Consistent results in the preceding synthesis of Apollo 17 data, however, suggests that the Is/FeO error limit is 2% or less.
- The original post-sampling/pre-analysis agitation hypothesis may be partially correct with variable losses of 4He producing the scatter. NOTE: Recent review of videos of LRV dynamics suggests that some very fine dust “hangs” briefly behind the moving LRV rather than following expected parabolic trajectories. If true, this suggests that some volatiles are being released that temporarily impede the flight of the smallest dust particles.
- As yet unidentified factors.
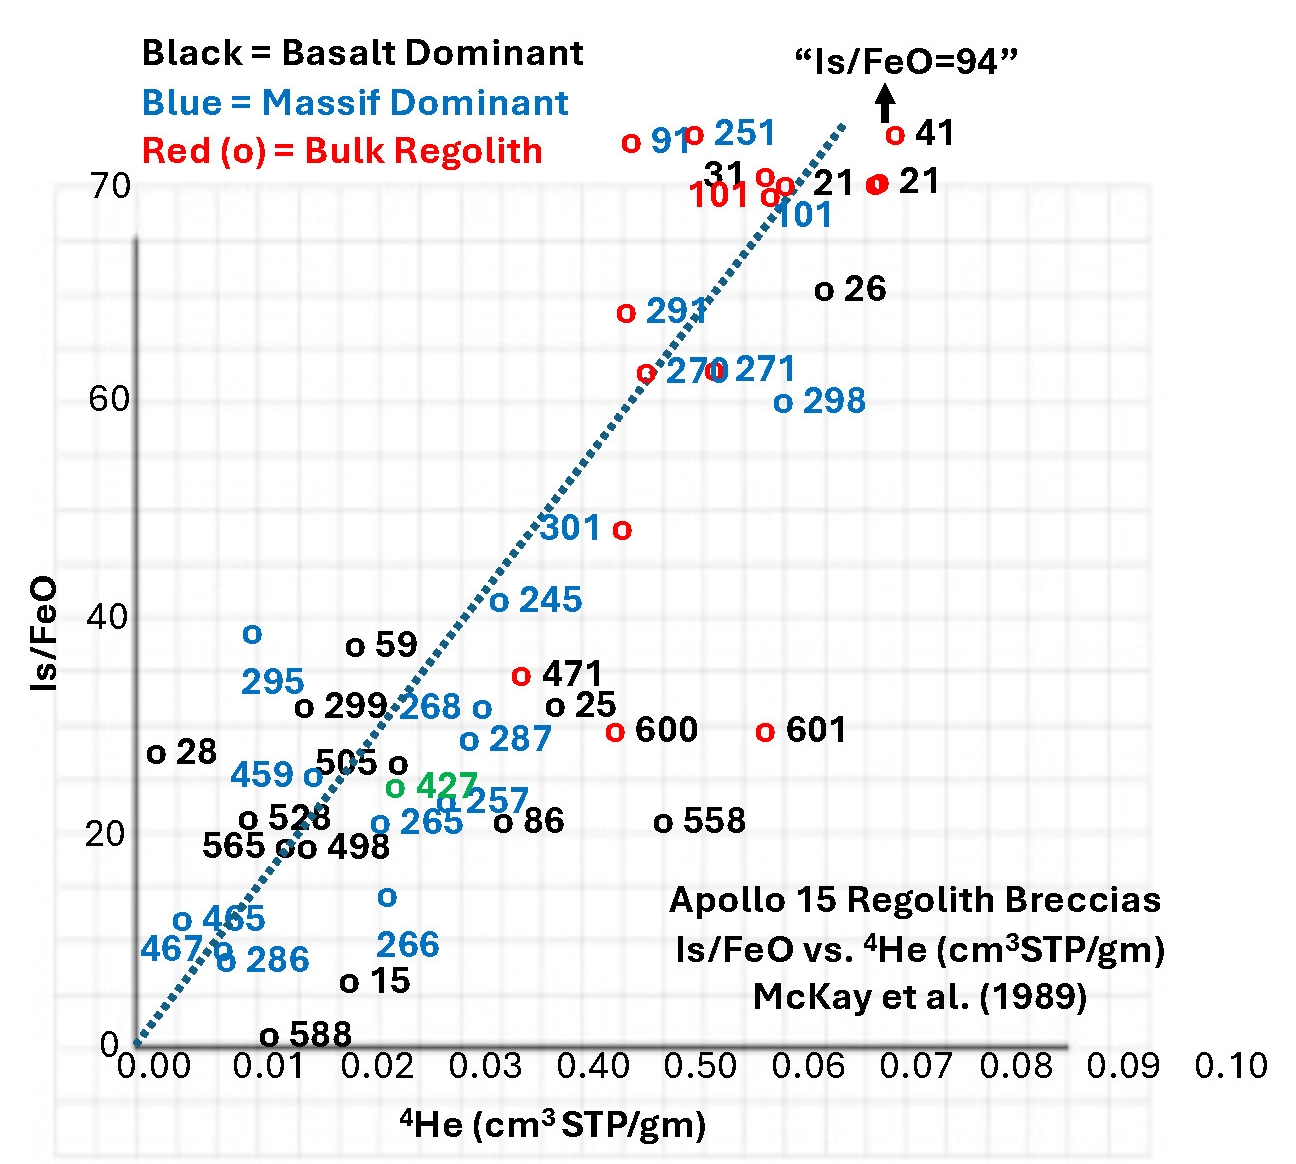 Fig. 13.61. Plot of 4He vs. Is/FeO for Apollo 15 bulk regolith and regolith breccia samples. (Sample numbers are the end numerals of the form “15xxx”. McKay et al., 1989).
27.0 Symplectites in Dunite 72415 and Troctolite 76535
27.1 Introduction
Symplectites (worm-like intergrowths) of Cr-spinel, Ca-clinopyroxene, and Mg-orthopyroxene in two samples from the Apollo 17 collection provide strong mineralogical and textural evidence that the samples originated in the lunar mantle and have been subjected to a rapid and large reduction in pressure. These two samples, rake sample troctolite 76535 and breccia clast dunite 72415, (Chapters 12 and 11, respectively; Schmitt, 2024b, 2024c; Meyer, 2012), have been included in many reports as examples of Mg-suite rocks (Shearer et al., 2015). Dymek et al. (1975) also suggested a deep mantle origin for these two samples as is the case with Bhanot et al. (2022) for 72415.
Crushed dunite 72415 has symplectic intergrowths of Cr-spinel, Ca-clinopyroxene, and Mg-orthopyroxene. The sympletites exist (Albee et al., 1975) “as small ovoid inclusions in olivine, along relic olivine-olivine grain boundaries, and as broken fragments within the granulated matrix.” The intergrowths consist of vermicular Cr-spinel inclosed in Ca-clinopyroxene and Mg-orthopyroxene. Plagioclase and Fe-metal may or may not be visible in the intergrowths. Ca-plagioclase (anorthite) and iron metal exist as inclusions in olivine grains and along olivine-to-olivine grain boundaries. Dunite 72415 has iron isotopic ratios enriched in light iron isotopes suggesting mantle derivation (Wang et al., 2015).
Troctolite 76535 consists of 50-60% Ca-plagioclase (anorthite), about 35% Mg-olivine, and about 5% Mg-orthopyroxene and Cr-spinel, also identified as Mg-Al-chromite; (Elardo et al., 2012). Cr-spinel+Ca-pyroxene and Cr-spinel+Mg-orthopyroxene symplectites (Fig. 13.62↓), comparable to those in 72415, lie along some olivine-olivine, olivine-plagioclase, and Mg-orthopyroxene-olivine grain boundaries. Similar symplectites also exist as inclusions in olivine. The 76535 symplectites indicate that this rock had a similar history as dunite 72415; but its plagioclase content would place its original accumulation from the magma ocean later and higher in the mantle than the dunite. The 76535 orthopyroxene contains much less Ca than orthopyroxene in 72415 (Meyer, 2012) suggesting formation of the latter at higher pressure (Wood and Banno, 1973). Shearer et al. (2015) and Elardo et al. (2012) provide excellent summaries of the nature of these symplectites and previous speculation about their origin.
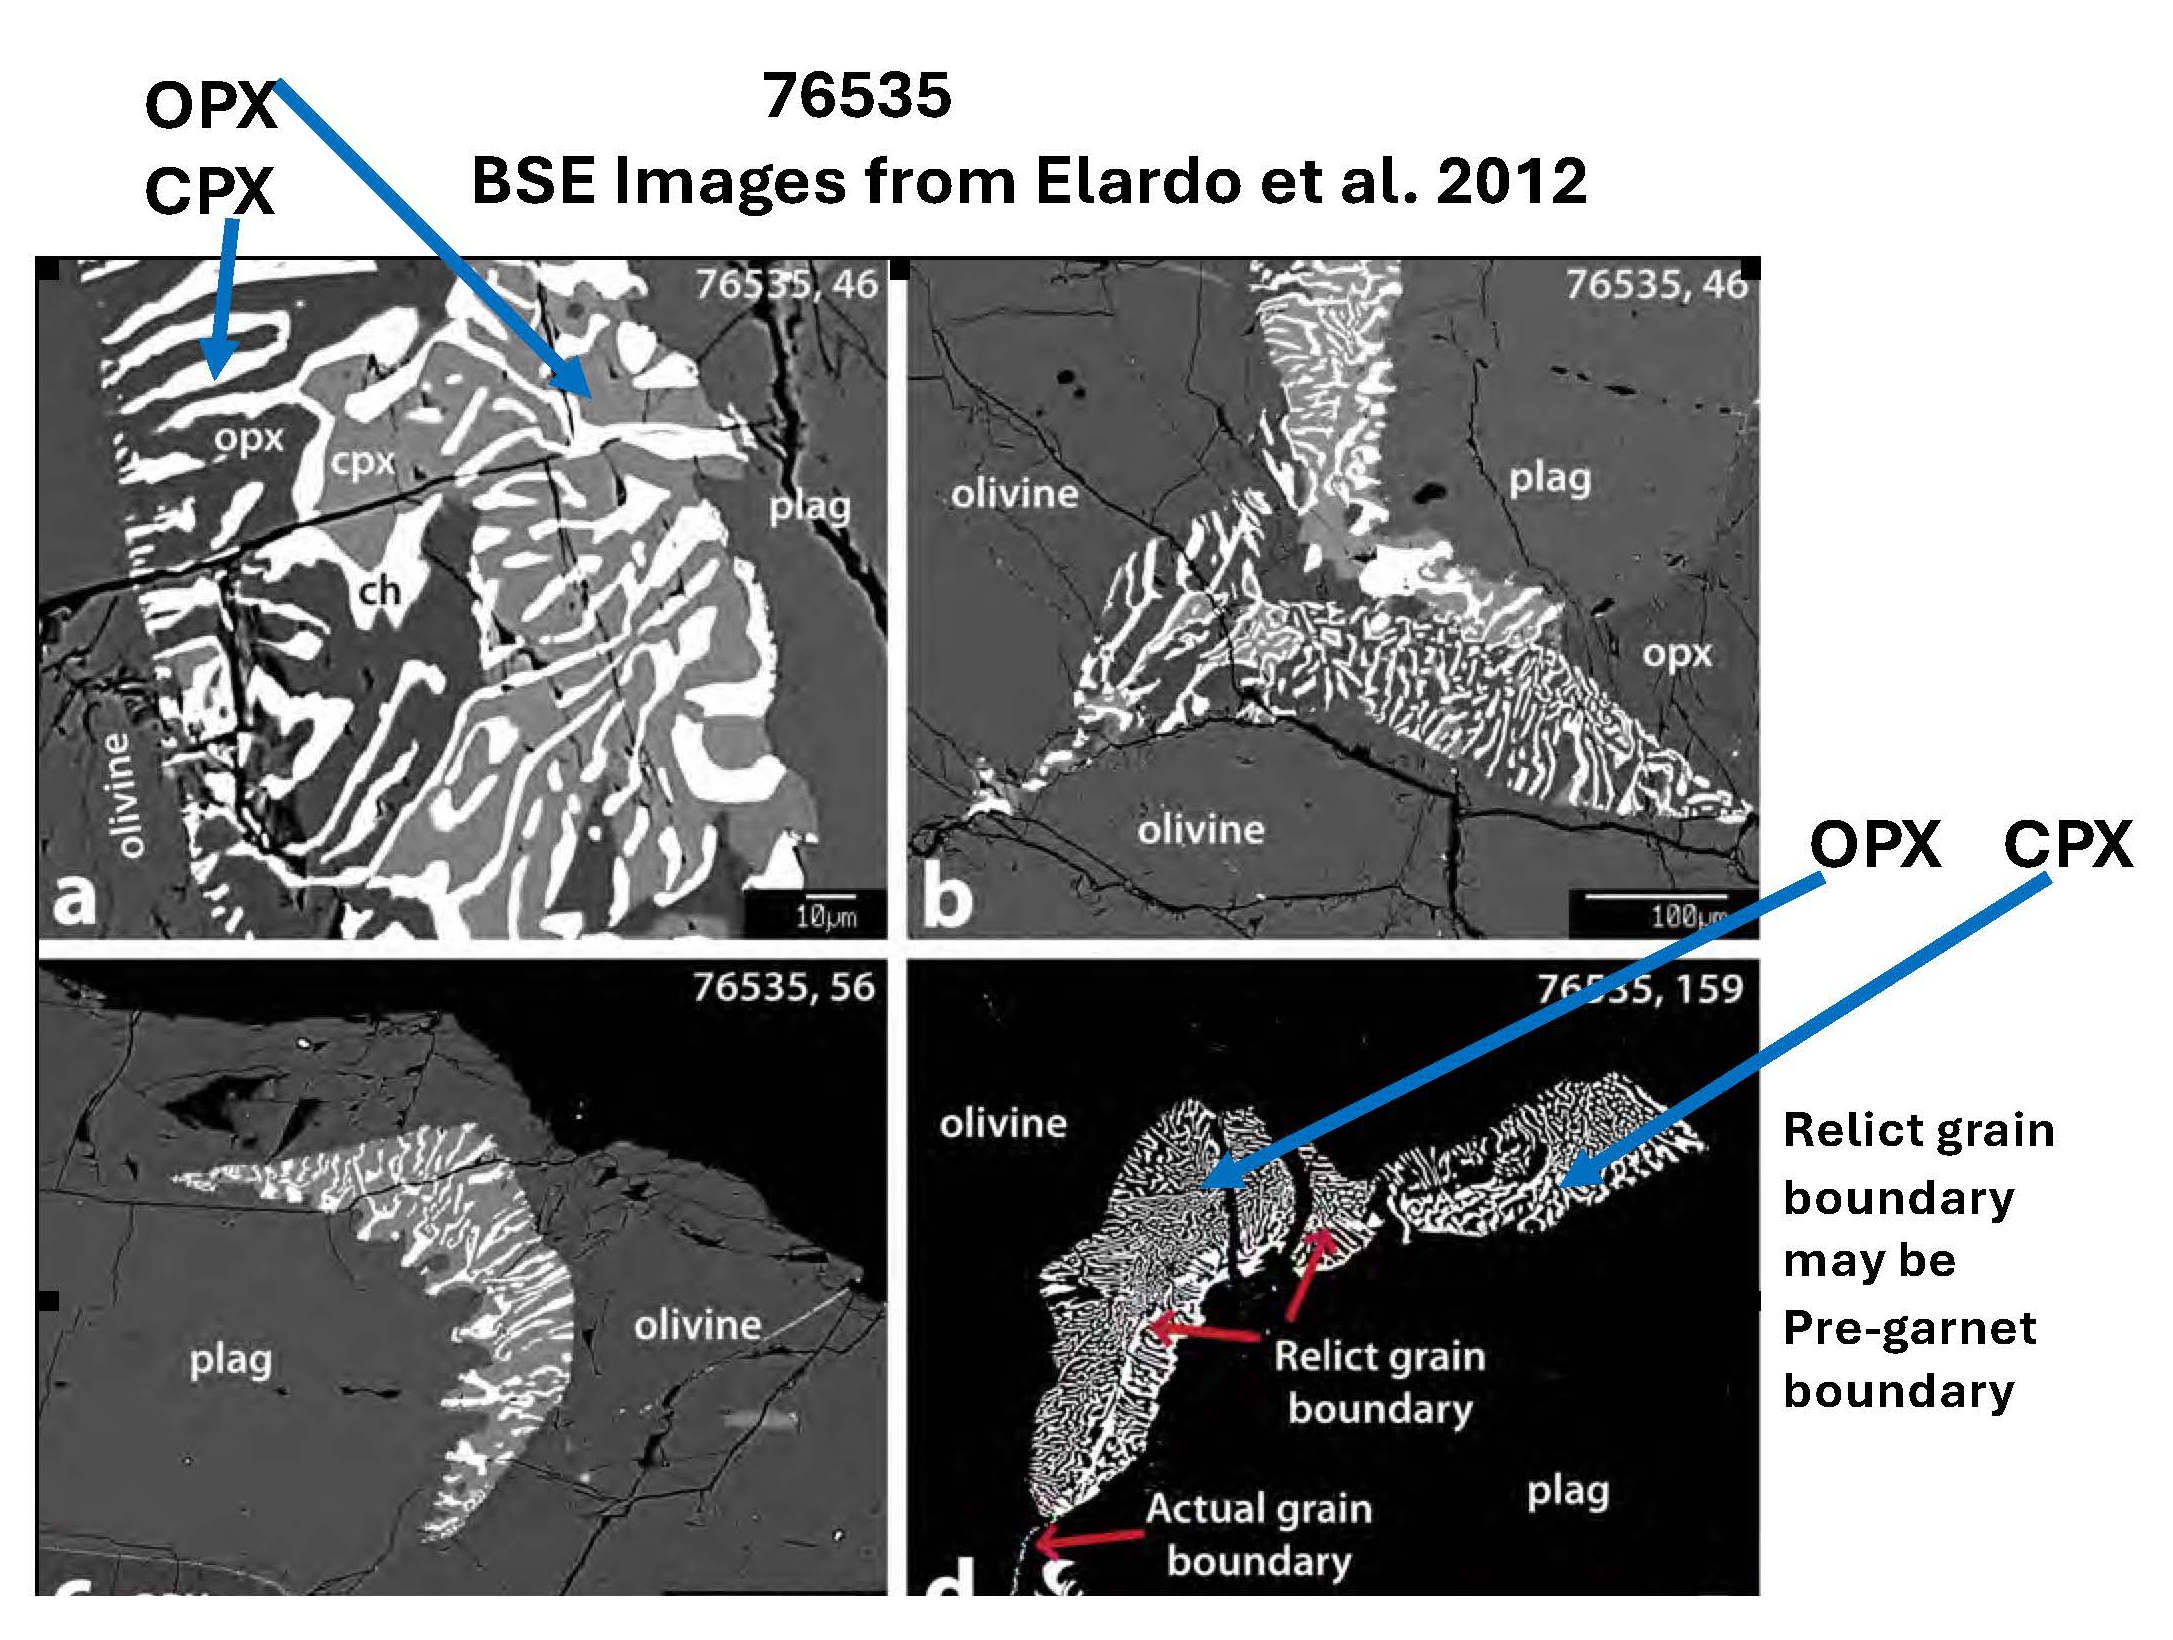 Fig. 13.62. Examples of spinel-pyroxene symplectites in troctolite 73535 (after Elardo et al., 2012).
27.2 Lunar Symplectite Petrogenesis
As originally suggested by Bell et al. (1975), symplectic Cr-spinel and Ca-clinopyroxene may indicate the breakdown of a high-pressure stabilized Ca-Mg-Cr-garnet with the release of excess SiO2, that is:
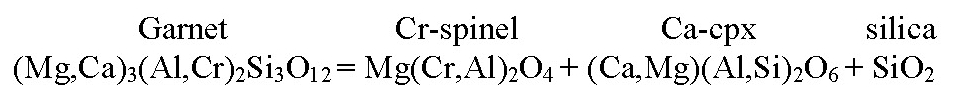
The SiO2 could react with olivine to produce orthopyroxene, that is:
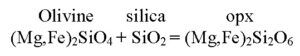
In the excellent back-scattered electron (BSE) and WDS X-ray maps (Fig. 13.62↑) published by Elardo et al. (2012), Cr-spinel is rthe two samples consideredelatively evenly distributed throughout the symplectites, whereas, areas of Ca-clinopyroxene are concentrated at contacts with plagioclase and areas of Mg-orthopyroxene tend to be concentrated at contacts with olivine. This distribution appears consistent with the reactions noted above and with likely Mg-Ca zoning within the parent garnet. Elardo et al. (2012) noted that relic grain boundaries separate fine and coarse textures within some symplectites. These workers interpret these relic grain boundaries as showing metasomatic replacement of plagioclase by the symplectites; however, the relic grain boundaries more likely indicate that Ca-rich portions of prograde Cr-rich garnet replaced plagioclase to be, in turn, replaced by the retrograde Ca-clinopyroxene and Cr-spinel portions of symplectite.
As the magma ocean depth increased and crystallization products accumulated, Cr-rich garnet may have appeared on the high-pressure liquidus of the interstitial cumulate liquid with resorption of previously crystallized plagioclase. Experimental work on simplified lunar magma ocean compositions indicates that garnet, along with olivine and orthopyroxene, probably existed on the liquidus at lower lunar mantle pressures of ~3 GPa (Longhi, 1994). Under prolonged high pressure, Cr-rich garnet might have replaced original cumulate plagioclase, Cr-spinel and olivine, as in the following reaction:
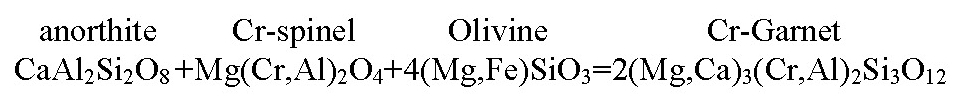
Breakdown of a high-pressure mineral assemblage may be indicative of geologically rapid transport of the Apollo 17 dunite and troctolite from high- to low-pressure regions of the lunar mantle. To form the symplectic intergrowths, the rate of retrograde pressure drop would have needed to be fast enough to prevent broad-scale recrystallization but slow enough to allow limited diffusive redistribution of high-pressure mineral components, along with some migration of excess SiO2 to react with olivine.The above interpretation of symplectites in the two samples considered here were formed through decomposition of a high-pressure Cr-rich garnet would appear consistent with lunar mantle overturn (Shearer et al., 2006) that brought olivine and troctolitic cumulates close to the lower crust. This overturn, at least on the nearside, may have been triggered by the shock and pressure-release dynamics associated with a Procellarum, continental-scale basin-forming event.
27.3 Norwegian Basal Gneiss Region Symplectite Analogs
Symplectitic textures similar to the lunar examples replace sodium-rich clinopyroxene (omphacite), biotite and hornblende, formed at high pressure (eclogite facies) in the Basal Gneiss region of western Norway (Schmitt, 1964). The symplectites replacing each of these Norwegian minerals consists of plagioclase and a low-sodium clinopyroxene. Also, coronas of fine-grained spinel+hypersthene exist between garnet and olivine in peridotitic rocks.
Symplectite formation in the Norwegian rocks required the diffusion of silica into the minerals to convert their sodium component to sodic plagioclase (jadite in the case of Na-rich clinopyroxene and Na-rich clinopyroxene-related crystal structure components in biotite and horndblende).
Subduction of the rocks in the Basal Gneiss region reached into the coesite field of SiO2 stability (Carswell et al., 2003) or about 100 km depth. These rocks then rose to the triple point depth for Al2Si05 (kyanite-silimanite-andalusite) at about 15 km during which symplectites developed in minerals exposed to a sufficiently high activity of SiO2. In this terrestrial case of symplectite formation due to pressure release, age data indicates the affected minerals rose from about 100 km depth (~3 GPa) to about 15 km depth (~0.4 GPa) in 10-15 million years (Schmitt, 2013). In the lunar case, transport of the dunite and troctolite cumulates may have been from between 550 and 400 kilometers, i.e., 2.7-2.3 GPa, (550 km) being the probable base of the lunar magma ocean (Kahn et al., 2000, 2013). The rise to about 50 km, i.e., ~0.23 GPa would have occurred in a similar time frame.
[The lunar lithostatic pressure calculation is based on an average lunar mantle density of 3300 kg/m3 and gravity at 1.6 m/sec2 to give a lithostatic pressure gradient of about 5.3 MPa/km. Above 50 km, the crustal density was assumed to be 3000 kg/m3.]
A post-overturn depth of about 50 km is consistent with the McCallum and Schwartz (2001) estimate of 40-50 km based on an apparent five phase equilibrium in 76535 between olivine, plagioclase and the three phases included in the symplectite. McCallum and Schwartz (2001) and Elardo et al., (2012) determined the clinopyroxene-orthopyroxene annealing temperatures to be 800-900ºC for this assemblage. A major unknown in both cases consists of the activity of water within the host rocks that would aid in intra- and inter-grain transport of SiO2 and potentially other components. The presence of stable hydrous silicate minerals (biotite, hornblende) in the terrestrial case, and of no hydrous minerals (but water in inclusions in pyroclastic ash in the lunar case (Hauri et al., 2011)) indicates that water activity in both cases was low but not zero.
27.4 Procellarum Basin-forming Impact
There is a general lunar community consensus that the South Pole-Aiken Basin (~2500 km diameter) is the oldest large basin formed on the Moon. There are a number of lines of evidence, however, that suggest that the Procellarum Basin (Wilhelms, 1987) is older than South Pole-Aiken, as well as much larger at a ~3200 km diameter (Fig. 13.63↓). In addition to the existence of the symplectites and ~4.35 Ga ages for Mg-suite samples discussed above, the following should be considered:
- The Procellarum Basin includes the thinnest area of lunar crust (Wieczorek et al., 2012).
- The thickest area of lunar crust lies to the west (Wieczorek et al., 2012) where basin-forming ejecta may have accumulated along with that of the younger South Pole-Aitken basin ejecta.
- Lack of a central basin mass concentration (mascon) indicates post-impact isostatic adjustment before strengthening of the crust and mantle by the final crystallization of residual liquid from the magma ocean.
- A rectangular pattern of high-density, apparent dikes detected by the GRAIL gravity satellite system (Zuber et al., 2013) roughly coincides with the approximately circular potential boundary of the original basin (Fig. 13.64↓).
- The basin incorporates a concentration of KREEP-related materials (Warran and Watson, 1979), probably excavated by the Imbrium impact, but probably originally the result of the migration of residual magma ocean liquids (urKREEP), concentrated at the base of the crust, to the initially low lithostatic pressure region created by the Procellarum-related excavation of lunar crust.
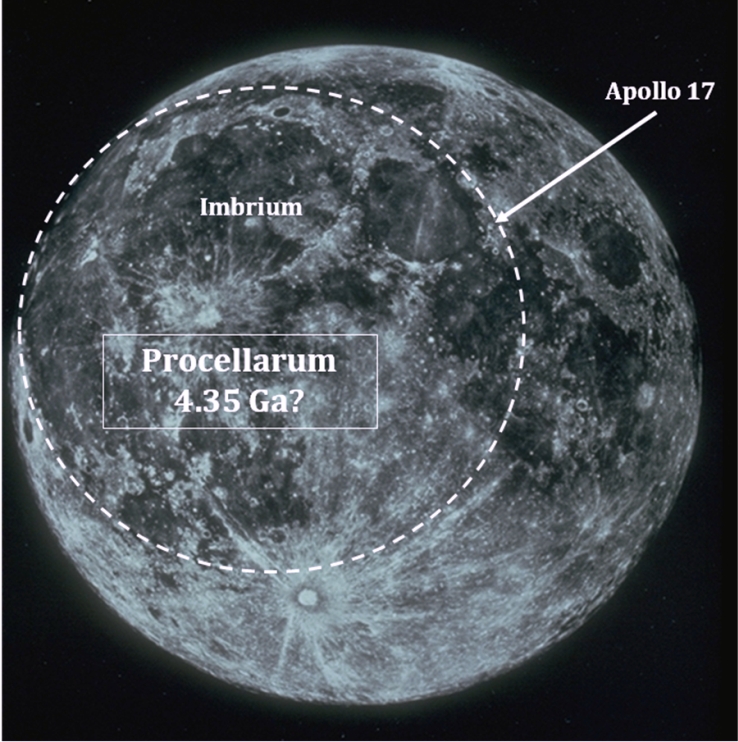 Fig. 13.63. Probable original reach of the Procellarum Basin.
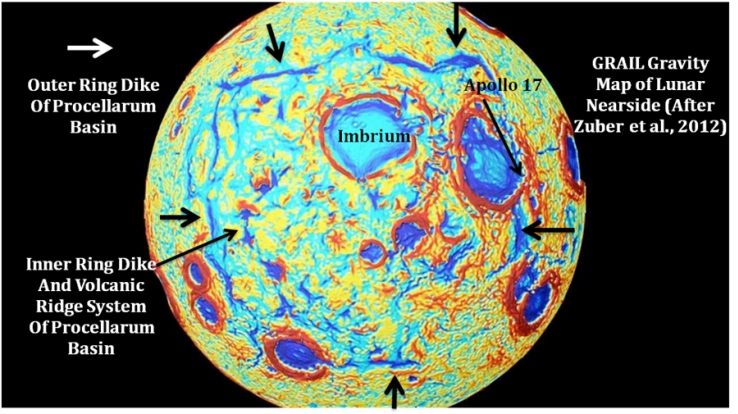 Fig. 13.64. Lunar nearside gravity variations from GRAIL data (Zuber et al., 2013).
27.5 Summary
Symplectites of Cr-spinel, Ca-clinopyroxene, and Mg-orthopyroxene in Apollo 17 troctolite 76535 and dunite 72415 support the hypothesis of overturn of magma ocean cumulates, in response to the dynamics associated with the Procellarum Basin-forming impact prior to the complete crystallization of the lunar magma ocean (Schmitt, 2016b). This conclusion is supported by the work of Bhanot et al. (2022, 2024) on sample 72415. The density instability created by the concentration of late crystallizing, ilmenite-rich cumulates near the top of the magma ocean cumulates would have contributed to the proposed overturn. Pressure release related to such an overturn triggered the retrograde decomposition of a high-pressure Cr-rich garnet present as prograde metamorphic partial coronas between plagioclase and olivine. As pressure increased in the cumulate pile at the base of an accumulating and increasingly thick magma ocean, Cr-rich garnet formed as a reaction between these minerals and local interstitial pockets of Cr, Si, Al and Fe-rich residual liquid. Additionally, the overturn process may be the trigger to subsequent pressure release re-melting of late cumulates represented by the common ~4.35 Ga crystallization age for crustal plutons. This age is reported by Borg et al. (2015) to be consistent across many ferro-anorthosite (FAN) and Mg-suite samples.
28.0 Fractional Crystallization of Station 1 Ilmenite Basalt
The rake sample at Station 1 (71500) includes 38 fragments of ilmenite basalt, 26 of which have been mineralogically and chemically analyzed (Table 13.38; Meyer, 2012).
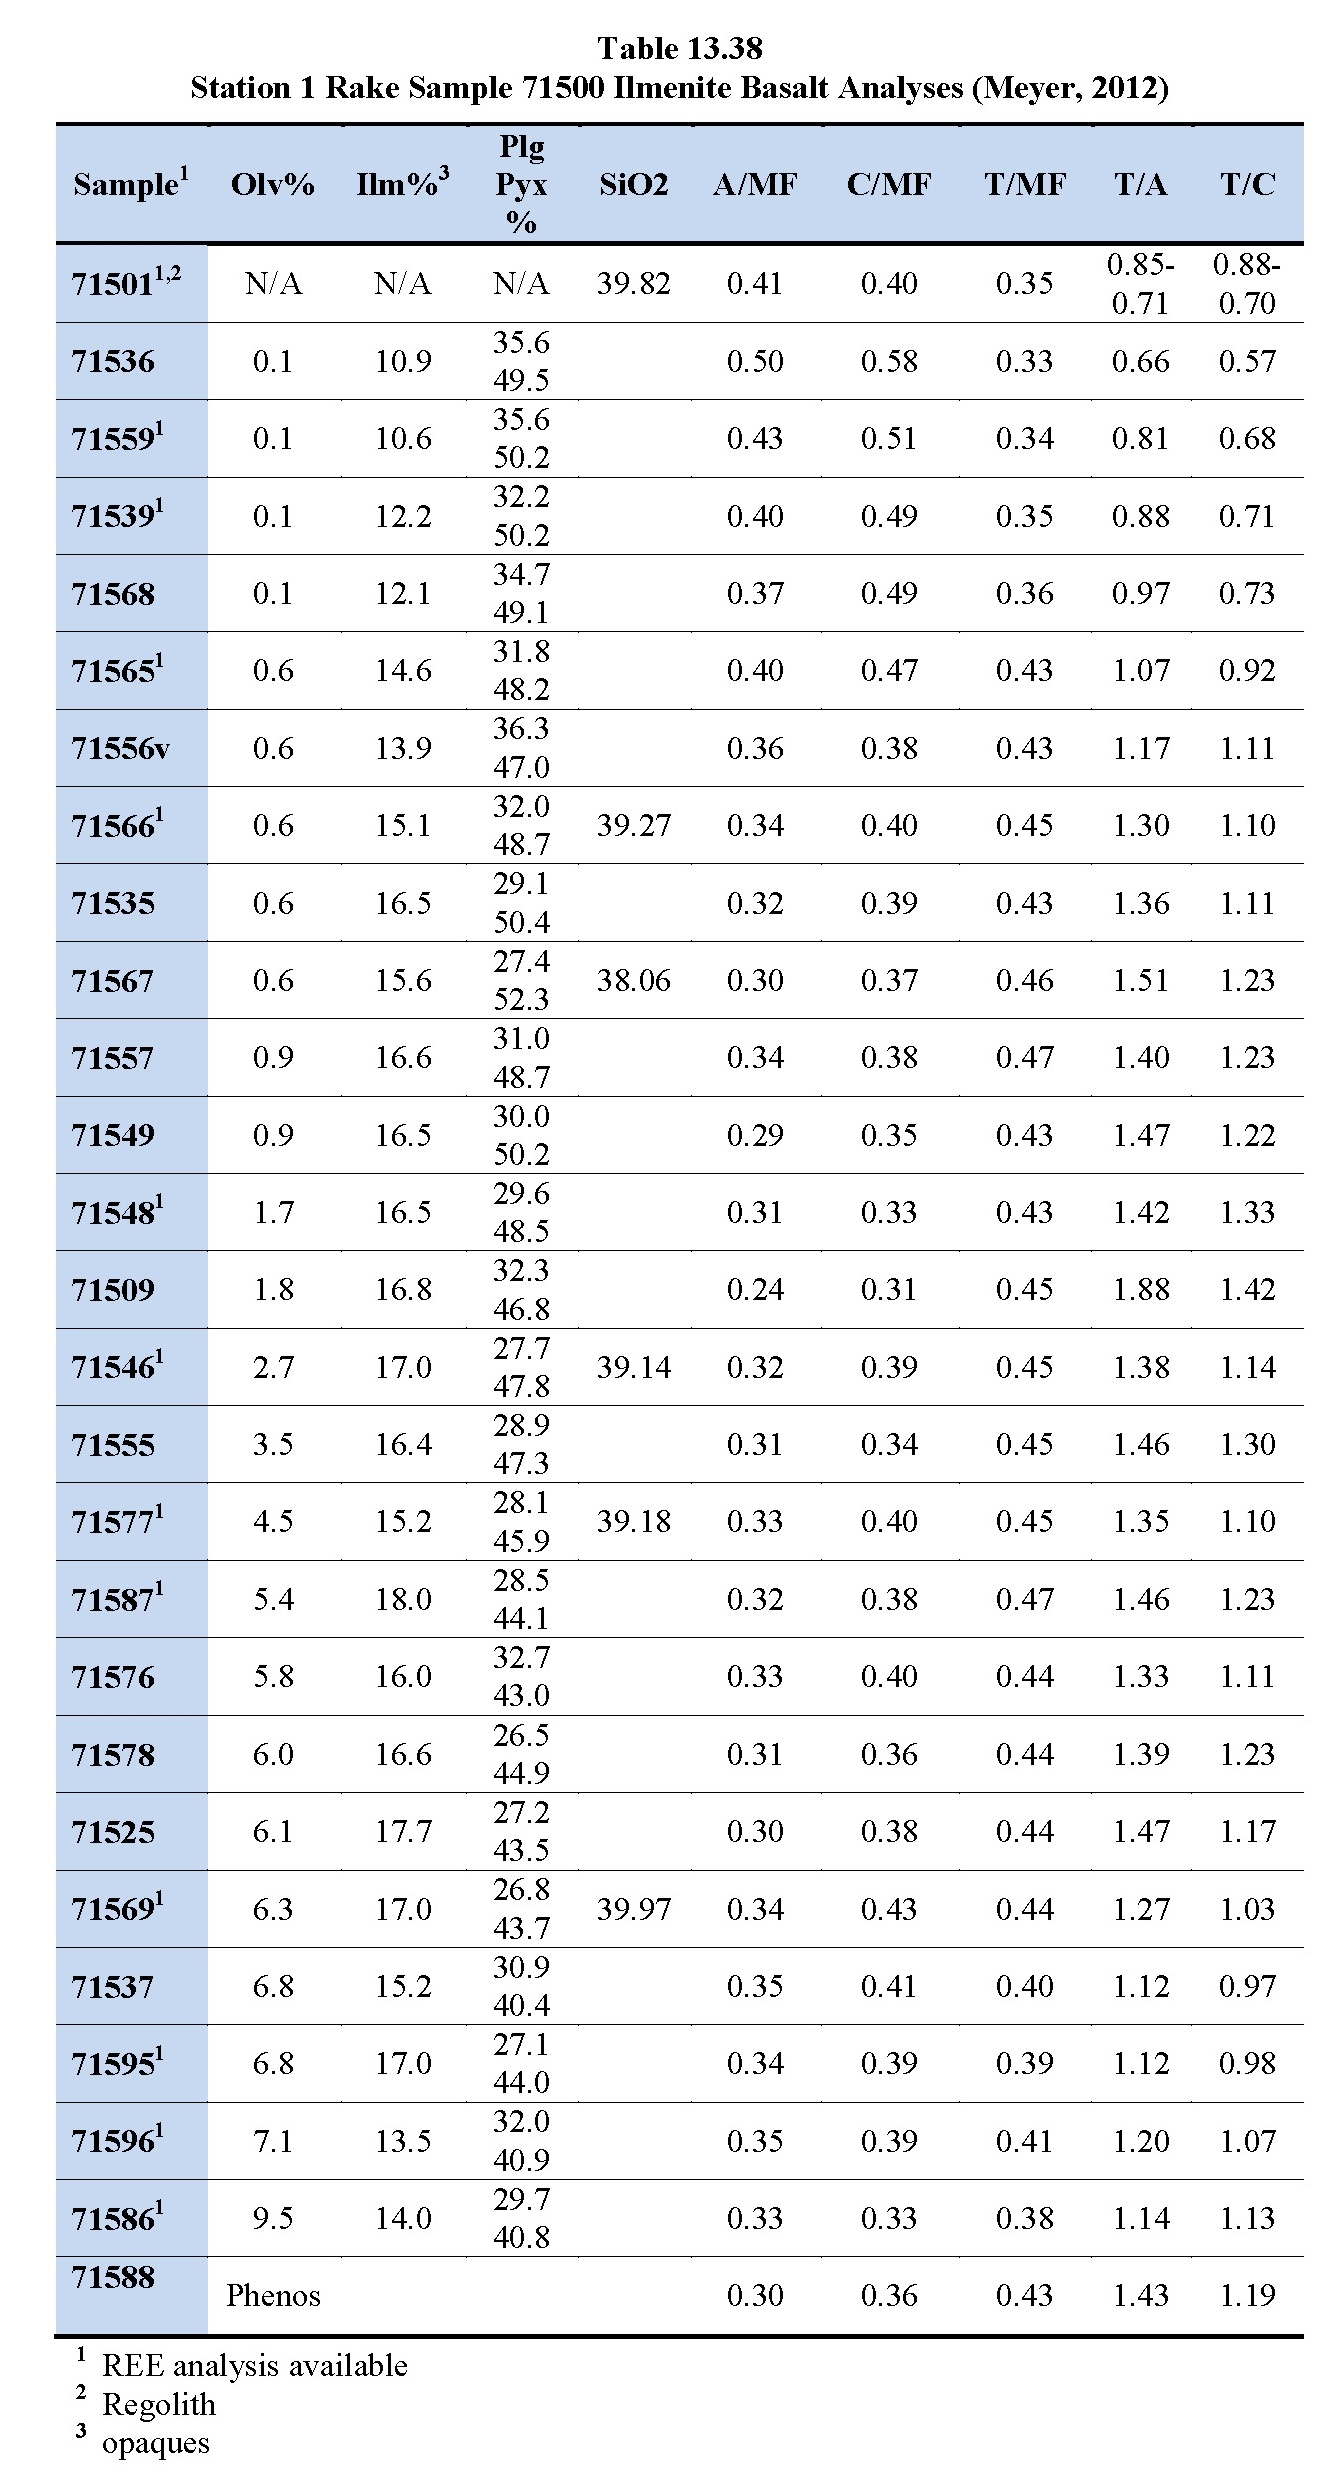
[In Table 13.38, Olv = olivine, Ilm = ilmenite, Plg = plagioclase, and Pyx = clinopyroxene and the values under columns A/MF, C/MF. T/MF, T/A, and T/C, respectively refer to wt% ratios of Al2/O3 to MgO+FeO; CaO to MgO+FeO; TiO2 to MgO+FeO; TiO2 to Al2/O3; and TiO2 to CaO. The ‘v’ after sample no. 71556 stands for ‘vuggy’.]
With the assumption that most of these rake sample fragments represent samples of a single ilmenite basalt lava flow (s.g. ~3.1) at various stages of cooling, comparisons of TiO2/Al2O3 and TiO2/CaO ratios with olivine content in the fragments (Schmitt, 2014b) (Fig. 13.65) would indicate that olivine was first to crystallize, but at ~0.5 modal%, olivine was followed by Ca-plagioclase and then, at ~1 modal% olivine, by ilmenite.
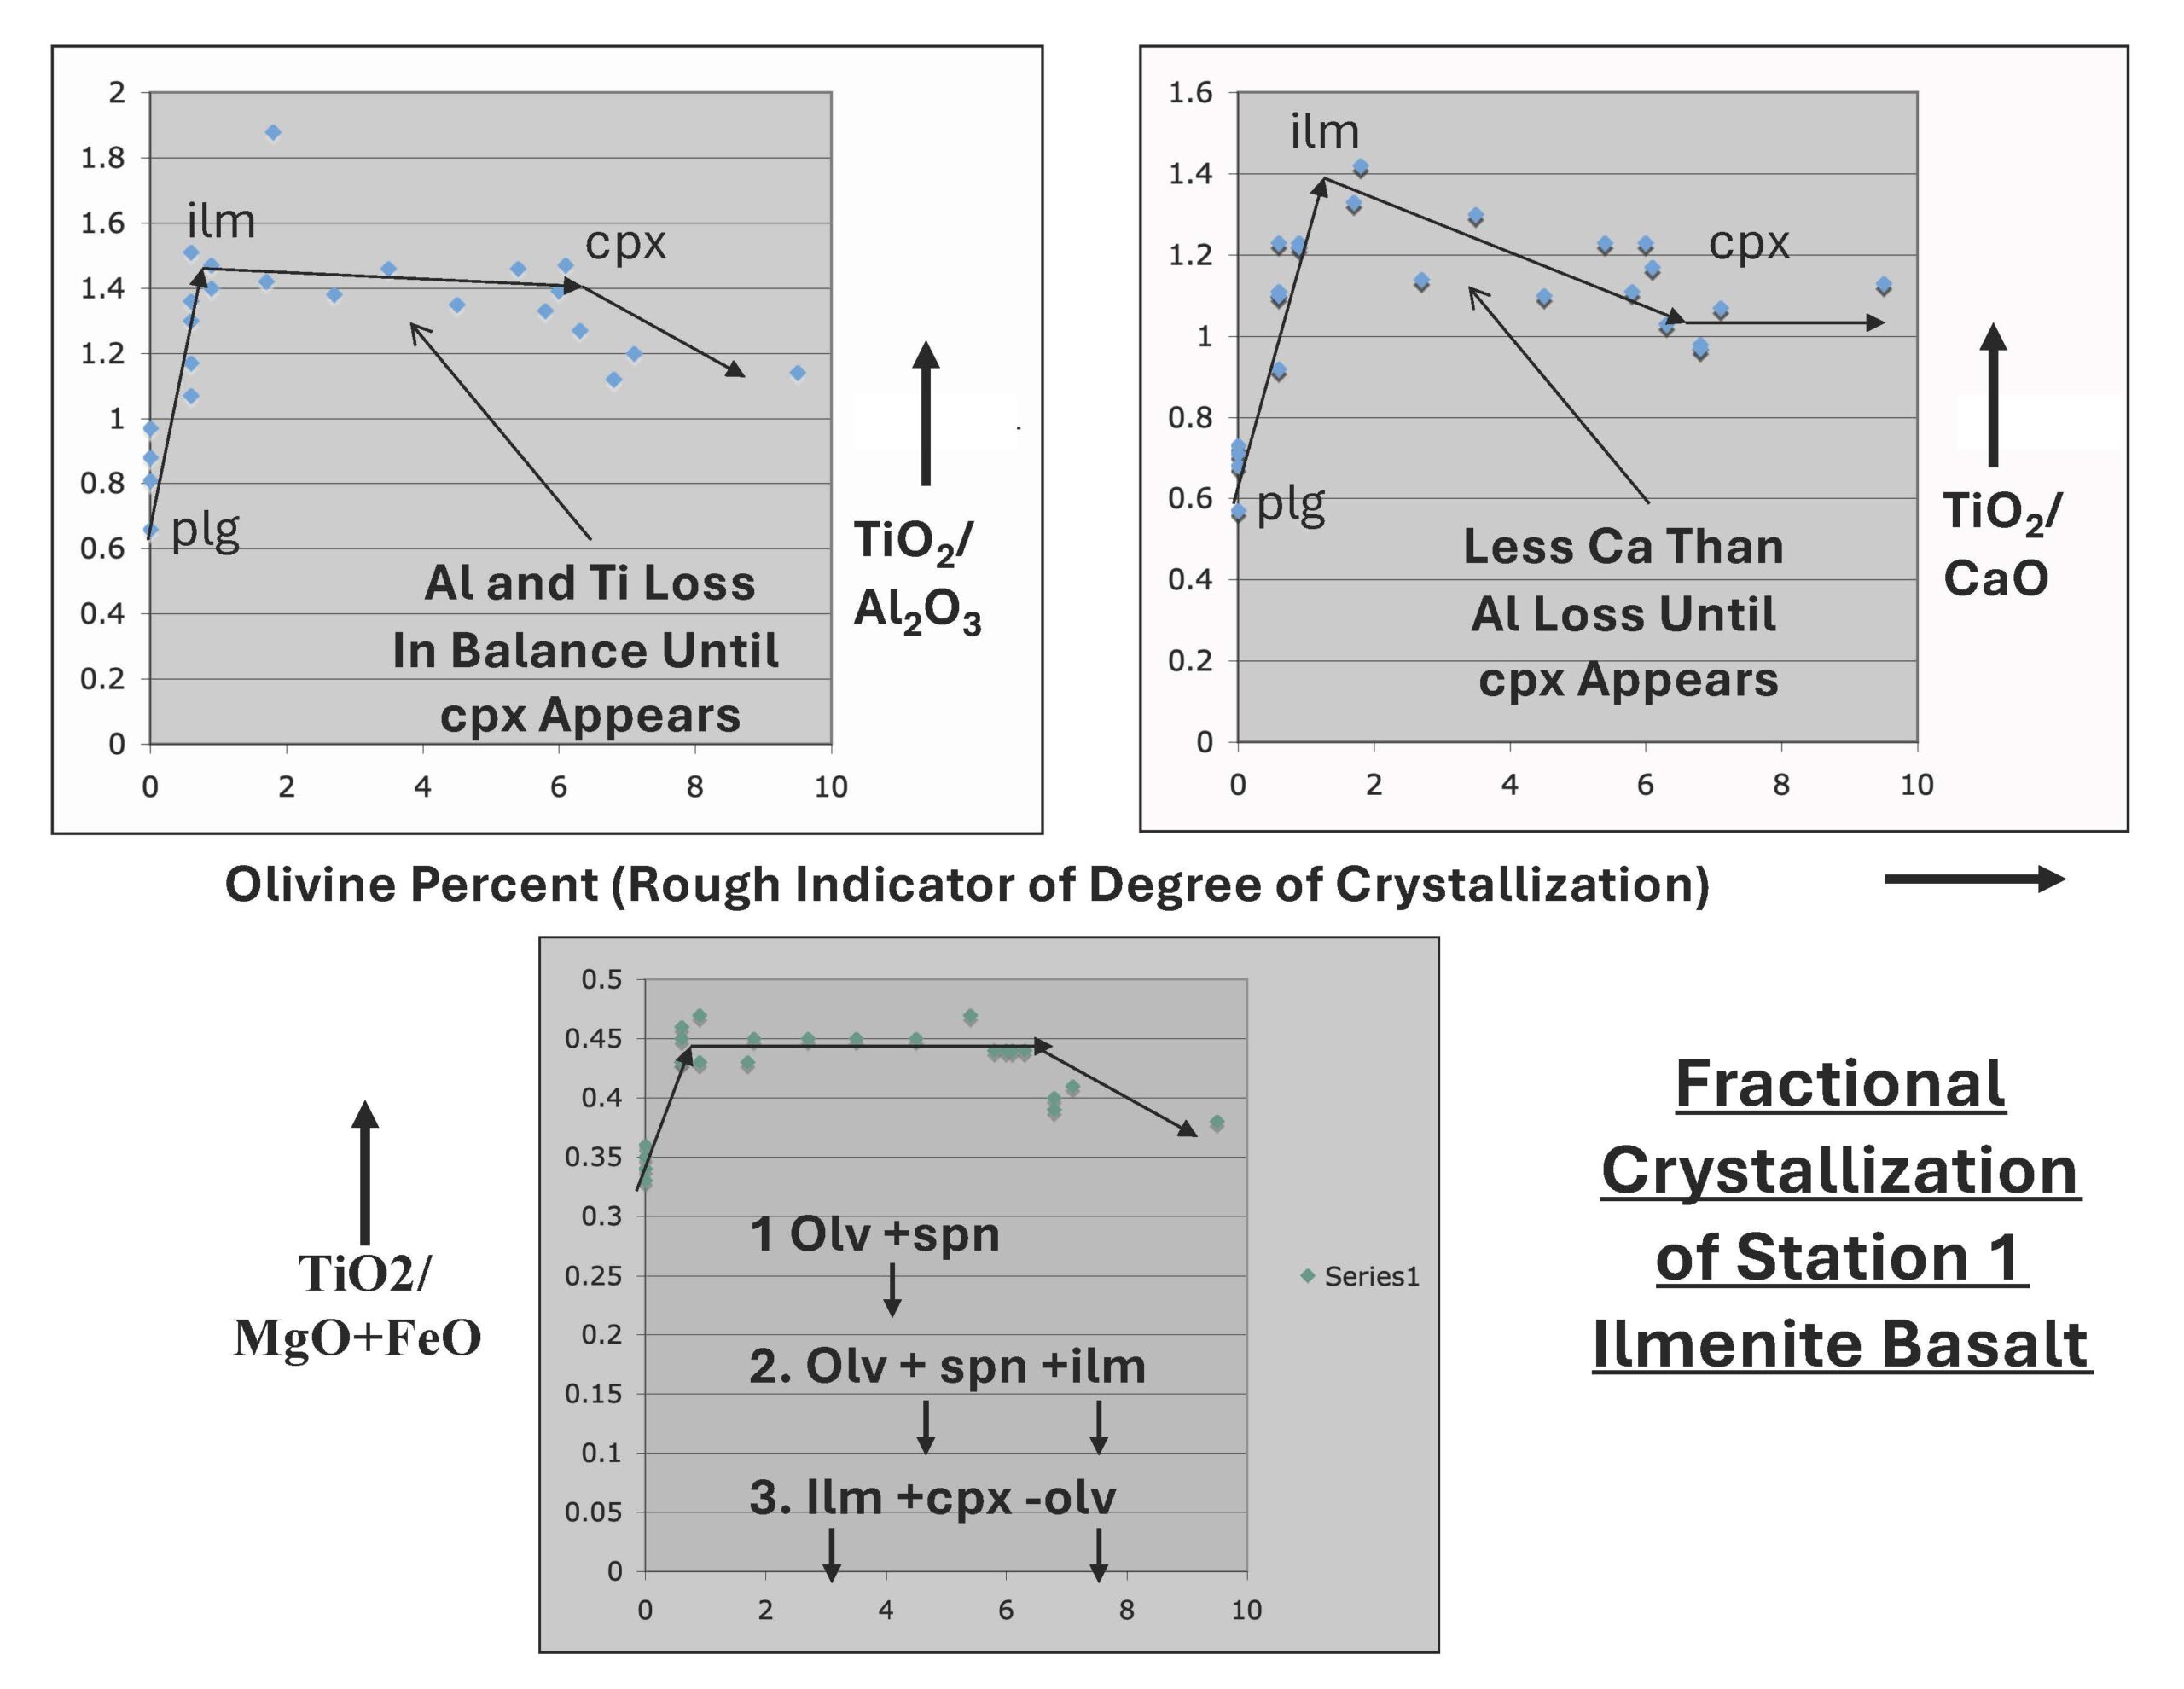 Fig. 13.65. Oxide ratio trends in relation to olivine content in ilmenite basalt samples from Station 1 rake sample 71500 (after Schmitt, 2014b). Note that olv = olivine, ilm = ilmenite, plg = plagioclase, pyx = clinopyroxene, and spn = spinel family. The small downward pointing arrows in the bottom panel indicate that the specified minerals will sink in basalt lava due to higher density but plagioclase will float.
Olivine is ubiquitous in the samples and was likely the first mineral to crystallize along with spinel. The trends in Fig. 13.65 indicate that Ca-plagioclase followed olivine with flotation of Ca-plagioclase (s.g. 2.8) nearly doubling the TiO2/Al2O and TiO2/CaO ratios in the remaining magma. The low TiO2/Al2O and TiO2/CaO ratios of 71501, the regolith component of the rake sample and largely the regolith developed on the sampled flow, are consistent with plagioclase enrichment of the top of the flow. At~6% olivine, however, removal of ilmenite (s.g. ~4.8) by sinking appears to have lowered these ratios by about 50%.
The TiO2/MgO+FeO ratios in fragments with low olivine content also increased at this early stage of melt crystallization. This suggests that olivine (s.g. 3.6) also began to leave the magma by sinking. Once ilmenite begins to crystallize, it appears that for most of the solidification period, bivariant or univariant crystalliztion prevailed, as outlined below:
- 9 Major Components: O, Si, Al, Ti, Fe, Mg, Cr, Ca, and Na.
- 6 Phases: Olivine, Spinel, Plagioclase, Ilmenite, Liquid, and Gas with Clinopyroxene replacing olivine at ~6 modal% olivine.
- 2 ? mobile components: The composition of the gas (vesicle) phase is not known; however, it is likely that complexes with hydrogen would be present.
Of the 59 analyzed ilmenite basalt samples from Taurus-Littrow, most fit the same fractionation sequence shown by the 26 from Station 1, including the 12 from Station 8 rake sample 78500 near the base of the Sculptured Hills. Two groups of samples fall outside the trends in Fig. 13.65↑; 4 high TiO2 samples and 8 low TiO2 samples.
29.0 Conclusion of the Taurus-Littrow Synthesis
The broad synthesis of field geological, sample analytical, geophysical data related to the regolith in the valley of Taurus-Littrow provides unanticipated insights into broad aspects of local, regional and global lunar history. In addition, various aspects of the history of the solar wind recorded in the regolith illuminate some of the evolutionary changes in the Sun. A similar synthesis of data from other Apollo landing sites, particularly Apollo 15 and Apollo 16 where deep drill cores were obtained, would be similarly productive.
Although not perfect, the extensive collection of regolith samples by Apollo 17, and their extensive study by numerous investigators, provide opportunities for investigation and synthesis far beyond what was expected during the planning of EVA traverses or, indeed, during the field investigations themselves. These are important lessons for the future lunar and Martian planners, explorers and those who select crews for space missions.
29.1 Findings
List of major findings:
Deep Drill Core Stratigraphy
Regolith Ejecta Excavation and Transport
Post-Deposition Modification of Regolith Ejecta Zones
Geological Sources Regolith Ejecta Zones
Maturity Index (Is/FeO)-Based Exposure Ages
Evaluation of Cosmic Ray Exposure Ages
Thickness of Taurus-Littrow Valley Regolith
Ilmenite Basalt and Orange+Black Pyroclastic Ash
Light Gray Regolith Covering Pyroclastic Ash
History of the Sun
Light Mantle Deposits
Thermoluminescence of Taurus-Littrow Regolith
Pre-Mare Lithoclastic Ash Eruptions
Procellarum Impact Induced Upper Mantle Overturn
Fractional Crystalization of Ilmenite Basalt Lava
Age of Imbrium Basin-Forming Impact- The Apollo 17, 294 cm deep drill core sample of Taurus-Littrow regolith (70001/9) is comprised of 10 complete strata or zones of regolith ejecta, ~10-50 cm thick, with distinguishable relative maturity (Morris et al., 1979), petrography (Taylor et al., 1979; Vaniman et al., 1979), and compositions (Laul et al., 1978, 1979, 1981; Silver, 1974; Meyer, 2012). (§3.2)
- Potential impact sources for the deep drill core regolith ejecta zones consist of 14, 400-800 m diameter craters of different relative ages (Lunar QuickMap) (including groups of 4 and 2 simultaneous impacts), with one crater, the largest and youngest, being 1451 m in diameter. (§3.4)
- Is/FeO values and impact-produced agglutinates in regolith accumulate at a ratio of Is/FeO / agglutinate = 4.96 ± ~1.7. (§3.2.1)
- Reported 39-40Ar ages (old 40K decay constant) for early crystallized armalcolite-ilmenite intergrowths, respectively, indicate that the last eruptions of ilmenite basalt in Taurus-Littrow occurred at ~ 3.82 Ga. (§3.3)
Regolith Ejecta Excavation and Transport
- Due to the great geotechnical contrasts between regolith and bedrock, most regolith down to bedrock is separately excavated before bedrock by impacts that produce the 400-800 m diameter crater sizes comprising all but one of the deep drill core zones’ source craters. (§3.3)
- Initial transfer of the impactor’s kinetic energy is responsible for the multi-kilometer transport of source regolith ejecta, whereas, slightly delayed release of impactor potential energy excavates bedrock materials and their ejection to within about one crater diameter. (§3.3)
- Ballistic and volatile turbulence within a given regolith ejecta’s parabolic arch results in general homogenization of the previously variable compositions of the fines in source regolith’s ejecta zones and of their maturity indices, petrographic characteristics, and cosmic ray spallation isotopes. (§3.3, §5.0)
- Regolith ejected from 400-800 m diameter and larger source craters forms a parabolic sheath (§3.3) from which there is continuous deposition at the trailing edge that reaches a maximum depth (40-50 cm) at ~2.8 km from the rim of a given source crater. (§3.4.3)
- Source craters for deep drill core regolith ejecta zones can be identified by a combination of (1) relative age (diameter to depth ratios) as compared with the relative stratigraphic age in the drill core, (2) thickness of a regolith ejecta zone vs. distance to the rim of a potential source crater, and (3) verification that zone composition is consistent with regolith probably present on the impacted geological unit or units. (§3.4 and §5.0)
- Sharp decreases in maturity indices (Is/FeO) in the deep drill core over a half-cm (raw data from R. Morris, pers. comm.) followed by increases over several cm indicate that, during surface exposure of each defined zone, (1) local impact induced partial resets of the “Is” component of Is/FeO occur and (2), a measurable, continuous increase of Is/FeO (∆Is/FeO) follows. (§4.2)
- Impact shock partially resets Is/FeO values of regolith ejecta, with the amount of reset ranging from a few percent to over 90 percent but varying with the energy of the impact (crater size). (§4.2, §11.2, §13.2)
- Is/FeO data from regolith ejecta samples obtained at and near the rims of Shorty and Van Serg Craters complement evidence of impact reset of “Is”, as does the comparison of ∆Is/FeO-based exposure ages with reported cosmic ray exposure ages (Eberhardt et al., 1974). (§11.2 and §13.3)
- Fragments of a comet likely simultaneously formed four elliptical craters in the Crater Cluster that are source craters for a deep drill core zone (zone U), and for which regolith from the succeeding zone from the Cluster area (zone T) has anomalous trace element compositions. (§4.3 and §5.0). Zone U also has a reversed ∆Is/FeO and Is/FeO reset pattern in which the total value of ∆Is/FeO is significantly less than the total value of Is/FeO resets, suggesting a long duration of periodic high-energy impacts from a comet’s debris tail. (§3.4 and §5.0)
Post-Deposition Modification of Regolith Ejecta Zones
- Measured total maturity indices (Is/FeO) for transported and re-deposited regolith ejecta, now constituting the regolith ejecta zones of the deep drill core, include maturation and impact reset effects before transport and turbulent mixing during transport, as well as those accumulated during surface exposure and gardening after deposition. (§3.3, §4.0 and §6.4.2)
- The detailed raw maturity data from the Apollo 17 deep drill core (R. Morris, pers. comm.), logged in half-cm increments, indicate that regolith ejecta deposition, small-scale impact gardening, external solar proton and internal alpha+beta radiation processes, and cosmic ray spallation are the primary contributors to the three-dimensional structure and maturity of inter-crater regolith. (§4.0)
- The accumulated post-deposition Is/FeO increases (∆Is/FeO) in a given deep drill core regolith ejecta zone, logged every half-cm, is a relative measure of the amount of post-deposition exposure experienced by the zone before burial by the next regolith ejecta zone. (§4.0)
- Over several tens of Myr (§6.0), the impact gardening of each inter-crater regolith ejecta deposit results in the reorganization of the deposit’s Is/FeO structure from being initially uniform structure, due to ballistic and volatile turbulence during transport, to being finely layered on about a half-cm depth scale and on about a few meters lateral scale. (§4.0)
- Half-centimeter logging of the deep drill core raw Is/FeO data (R. Morris, pers. comm.) indicates that local impact shock partially resets Is/FeO values while regolith ejecta zones are exposed at the lunar surface. (§4.2)
- Small impacts close enough to cause partial Is/FeO resets at the deep drill core site have an average frequency of about one every 5.8 Myr. (§9.1)
- Half-centimeter logging of the deep drill core raw Is/FeO data (R. Morris, pers. comm.) gives the pre-burial ∆Is/FeO of each regolith ejecta zone through the summing of Is/FeO values that follow each impact reset. (§4.3)
- Nano-phase iron that contributes to Is/FeO values results largely from the reduction of crystalline Fe++ by alpha and beta particles produced by uranium and thorium radio-isotopic decay and less so by solar protons. (§6.3)
- As long as impact gardening continues to bring alpha and beta emitters within 20–30 µ of Fe++ ions, reduction of Fe++ to nano-phase iron is maintained; however, once a zone is removed from the gardening environment by burial, this process rapidly ceases as the availability of Fe++ within range of static alpha and beta emitters decreases to zero. (§6.3.2)
- Glass in pyroclastic ash and partially devitrified ash largely prevents reduction of Fe++ because of the effective separation of Fe++ from alpha+beta particle sources (dissolved uranium and thorium atoms) as well as from surface impacting solar protons. (§7.3)
- The ilmenite crystal structure (and potentially that of other oxides) attenuates reduction of Fe++, possibly due its high-density impeding interaction with protons and alpha+beta particles. (§7.2)
Geological Sources of Regolith Ejecta Zones
- Compositions of deep drill regolith ejecta zones (Laul et al., 1978, 1979, 1981; Silver, 1974; Meyer, 2012) consist of mixtures of distinct regolith types present on the valley floor and as accumulations near the bases of the South Massif, North Massif, and Sculptured Hills, with variable additions of orange+black and very low titanium (VLT) pyroclastic ashes. (§5.0)
- Potential contributions of regolith ejecta from the tops of the massifs to the valley floor appear to be minimal due to distance limitations. (§3.4.2)
Maturity Index (Is/FeO)-Based Exposure Ages
-
- Comparison of the Is/FeO values of two simultaneously buried regolith samples (76240, 76280) of unequal uranium and thorium contents gives an alpha+beta-only ∆Is/FeO / Myr / U+Th ppm = 0.58. (§6.3.2)
- Comparison of the Is/FeO values of shaded (76240) and exposed (76220) regolith samples gives a solar proton-only ∆Is/FeO / Myr = 0.11 for the last two regolith ejecta zones and equals 0.032 for earlier zones when a less energetic solar wind (Finding 31) is taken into account. (§6.3.3)
- The ∆Is/FeO values for the 10 complete deep drill core zones, divided by each zone’s total ∆Is/FeO / Myr (corrected for U and Th decay), give zones’ exposure ages that range from 38 to 131 Myr. (§7.3)
- Progressive summation of the ∆Is/FeO-based exposure ages for the 10 zones, including corrections for Is/FeO attenuation by pyroclastic glass and oxide minerals (§7.0), gives a total of 0.951 Ga for a core depth of 285 cm (§7.3), consistent with independent interpretations of Apollo 17’s Neutron Probe interpretations (Curtis and Wasserburg, 1975) (§9.2).
- Fractionation of nitrogen 14 from nitrogen 15 in deep drill core zones (Thiemens and Clayton, 1980) as a function of ∆Is/FeO maturity indices and current surface samples’ Is/FeO maturity indices (Morris et al., 1978, 1979) indicates that (1) 15N/14N increased significantly (δ15N‰ increase from <-200‰ to -118‰) prior to about 0.514 Ga and (2) that the energy of the solar wind increased by a factor of 3.4 after about 0.197 Ga and prior to 0.096 Ga andthe deposition of the last two zones in the deep drill core. Warming of the oceans associated with the increase in 15N/14N at 0.514 may coincide, within uncertainties, with the Cambrian Explosion of ocean life on Earth at about 0.538 Ga (§6.2).
Evaluation of Cosmic Ray Exposure Ages
- With the exception of krypton, spallation isotope ratios in the deep drill core (Eberhardt et al., 1974) do not show evidence of fractionation during regolith maturation. (§8.0)
- Krypton isotope ratios show a slight effect of fractionation during maturation; however, this may be the result of the rapid decomposition of a pressure-stabilized krypton hydride [Kr(H2)4] (Kleppe et al., 2014) produced by impact shock. (§8.0)
- Cosmic ray exposure ages of deep drill core zones (Eberhardt et al., 1974), that include pre-excavation exposure, are uniformly older than ∆Is/FeO-based ages, indicating that shock from source crater formation has reset pre-impact regolith Is/FeO values by ~76-97%. (§8.0)
Thickness of Taurus-Littrow Valley Regolith
- A regolith ejecta accumulation rate of ~2.87 m / Ga for the deep drill core (2.85 m /938 Ga), as related to the age of ~3.82 Ga (39-40Ar; Schaeffler et al., 1977) for the youngest eruption of bedrock ilmenite basalt lava in Taurus-Littrow, indicates that the regolith at the deep drill core site is ~11 m deep. This depth is roughly consistent with two, independent geophysical estimates of ~20 m (SEPE) and <25 m (ASPE) for the Lunar Roving Vehicle route just west of the core site, when considering the geophysical effects of fracturing and rubble on bedrock. (§7.3)
- The total, pre-deposition cosmic ray exposure ages for the deep drill core zone as compared with the thickness-weighted rate of exposure age accumulation of 37.5 Myr / m indicate a range 14.7 to 6.5 m for the depths of the of pre-impact source crater regoliths, consistent with the 11 m depth estimate for the drill core site. (§8.8)
Ilmenite Basalt and Orange+Black Pyroclastic Ash
- The structure of the orange+black ash deposit at Shorty Crater is that of a partially overturned anticline with the top partially planed off by the Shorty impact and sampled to a post-deformation depth of ~70 cm by core 74001/2. (§10.1)
- The absence of obvious evidence of regolith development after each orange+black ash depositions (Nagle, 1978a, 1978b, 1979), except for the youngest ash deposit, was due to (1) lack of solar proton and alpha+beta particle induced formation of nano-phase iron in volcanic glass, (2) impact gardening of the surfaces producing ash shards and impact aggregates much like those already inherent in the exposed ash, and (3) the 12 cm to a probably total of <75 cm thick ash deposits greatly reducing or eliminating the excavation and incorporation of underlying basaltic regolith in the few tens of Myr of each deposit’s exposure before burial. (§10.2)
- Stratigraphic definition of 5-7 depositions of pyroclastic orange+black ash in core 74001/2, and summation of cosmic ray exposure ages (Eugster et al., 1981a, 1981b) of those strata indicate that eruptions occurred at ~20 Myr intervals over 174 to 224 Myr years. (§10.3)
- Orange+black pyroclastic ash eruptions in Taurus-Littrow began very soon after the last ilmenite basalt lava eruptions at 3.82 ± 05 Ga and ended at 3.60 ± 0.04 Ga (old 40K decay constants) (Huneke, 1978). (§10.3)
- The presence of current solar wind nitrogen and helium ratios only in the youngest deposit of orange+black ash indicates that, by 3.60 ± 04 Ga, the ancient lunar magnetic field had declined to a value that allowed low latitude impingement by the solar wind. (§10.4)
- The positive value of δ15N‰ in core 74001 (Kerridge et al., 1991) indicates that the source of the orange+black ash magma was in a chondritic lower mantle (proto-core) and that the primordial value during accretion also was positive. (§10.5)
- Very Low Titanium (VLT) pyroclastic ash (78526, 70007 ash bead; §5) eruptions occurred in Taurus-Littrow simultaneously with orange+black ash eruptions, but apparently from differentiated ilmenite basalt magma bodies rather than from a lower mantle source. (§10.6)
Light Gray Regolith Covering Pyroclastic Ash
- Light gray regolith at Shorty Crater was ejected from Fitzgibbon Crater, an ancient adjacent impact crater, and covered the orange+black ash layers about 24 Myr (Eugster et al., 1981a, 1981b) after the last pyroclastic eruption, preventing this specific ash deposit from being incorporated in regolith development for about 3.5 billion years. (§11.1)
- The light gray regolith at Shorty Crater developed on an area Sculptured Hills-like material, a portion of which was not covered by ilmenite basalt lavas. (§11.1)
- The light gray regolith Is/FeO = ~5 for samples of (74240 and 74260) versus a cosmic ray exposure age ~160 ± 50 Myr (Eugster et al., 1977). This contrast indicates that the impact shock associated with Shorty Crater has reset the original Is/FeO values of ~73. (§11.2)
- Values of δ15N‰ in probable pre-lunar magnetic field regolith samples from Van Serg Crater indicate that the ancient solar wind’s δ15N‰ was less than –200‰, suggesting that 15N production in the Sun increased to present δ15N‰ levels of –118 ± 5 about 0.514 Ga (§6.2 and §13.4)
- Very low values of the pre-0.514 Ga solar δ15N‰ also are indicated by a linear relationship between δ15N‰ and deep drill core zone maturity indices (∆Is/FeO). (§6.2.2)
- A linear increase of δ15N‰ (Thiemens and Clayton, 1980) as a function of deep drill core zone maturity indices (∆Is/FeO) indicates the value of δ15N‰ has been constant at –118 ± 5 since about 0.514 Ga. (§6.2.2)
- Fractionation of nitrogen 14 from nitrogen 15 (Thiemens and Clayton, 1980) as a function of ∆Is/FeO maturity indexes prior to 0.096 Ga and after 0.197 Ga indicates that the energy of the solar wind had increased by a factor of ~3.2 during the deposition of the last two regolith ejecta zones in the deep drill core. (§6.2.3)
- The young and old light mantle avalanche deposits of regolith are the consequence of the last two of at least 6 mass wasting events from the slopes of the South Massif after the 3.82 Ga (old 40K decay constant) partial filling of Taurus-Littrow valley with ilmenite basalt lavas. (§17.1)
- The long run-out nature of these dry, largely very fine grained avalanches in vacuum at 1/6 g was the result of fluidization largely through agitation induced release of solar wind volatiles, as indicated by particle size-frequency observations. (§17.3)
- The young light mantle avalanche occurred between 27 and 32 Myr ago, based on detailed comparisons of ∆Is/FeO maturity indexes for samples of young and old light mantles and for the South Massif slope. (§17.4)
- Interpretation of the stratigraphy, reflectance and Is/FeO values in drive tube core 73001/2 indicate that the old light mantle avalanche occurred between 10 and 15 Myr before largely being buried by the young light mantle avalanche. (§17.7)
- Is/FeO values in drive tube core 73001/2 indicate that a pre-old light mantle, “ancient” avalanche occurred ~6 Myr before the old light mantle avalanche. (§17.8)
- The anomalously high uranium and thorium content of South Massif regolith (72501) as compared to young light mantle regolith (73121) is due to the post-avalanche downward migration of U- and Th-rich material from a triangular ejecta deposit on and below the crest of the South Massif. (§17.10)
- Dilution of light mantle regolith with ilmenite basalt regolith through impact redistribution follows a y = 1/x function of percent dilution versus distance (§22.0).
- The triggers for mass wasting events from the slope of the South Massif, and potentially for other such events from the North Massif and the Sculptured Hills, are repeated movements along the Lee-Lincoln thrust fault. (§17.13)
Thermoluminescence of Taurus-Littrow Regolith
- Material with high uranium and thorium content was shed from the Station 6 boulder as it bounced down the slope of the North Massif and was incorporated in the impact splash as it came to rest, specifically enriching those elements in samples 76220 and 76240. (§18.2)
- At final impact at ~19.5 Myr (average of reported exposure ages), the tracked boulder at Station 6 broke into five large fragments, one of which created the shadow that covered regolith sample 76240, as well as burying sample 76280. (§18.1)
- The buildup and preservation of the low temperature 223º C thermoluminescence peak in continuously shadowed 76240 (Duranni et al., 1976, 1977; Shelke and Sears, 2022) is likely largely the result of alpha+beta radiation over 19.5 Myr. (§18.2)
- Thermoluminescence patterns in the deep drill core zones (Sehlke and Sears, 2022) indicate various balances between temperature induced loss and alpha+beta production of traps. (§18.4).
- The synthesis of data from Taurus-Littrow indicates that the Imbrium basin forming impact occurred between 3.850 and 3.795 Ga. (§22.0)
Pre-Basalt Lithoclastic Debris
- Comparison of North and South Massif regolith samples from the Valley of Taurus-Littrow indicates that volatile-rich, lithoclastic volcanic eruptions preceded those that produced the ~3.795 Ga (corrected from 3.82 Ga reported age) mare basalts. (§25.0)
Procellarum Impact Induced Overturn
- Partial symplectitic coronas in troctolite 76535 between plagioclase and olivine consisting of retrograde assemblages made up of Cr-spinel intergrown with clineoproxene next to plagioclase and with orthopyroxene next to olivine have replaced prograde Cr-rich garnet. These relationships indicate this sample and crushed dunite 72415 originated below ~400 km and 500 km, respectively, in the partially differentiated magma ocean as a result of upper mantle overturn triggered by the Procellarum basin-forming impact at ~4.35 Ga. (§26.0)
Fractional Crystallization of Ilmenite Basalt Lava
- Chemical trends in ilmenite basalt samples from rake sample 71500 indicate that the initial crystallization sequence was olivine, Ca-plagioclase, ilmenite and clinopyroxene. (§27.0)
- Gupta, R. P. (2023). JWST early universe observations and ΛCDM cosmology. Mon. Not. Roy. Astron. Soc., 524, 3385-3395. ↑
- Tikoff, B. and T. F. Shipley (2025) Grand Canyon, USA: Lumping and splitting to make sense of a (somewhat) predictable world. GSA TODAY, 35, 4, 4.9↑
Albee, A. L., R. F. Dymek, and D. J. DePaolo (1975) Spinel symplectites: high-pressure solid-state reaction or late-stage magmatic crystallization? LPSC VI, SAO/NASA Astrophysics, Data System, Abstract, 1-3.
Alexander, E. C., Jr., M. R. Coscio., J. C. Dragon, and K. Saito (1980) K/Ar dating of lunar soils IV: Orange glass from 76220 and agglutinates from 14259 and 14163. LPSC XI, 1663-1677.
Arvidson, R., R. Drozd, E. Guinness, C. Hohenberg, C. Morgan, R. Morrison, and V. Oberbeck (1976) Cosmic ray exposure ages of Apollo 17 samples and the age of Tycho. LPSC VII, 2817-2832.
Baldwin, R. R., (1973) Mission Description. Apollo 17 Prelim. Sci. Rept., 2-4.
Becker, R. H. (1980) Light elements in lunar soils revisited: Carbon, nitrogen, hydrogen and helium. LPSC XI, 1743-1761.
Becker, R. H. and R. N. Clayton (1975) Nitrogen abundances and isotopic compositions in lunar samples. LPSC VI, 2131-2149.
Becker, R. H. and R. N. Clayton (1977) Nitrogen isotopes in lunar soils as a measure of cosmic ray exposure and regolith history, LPSC VIII, 3685-3704.
Becker, R. H. and R. O. Pepin (1989) Long-term changes in solar wind elemental and isotopic ratios: A comparison of two lunar ilmenites of different antiquities. Geochim. Cosmochim. Acta 53, 1135-1146.
Bell, P. M., H. K. Mao, E. Roedder, and P. W Weiblen (1975) The problem with the origin of symplectites in olivine-bearing lunar rocks. LPSC VI, 231-248.
Bhanot, K. K., H. Downes, E. Jennings, and S. Wotton (2022) Apollo sample 72415 -A fragment of the lunar mantle? LPSC LXX, abstract 1820.
Bhanot, K. K., H. Downes, B. G. Rider-Stokes, E. Jennings, M. Anand, J. G. Snape, and M. Whitehouse (2024) A reappraisal of the petrogenesis of Apollo 17 lunar dunites 72415-72417: relics of the deep lunar mantle? Wiley, Meteor. Planet. Sci. https://doi.org/10.1111/maps.14269.
Blanchard, D. P. and J. Budahn (1978) Chemistry of orange/black soils from core 74001/2. LPSC IX, 1969-1980.
Bogard, D. D. and L. E. Nyquist (1973) 40Ar/36Ar variations in Apollo 15 and 16 regolith. LPSC IV, 1975-1985.
Bogard, D. D., L. E. Nyquist, W. C. Hirsch, and D. R. Moore (1973) Trapped solar and cosmogenic noble gas abundances in Apollo 15 and 16 deep drill samples. Earth Planet. Sci. Lett., 21, 52-69.
Borg, L., J. Connelly, W. Cassata, A. Gaffney, R. Carlson3, D. Papanastassiou4, J. Wasserburg, E. Ramon, R. Lindval, and M. Bizarro (2013) Evidence for widespread magmatic activity at 4.36 Ga in the lunar highlands from young ages determined on troctolite 76535. LPSC XLIV, Abstract 1563.
Borg, L. E., A. M. Gaffney, and C. K. Shearer (2015) A review of lunar chronology revealing a preponderance of 4.34–4.37 Ga ages (2015) Meteor. Planet. Sci., 50, 715-732.
Borg, L. E., A. M. Gaffney, and C. K. Shearer (2015) A review of lunar chronology revealing a preponderance of 4.34–4.37 Ga ages. Meteoritics & Planet. Sci. 50, 715-732, https://doi.org/10.1111/maps.12373.
Bower, W. R., C. I. Pearce, G. R. R. Droop, J. R. W. Mosselmans, K. Geraki, and R. A. D. Pattrick (2015) Radiation damage from long-term alpha particle bombardment of silicates – a microfocus XRD and Fe K-edge XANES study. Min. Mag., 79, 1455-1466.
Bower, W. R., C. I. Pearce, A. D. Smith, S. M. Pimblott, J. F. W. Mosselmans, S. J. Haigh, J. P. McKinley, and R. A. D. Pattrick (2016) Radiation damage in biotite mica by accelerated a-particles: A synchrotron micro X-ray diffraction and X-ray absorption spectroscopy study. Am. Min., 101, 928-942.
Brennecka, G. A., L. E. Borg, D. Hutcheon, M. A. Sharp, and A. Anbar, (2010) Natural variations in uranium isotope ratios of uranium ore concentrates: Understanding the 238U/235U fractionation mechanism, Earth Planet. Sci. Lett., 291, p. 228-233.
Brennecka, G. A., S. Weyer, M. Wadhwa, P. E. Janney, J. Zipfel, and A. D. Anbar (2010) 238U/235U Variations in Meteorites: Extant 247Cm and Implications for Pb-Pb Dating. Science, 327, 449-451.
Brunfelt, A. O., K. S. Heier, B. Nilssen, E. Steinnes, and B. Sundvoll (1974) Elemental composition of Apollo 17 fines and rocks. LPSC V, 981-990.
Burgess, K. D. and R. M. Stroud (2018) Phase-dependent space weathering effects and spectroscopic identification of retained helium in a lunar soil grain. Geochim. Cosmoschim. Acta, 224, 64-79.
Butler, P., Jr. and C. Meyer, Jr. (1976) Sulfur prevails in coatings on glass droplets: Apollo 15 green and brown glasses and Apollo 17 orange and black (devitrified) glasses. LPSC VII, 1561-1581.
Cadogan, P. H. and G. Turner (1976) The chronology of the Apollo 17 Station 6 boulder. LPC VII, 2267-2285.
Caldwell, E. (2004) Resources on Isotopes Periodic Table-Neon. U.S. Geological Survey, https://wwwrcamnl.wr.usgs.gov/isoig/period/ne_iig.html.
Cameron, E. N. (1990) Geology of the Mare Tranquillitatis and its significance for the mining of helium. WCSAR-TR=AR3-9006-1, 30-33.
Carrier, W. D., (1974) Apollo drill core depth relationships. The Moon, 10, 183-194, https://doi.org/10.1007/BF00655719
Carrier, W. D., III, L. G. Bromwell, and R. T. Martin, (1973) Behavior of returned lunar soil in vacuum. J. Soil Mech. Found. Div., Am. Soc. Civ. Eng., 99, 979-996.
Carrier, W. D., III, G. R. Olhoeft, and W. Mendell, (1991) Physical properties of the lunar surface, in G. H. Heiken, D. T. Vaniman, and B. M. French, Lunar Sourcebook, 475-594.
Carswell, D. A., R. D Tucker , P. J O’Brien , T. E Krogh (2003) Coesite micro-inclusions and the U/Pb age of zircons from the Hareidland Eclogite in the Western Gneiss Region of Norway. Lithos, 67, 181-190.
Carter, J., R. B. Ickert, D. F. Mark1, M. M. Tremblay, A. J. Cresswell, and D. C. W. Sanderson (2020) Production of 40Ar by an overlooked mode of 40K decay with implications for K-Ar geochronology. Geochron., 2, 355-365.
Cato, M. J., S. B. Simon, and C. K. Shearer (2022) Modal petrology of the <150 nm fractions of the Apollo 17 double drive tube 73001/2 and comparisons with nearby samples. Apollo 17-ANGSA Workshop, LPI Contrib. 2704, abstract 2033.
Cernan, E. A. (1972) Apollo 17 Transcript, ALSJ, GET 144:46:20, https://apollojournals.org/alsj/a17/a17.trvsta4.html.
Cohen, B. A., N. M. Curran, S. N. Valencia, et al. (2025) Composition, Mineralogy, and Noble-Gas content of Apollo 17 particles and soils from the 73002 drive tube. Jour. Geophys. Res.-Planets, 130 (3), https://doi.org/10.1029/2024JE008329.
Collins, G. S., and H. J. Melosh (2003) Acoustic fluidization and the extraordinary mobility of sturzstroms. J. Geophys. Res., 108(B10), 2473, https://doi.org/10.1029/2003JB002465.
Corzaz, G. (1980) Evolution history of the lunar regolith at the Apollo 14, 15 and 17 sites: Additional insights. LPSC XI, 1453-1462.
Corzaz, G., and A. L., Plachy (1976) Origin of the Apollo 17 deep drill core coarse-grained layer. LPSC VII, 123-131.
Corzaz, G., R. Drozd, C. Hohenberg, C. Morgan, C. Ralston, R. Walker, and D. Yuhas (1974) Lunar surface dynamics: some general conclusions and new results from Apollo 16 and 17. LPSC V, 2475–2499.
Curtis, D. B. and G. J. Wasserburg (1975) Apollo 17 neutron stratigraphy – sedimentation and mixing in the lunar regolith. The Moon 13, 185-227.
Curtis, D. B., and G. J. Wasserburg (1977) Stratigraphic processes in the lunar regolith – additional insight from neutron fluence measurements on bulk soils and lithic fragments from the deep drill cores, LPSC VIII, 3575-3593.
Cymes, B. A., and K. D. Burgess (2022a) Comparison of volatile content in lunar soils stored at -20 °C and 20 °C measured using STEM-EELS. Apollo 17 ANGSA-Workshop, abstract #2045.
Cymes, B. A., K. D. Burgess, R. M. Stroud, and ANGSA Team (2022b) Influence of frozen curation on volatile retention in pristine Apollo 17 samples: Initial results using aberration-corrected STEM-EELS and EDS. Microscopy Microanalysis, 28, 2704-2706, https://doi.org/10.1017/S1431927622010200.
David, J.-C., and I. Leya (2019) Spalation, cosmic rays, meteorites, and planetology, https://www.sciencedirect.com/science/article/pii/S0146641019300468.
Dragoset, R. (2001), Periodic Table: Atomic Properties of the Elements, Special Publication, NIST SP 966, National Institute of Standards and Technology, Gaithersburg, MD.
Drozd, R. J., C. M. Hohenberg, C. J. Morgan, F. A. Podosek, and M. L. Wroge (1977) Cosmic-ray exposure history at Taurus-Littrow. LPSC VII, 3027-3043.
Duke, M. B., C. C. Woo, G. A. Sellers, M. L Bird, and R. B., Finkelman (1970) Genesis of lunar soil at Tranquillity Base. LPSC I, 347-361.
Dukes, C. A., J. Maxson, T. Ho, L. Ziamanesh1, M. Jones, J. Oraegbu, K. et al., and the ANGSA Science Team. (2022) Contextualizing the Compositional Variation within Apollo 17 Core Sample 73002/73001: X-ray Photoelectron and Energy-Dispersive X-ray Spectroscopic Measurements. Apollo 17 ANGSA Workshop, LPI Contrib. 2704, abstract 2050.
Durrani, S. A., K. A. R. Khazal and A. Ali (1976) Temperature and duration of some Apollo 17 boulder shadows. LPSC VII, 1157-1177.
Durrani, S. A., K. A. R. Khazal, and A. Ali (1977) Temperature and duration of the shadow of a recently arrived lunar boulder. Nature, 266, 411-415.
Dymek, R. F., A. L. Albee, and A. A. Chodos. (1975) Comparative petrology of lunar cumulate rocks of possible primary origin: dunite 72415, troctolite 76535, norite 78235, and anorthosite 62237. LPSC VI, 301-341
Eberhardt, P., O. Eugster, J. Geiss, H. Graf, N. Grogler, S. Guggisberg, M. Jungcck, P. Maurer, M. Morgeli and A. Stettler (1974) Solar wind and cosmic radiation history of Taurus-Littrow regolith. LPSC V, 197-199 (abstract).
Elardo, S. M., D. S. Draper, and C. K. Shearer (2012) Lunar Magma Ocean crystallization revisited: Bulk composition, early cumulate mineralogy, and the source regions of the highlands Mg-suite. Geochim. et Cosmochim. Acta, 87, 154-177.
Eldridge, J. S., G. D. O’Kelley, and K. J. Northcutt (1974) Primordial radio-element concentrations in rocks and soils from Taurus-Littrow. LPSC V, 1025-1033.
Eugster, O. (1985) Multistage exposure history of the 74261 soil constituents. LPSC XVI, J. Geophys. Res., 90, D95¬D102.
Eugster, O., P. Eberhardt, and J. Geiss, (1969) Isotopic analyses of Krypton and Zenon in fourteen stone meteorites. J. Geophys. Res., 74, 3874-3896.
Eugster, O., P. Eberhardt, J. Geiss, N. Grögler, M. Jungck, and M. Mörgeli (1977) The cosmic-ray exposure history of Shorty Crater samples; the age of Shorty Crater. LPSC VIII, 3059-3082.
Eugster, O., P. Eherhardt, J. Geiss, and N. Grögler (1978) The solar wind and cosmic-ray exposure history of soil from drive tube 74001, an unmixed lunar regolith. LPSC IX, 306-308 (abstract).
Eugster, O., N. Grögler, P. Eberhardt, and J. Geiss (1979) Double drive tube 74001/2: History of the black and orange glass; determination of a pre-exposure 3.7 AE ago by 136Xe/235U dating LPSC X, 1351-1379.
Eugster, O., W. Kiesl, N. Grögler, P. Eberhardt, and J. Geiss (1981a) Chemical abundances, cosmic ray production rates and exposure history of soils from 74001/2. LPSC XII, 268-269 (abstract).
Eugster, O., N. Grögler, P. Eberhardt, J. Geiss and W. Kiesl, (1981b) Double drive tube 74001/2: A two stage exposure model based on noble gases, chemical abundances and predicted production rates. LPSC XII, 541-558.
Evans, J.C., J. S. Fruchter , J. H. Reeves, L. A. Rancitelli, and R. W. Perkins (1980) Recent depositional history of Apollo 16 and 17 cores. LPSC XI, 1497-1509.
Fassett, C.I. and B. J. Thompson (2014), Crater degradation on the lunar maria: topographic diffusion and the rate of erosion on the Moon, Jour. Geophy. Res. 119, 2255-2271.
Frick, U., H. Baur, H. Funk, D. Phinney, C. Schafer, L. Schultz, and P. Signer (1973) Diffusion properties of light noble gases in lunar fines. LPSC IV, 1987-2002.
Frick, U., R. H. Becker, and R. O. Pepin (1987) Solar wind record in the lunar regolith: Nitrogen and noble gases. LPSC XVIII, 87-120.
Fruchter, J. S., L. A. Rancitelli, and R. W. Perkins (1975) Primordial radionuclide variation in the Apollo 15 and 17 deep core samples and in Apollo 17 igneous rocks and breccias. LPSC VI, 1399-1405.
Fruland, R. M., R. V. Morris, D. S. McKay, and U. S. Clanton (1977) Apollo 17 ropy glasses. LPSC VII, 3095-3111.
Füri, E. and B. Marty (2015) Nitrogen isotope variations in the solar system. Nature Geosciences, https://doi.org/10.1038/ngeo2451.
Füri, E., P. H. Barry, L. A. Taylor, and B. Marty (2015) Indigenous nitrogen in the Moon: Constraints from coupled nitrogen-noble gas analyses of mare basalts. Earth Planet. Sci. Lett., 431, 195-205.
Garcia, R. F., A. Khan, M. Drilleau, et al. (2019) Lunar seismology: An update on interior structure models. Space Sci. Rev., 215, https://doi.org/10.1007/s11214-019-0613-y.
Geiss, J. and P. Bochsler (1982) Nitrogen isotopes in the solar system, Geochem. Cosmochem. Acta, 46, 529-548.
Glass, B. P. (1976a) Major element compositions of glasses from Apollo 11, 16 and 17 soil samples. LPSC VII, 679-693.
Glass, B. P. (1976b) Major element compositions of glasses from Apollo 11, 16 and 17 soil samples. LPSC VII, 679-693.
Goswami, J. N. and D. Lal (1974) Cosmic ray irradiation pattern at the Apollo 17 site: implications to lunar regolith dynamics. LPSC V, abstract 1107, 284-5.
Goswami, J. N. and D. Lai (1979) Depositional history of the Apollo 17 deep drill core based on particle track record. LPSC X, abstract 1161, 452-4.
Gould, J. C. (1989) Wonderful Life: The Burgess Shale and the Nature of History. Norton, ISBN 978-0-393-02705-1. https://search.worldcat.org/en/title/185746546.
Graf, J. C. (1993) Lunar Soils Grain Size Catalog. NASA Ref. Pub. 1265, 333-343.
Hagerty, J. J., C. K. Shearer, and D. T. Vaniman (2006) Heat-producing elements in the lunar mantle: Insights from ion microprobe analyses of lunar pyroclastic glasses. Geochim. Cosmochim. Acta, 70 (13), 3457-3476.
Harvard (2022) Radiation and Shielding. Harvard Natural Sciences Lecture Demonstrations.
Hashizume, K, M. Chaussidon, B. Marty, and F. Robert (2000) Solar wind record on the Moon: Deciphering pre-solar from planetary nitrogen. Science, 290, 1142-1145.
Hashizume, K., B. Barty, R. Wieier, (2002) Analyses of nitrogen and argon in single lunar grains towards a quantification of the asteroidal contribution to planetary surfaces. Earth Planet. Sci. Lett., 202, 201-216.
Hauri, E. H., T. Weinreich, A. E. Saal, M. C. Rutherford, and J. A. Van (2011), High Pre-Eruptive Water Contents Preserved in Lunar Melt Inclusions. Science, 333, 213-215.
Heiken, G. H. (1974) A catalog of lunar soils. NASA JSC Curator.
Heiken, G. H. and D. S. McKay (1974) Petrology of Apollo 17 soils. LPSC V, 843-860.
Heiken, G. H., D. T. Vaniman, and B. M. French, (1992) Lunar Source Book, Cambridge Univ. Press, 736 p.
Helmke, P.A., D.P. Blanchard, J.W. Jacobs, K.M. Trelander, and L.A Haskin (1973) Major and trace element materials from the Apollo 17 deep drill core. Trans. Am. Geophys. Union, 54, 595-.
Heuer, A. H., J. M. Christie, J. S. Lally, and G. L. Nord. (1974) Electron petrographic study of some Apollo 17 breccias. LPSC V, 275-286.
Hintenberger, H. and H. W. Weber (1973) Trapped rare gases in lunar fines and breccias. LPSC IV, 2003-2019.
Hintenberger, H. H., H. W. Weber, H. Voshage, H. Wanke, F. Belgemann, and F Wlotzka (1970) Concentrations and isotopic abundances of the rare gasses, hydrogen and nitrogen in Apollo 11 lunar matter. LPSC I, 1269-1282.
Hintenberger, H., H. W. Weber, and L. Schultz (1974) Solar, spallogenic, and radiogenic rare gases in Apollo 17 soils and breccias. LPSC V, 2005-2022.
Hintenberger, H., L. Schultz, and H. W. Weber (1975) A comparison of noble gases in lunar fines and soil breccias: Implications for the origin of soil breccias. LPSC VI, 2261-2270.
Heymann D., and Yaniv A. (1970) Inert gases in the fines from the Sea of Tranquillity. LPSC I, 1247-1259.
Heymann, D., and A. Yaniv (1971) Breccia 10065: Release of inert gases by vacuum crushing at room temperature. LPSC II, 1681-1692.
Heymann D., A.Yaniv and S. Lakatos (1972) Inert gases from Apollo 12, 14 and 15 fines. LPSC III, 1857-1863.
Housley, R. M., R. W. Grant, and N. E. Paton (1973) Origin and characteristics of excess Fe metal in lunar glass welded aggregates. LPSC IV, 2737-2749.
Housley, R. M., E. H. Cirlin., I. B. Goldberg, and H. Crowe (1976) Ferromagnetic resonance studies of lunar core stratigraphy. Proc. LPSC VII, 13-26.
Hubner, W., T. Kirsten, and J. Kiko (1975) Rare gases in Apollo 17 soils with emphasis on analysis of size and mineral fractions of soil 74241. LPSC VI, 2009¬ 2026.
Hughes, D.W., and I. P. Williams (2000) The velocity distributions of periodic comets and stream meteroids. Mon. Not. Royal Astronomical Society, 315 (3), 629–634, https://doi.org/10.1046/j.1365-8711.2000.03435.x.
Hui, H., K-U. Hess, Y. Zhang, A. R. L. Nichols, A. H. T Prelier, R. A. Lange, D. B. Dingwell, C. R. Neal (2018) Cooling rates of lunar orange glass beads. Earth Planet. Sci. Lett. 503, 88-94.
Huneke, J. C. (1978) 40Ar-39Ar microanalysis of single 74220 glass balls and 72435 breccia clasts. LPSC IX, 2345-2362.
Iverson, R. M. (1997) The physics of debris flows. Rev. of Geophys, 35, 245–296, https://doi.org/10.1029/97RG00426.
Jerde, E. A., P. H. Warren, R. V. Morris., G. H. Heiken, and D. T. Vaniman (1987) A potpourri of regolith breccias: “New” samples from the Apollo 14, 16 and 17 landing sites. LPSC XVII, E526-E536.
Jolliff, B. L., K. M Rockow, R. L Korotev. and L. A Haskin. (1996) Lithologic distributions and geologic history of the Apollo 17 site: The record in soils and small rock particles from the highlands massifs. Meteor. & Planet. Sci. 31, 116-145.
Kahn, A., K. Mosegaard, and K. L. Rasmussen (2000) A new seismic velocity model for the Moon from a Monte Carlo inversion of the Apollo lunar seismic data. Geophys. Res. Lett., 27, 1591-1594.
Khan, A., A. Pommier, G. A. Neumann, and K. Mosegaard (2013) The lunar moho and the internal structure of the Moon: A geophysical perspective. Tectonophys., 609, 331-352.
Kerridge, J. F. (1975) Solar nitrogen: Evidence for secular changes in the ratio of nitrogen-15 to nitrogen-14. Science, 188, 162-164.
Kerridge, J. F. (1980) Secular variations in composition of the solar wind: evidence and causes, in R. O. Pepin, J. A, Eddy, and R. B. Merrill (eds.). The Ancient Sun, 475-489.
Kerridge, J. F., O. Eugster, J. S. Kim, and K. Marti (1991) Nitrogen isotopes in the 74001/74002 double-drive tube from Shorty Crater, Apollo 17. LPSC XXI, 291-299.
Kirk, R. L, and D. J. Stevenson, (1989) The competition between thermal contraction and differentiation in the stress history of the Moon. JGR Solid Earth, 94, 12133-12144.
Kirsten, T., F. Steinbrunn, and J. Zahringler (1971) Location and variation of trapped rare gases in Apollo 12 lunar samples. LPSC II, 1651-1669.
Kirsten, T., J. Deubner, P. Horn, I. Kaneoka, J. Kiko, O. A. Schaffer, and S. K Thio (1972) The rare gas record of Apollo 14 and 15 samples. LPSC III, 1865-1889.
Kirsten, T., P. Horn, D. Heymann (1973) Apollo 17 crystalline rocks and soils: rare gases, ion tracks and ages. Trans. Amer. Geophys., 54, 594-597. https://doi.org/10.1016/0012-821X(73)90149-0.
Kleppe, A. K., M. Amboage, and A. P. Jephcoat (2014) New high-pressure van der Waals compound Kr(H2)4 discovered in the krypton-hydrogen binary system. Scientific Reports. 4, 4989, https://doi.org/10.1038/srep04989.
Kling, A. M. and M. S. Thompson, (2024). Solar wind neon stored in space weathering signatures in mature lunar soils. LPSC LV, abstract, 1567.
Koeberl, C., and V. L. Sharpton (2024) Terestrial Impact Craters, 2nd Edition, Lunar Planet. Inst. https://www.lpi.usra.edu/publications/slidesets/craters/.
Korotev, R. L. and D. Kremser (1992) Compositional variations in Apollo 17 soils and their relationships to the geology of the Taurus-Littrow site. LPSC XXII, 275-301.
Korotev, R. L. and K. M. Bishop (1993) Composition of Apollo 17 core 76001. LPSC XXIV, abstract, 819-820.
Kovach, R. L., J. S. Watkins and P. Talwani (1973) Lunar Seismic Profiling Experiment. Apollo 17 Prelim. Sci. Rep., 10-4–10-12, NASA SP-330.
Krähenbühl, U. (1980) Distribution of volatile and non-volatile elements in grain-size fractions of Apollo 17 drive tube 74001/2. LPSC XI, 1551-1564.
Krawczynski, M. J. and T. Grove (2012) Experimental investigation of the influence of oxygen fugacity on source depths for high-Ti lunar ultramafic melts. Geochim. Cosmochim Acta, 79, 1-19.
Langseth, M. G., Jr., S. J. Keihm, and J. I. Chute, Jr. (1973) Heat flow experiment. Apollo 17 Preliminary Science Report, NASA-SP-330, 9-1 to 9-24.
Laul, J. C. and R. A. Schmitt (1974) Chemical composition of Boulder-2 rocks and soils, Apollo 17, Station 2. Earth Planet. Sci. Lett., 23, 206-219.
Laul, J. C. and R. A. Schmitt (1975) Chemical composition of Apollo 17 samples: Boulder breccias (2), rake breccias (8), and others. LPSC VI, 489-491, abstract.
Laul, J. C. and J. J. Papike (1980a) The Apollo 17 drill core: Chemistry of size fractions and the nature of the fused soil component. LPSC XI, 1395-1313.
Laul, J. C. and J. J. Papike (1980b) The lunar regolith: Comparative chemistry of the Apollo sites. LPSC XI, 1307-1340.
Laul, J. C., D. W. Hill, and R. A. Schmitt (1974) Chemical Studies of Apollo 16 and 17 Samples. LPSC V, 1047-1066.
Laul, J. C., D. T. Vaniman, J. J. Papike, and S. B. Simon (1978) Chemistry and petrology of size fractions of the Apollo 17 deep drill core 70009-70006. LPSC IX, 2065-2097.
Laul, J. C., E. A. Lepel, D. T. Vaniman, and J. J. Papike, (1979) The Apollo 17 drill core: Chemical systematics of grain size fractions. LPSC X, 1269-1298.
Laul, J. C., J. J. Papike, and S. B. Simon (1981) The lunar regolith: Comparative studies of the Apollo and Luna sites: Chemistry of soils from Apollo 17, Luna 16, 20 and 24. LPSC XII, 389-407.
Leich, D. A., S. B. Kahl, A. R. Kirschbaum, S. Niemeyer, and D. Phinney (1975) Rare gas constraints on the history of Boulder 1, Apollo 17 Station 2, Apollo 17. The Moon, 14, 407-444.
Le Mouélic, S., B. Seignovert, G. Caravaca1, H.H. Schmitt, N. Mangold, and P. Enguehard (2022) Revisiting Apollo 17 Station 6 boulders with photogrammetry, virtual reality and stereoscopy. LPSC LII, abstract, 1342.
Le Mouélic, S., M. Guenneguez, H. H. Schmitt, L. Macquet, N. Mangold, G Caravaca, B. Seignovert, E. Le Menn, L. Lenta (Jan., 2024) Photogrammetric 3D Reconstruction of Apollo 17 Station 6: From boulders to lunar rock samples integrated into virtual reality. Planet. Space Sci., 240, https://doi.org/10.1016/j.pss.2023.105813.
Li, A., L. Song, G. Chen, W. Xu, J. Huo, et al (2022) Taking advantage of glass: capturing and retaining the helium gas on the moon. Materials Futures 1, 035101 https://doi.org/10.1088/2752-5724/ac74af.
Locke, D. P. (1949) Helium-3 vacancy bound states, Bose-Einstein condensation, and the J problem in solid helium-4, Univ. AZ, Dissertation.
Longhi, J. (1994) Liquidus equilibria of lunar analogs in the garnet stability field. LPSC XXV, 803-804.
Lucchitta, B. K. (1977). Crater clusters and light mantle at the Apollo 17 site; a result of secondary impact from Tycho. Icarus, 30(1), 80-96.
Lucchitta, B. K. (1979) Relative age of Camelot Crater and Crater Cluster near the Apollo 17 landing site. Icarus, 37, 39-50.
Lue, C., J. S. Halekas, A. R. Poppe, and J. P. McFadden (2018) ARTEMIS Observations of Solar Wind Proton Scattering off the Lunar Surface. Jour. Geophys. Res., 125, 5289-5299.
Magnarini, G. T., T. M. Mitchell, P. M. Grindrod, H. H. Schmitt, and N. E. Petro (2021) Scaling relationship between the wavelength of longitudinal ridges and the thickness of long run-out landslides on the Moon. JGR Planets, 126, https://doi.org/10.1029/2021JE006922.
Mahanti, P., M. S. Robinson, T. J. Thompson, and M. R. Henriksen (2018) Small lunar craters at the Apollo 16 and 17 landing sites – morphology and degradation. Icarus, 299, 475-501.
Maloof, A. C., S. M. Porter, J. L. Moore, F. Ö. Dudás, S. A. Bowring, J. A. Higgins, D. A. Fike, and M. P. Eddy (2010) The earliest Cambrian record of animals and ocean geochemical change, GSA Bull., 122, 1731-1774.
Marty, B., K. Hashizume, M. Chaussidon, and R. Wieler (2003) Nitrogen isotopes on the Moon: Archives of the solar system and planetary contributions to the inner solar system. Space Sci. Revs. 106, 175-196.
Marty, B., M. Chaussidon, R. C. Wiens, A. J. G Jurewicz, and D. S. Burnett (2011) A 15N-poor isotopic composition for the Solar System as shown by Genesis solar wind samples. Science, 332, 1533-1536.
Mathew, K. J., and K. Marti (2001) Lunar nitrogen: indigenous signature and cosmic-ray production rate. Earth and Planet. Sci. Ltrs., 184, 659-669.
McCallum, I. S. and J. M. Schwartz (2001) Lunar Mg suite: Thermobarometry and petrogenesis of parental magmas. Jour. Geophy. Res., 106(E11), 27,969–27,983.
McGee, P. E., C. H. Simonds, J. L Warner. and W. C. Phinney (1979) Introduction to the Apollo Collections: Part II Lunar Breccias. NASA JSC Curators Office.
McKay, D. S., W. R. Greenwood, and D. A. Morrison (1970) Origin of small lunar particles and breccia from the Apollo 11 site. LPSC I, 673-694.
McKay, D. S., G. H. Heiken, and G. Waits, (1978) Core 74001/2 – Grain size and petrology as a key to the rate of in-situ reworking and lateral transport on the lunar surface. LPSC IX, 1913-1972.
McKay, D. S., D. D. Bogard, R. V. Morris, R. L. Korotev, P. Johnson, and S.J. Wentworth (1986) Apollo 16 regolith breccias: Characterization and evidence for early formation in the megaregolith. LPSC 16, D277-D303.
McKay, D. S., D. D. Bogard, R. V. Morris, R. L Korotev., S. J. Wentworth and P. Johnson (1989) Apollo 15 regolith breccias: Window to a KREEP regolith. LPSC 19, 19-41.
McMurtry, G. M., J. R. DeLuze, D. R. Hilton, and J. E. Blessing (2019) Differential diffusion of helium isotopes in glass, quantum tunneling 3He enrichment, and probable 3He/4He monitoring of mantle processes, Sci. Repts, 9, 5213.
Melosh, H. J. (1977) Crater modification by gravity: A mechanical analysis of slumping, in D. J. Roddy, R. O. Pepin, and R. B. Merril, eds., Impact and Explosion Cratering, Pergamon, New York, 1245-1260.
Merle, R. E., Nemchin, A. A., Grange, M. L., Whitehouse, M. J., and Pidgeon, R. T. (2014). High resolution U-Pb ages of Ca-phosphates in Apollo 14 breccias: Inplications for the age of the Imbrium impact. Meteor. & Planet. Sci., 49, 2241–2251.
Metcalfe, T. (2018) The Sun’s magnetic midlife crisis. Physics Today 71, 6, 70; https://doi.org/10.1063/PT.3.3956.
Meyer, C. (2012) Lunar Sample Compendium, https://curator.jsc.nasa.gov/lunar/lsc/76001.pdf., for sample 76001; and other samples at https://curator.jsc.nasa.gov/lunar/lsc/index.cfm.
Meyer, C., D. S. McKay, D. H. Anderson. and P. Butler (1975) The source of sublimates on the Apollo 15 green and Apollo 17 orange glass samples. LPSC VI, 1673-1699.
Miller, M. D., R. A. Pacer, M.-S Ma, B. R. Hawke, G. L. Lookhart, and W. D. Ehmann (1974) Compositional studies of the lunar regolith at the Apollo 17 site. LPSC V, 1079-1086.
Mitchell, J. K., W. D. Carrier, N. C. Costes, W. N. Houston, R. F. Scott, and H. J. Hovland (1973) Soil-Mechanics, in Apollo 17 Prelim. Sci. Rpt., NASA SP-330, 8-1 to 8-22.
Morris, R. V. (1976) Surface exposure indices of lunar soils: A comparative FMR study. LPSC VII, 315-336.
Morris, R. V. (1978) The surface exposure (maturity) of lunar soils: Some concepts and Is/FeO compilation. LPSC IX, 2287-2297.
Morris R.V. and H.V. Lauer (1979) FeO and surface exposure (maturity) depth profiles of cores 15010/11 (Hadley Rille) and 76001 (North Massif). (abs) LPSC X, 861-862.
Morris, R. V., R. V. Gibbons, and F. Horz, (1975) FMR thermomagnetic studies up to 900 of lunar soils and potential magnetic analogs. Geophys. Res. Lett., 2461-2464.
Morris, R. V., W. A. Gose and H. V. Lauer (1978) Depositional and surface history of the Shorty Crater core 74001/2: FMR and magnetic studies. LPSC IX, 2033-2048.
Morris, R. V., H. V. Lauer and W. A. Gose (1979) Depositional and exposure history of the Apollo 17 deep drill core. LPSC X, 1141-1157.
Morris, R. V., R. I. Korotev, and H. V. Lauer (1989) Maturity and geochemistry of the Van Serg Core (79001/2) with implications for micro-meteorite composition, LPSC IXX, 269-284.
Morris, R. V., N. C. Haney, D. G. Agresti, M. D. Neuman, K. Wang, B. L. Jolliff, C. K. Shearer, H. H. Schmitt, and ANGSA Science Team (2022a) Stratigraphy of the Apollo 17 landside core 73002 from FMR maturity and VNIR and Mössbauer spectroscopy, LPSC LIII, Abstract 1849.
Morris, R. V., N. C. Haney and ANGSA Science Team (2022b) Stratigraphy of the Apollo 17 landslide core section 73001. Apollo 17-ANGSA Workshop, Lunar and Planetary Institute. Abstract #2047.
Mortimer, J., A. B. Verchovsky, M. Anand, I. Gilmour, and C. T. Pillinger (2015) Simultaneous analysis of abundance and isotopic composition of nitrogen, carbon, and noble gases in lunar basalts: Insights into interior and surface processes on the Moon. Icarus, 255, 3-17, https://doi.org/10.1016/j.icarus.2014.10.006.
Nagle, J. S. (1978a) A comparison of a lunar and a terrestrial volcanic section. LPSC IX, 1509-1526.
Nagle, J. S. (1978b) The detrital zone in the Shorty Crater cores. The Moon, 18, 499-517.
Nagle, J. S. (1979) Drive tube 76001 – continuous accumulation with complications? LPSC X, 1385-1399.
Nagle, J. S. and S. R. Waltz (1979) Sedimentary petrology of the Apollo 17 Deep Drill String. LPSC X, 895-897 (abstract).
Nahm, A. L., T. R. Walters, C. L. Johnston, M.E. Banks, C. H. van der Bopgert, R. C. Weber, and J. C. Andrews-Hanna (2023) Tectonics of the Moon, in New Views of the Moon 2, C. R. Neal, L. Gaddis, B. L. Jolliff, S. J. Lawrence, S. J. Mackwell, C. K. Shearer, S. N. Valencia et al., eds., Min. Soc. 691-727.
NASA Data Sheets, Handbook of Lunar Soils. Planet. Materials Branch, NASA JSC 19068, Apollo 17.
Nasdale, L, M. Wildner, R. Wirth, N. Groschopf, D. C. Pal, and A. Moller (2006) Alpha particle haloes in chlorite and cordierite. Min. and Pet., 86, 1-27.
Nemchin, A., T. Long, B. L. Jolliff, Y. Wan, J. F. Snape, R. Zeigler, M.L. Grange, D. Liu, M.J. Whitehouse, N.E. Timms, F. Jourdan, (2021). Ages of lunar impact breccias: Limits for timing of the Imbrium inpact. Geochemistry. 81: 125683.
Neuman, M., P. Koefoed, K. Wang, B. L. Jolliff, R. L. Korotev, R. V. Morris, and the ANGSA Science Team, (2022) Major and trace element variations and lithologic component analysis of Apollo 17 drive tube 73002. Apollo 17-ANGSA Workshop, LPI Contrib. 2704, abstract 2704.
Neuman, M. , B. L. Jolliff, K. Wang, H. H. Schmitt, N. Petro, J. Valenciano, C. R. Neal, S. Eckley, J. Kent, L. Sun, P. Lucey et. al., and the ANGSA Science Team (2025) Revealing the Moon’s Taurus-Littrow Landslide via Integrated Analysis of Pristine Apollo 17 Soil Core 73001/2. JGR Planets, https://doi.org/10.1029/2024JE008556.
Nichols, C. I. O., B. P. Weiss, B. L. Getzin, H. H. Schmitt, A. Beguin, A. S. P. Rae, and J. Shah, (2021) The paleoinclination of the ancient lunar magnetic field from an Apollo 17 basalt. Nature Astonomy, 5, 1216-1223.
Niemeyer, S. (1977) Exposure histories of lunar rocks 71135 and 71569. LPSC VII, 3083-3093.
Nishiizumi, K., J. R. Arnold, P. W. Kubik, and P. Sharma (1990) New results on history of gardening in lunar cores 15008 and 76001 using cosmogenic radionuclides. LPSC XXI, 895-896.
Noble, S. K., L. P. Keller, and C. M. Pieters (2003) Making a regolith breccia. LPSC XXXIV, Abstract 1626.
Norris, S. J., P. K. Swart, I. P. Wright, M. M. Grady, and C. T. Pillinger (1983) A search for a correlatable, isotopically light carbon and nitrogen components in lunar soils and breccias., LPSC XIV, B200-B210.
Noumenko-Dezes, M. O., T. F. Nogler, K. Mezger and I. M. Villa (2018) Constraining the 40K decay constant with 87Rb-87Sr – 40K-40Ca chronometer intercomparison. Geochim. Cosmochim. Acta, 220, 235-247
Nozette, S., P. Spudis, B. Bussey, R. Jensen, K. Raney, H. Winters, C. L. Lichtenberg, W. Marinelli, J. Crusan, M. Gates, and M. Robinson (2010) The Lunar Reconnaissance Orbiter Miniature Radio Frequency (Mini-RF) Technology Demonstration. Space Sci. Revs. 50, 285-302.
Nunes, P. D., M. Tatsumoto, and D. M. Unruh (1974) U-Th-Pb systematics of some Apollo 17 lunar samples and implications for a lunar basin excavation chronology. LPSC V. 1487-1514
Nunes, P. D., and M. Tatsumoto (1975) U-Th-Pb systematics of selected samples from Apollo 17, Boulder I, Station 2. The Moon, 14, 463-471
Oberbeck, V. R. (1975) The role of ballistic erosion and sedimentation in lunar stratigraphy. Rev. Geophys. Space Phys., 13, 337–362.
O’Kelley, G. D., J. S. Eldridge, and K. J. Northcutt (1974) Cosmogenic radionuclides in samples from Taurus-Littrow: Effects of the solar flare of August 1972. LPSC V, 2139-2147
Osinski, G. R., R. A. F. Grieve, and L. L. Tornabene (2015) Impact ejecta emplacement: Observations from the terrestrial planets, the Moon and Vesta. LPSC ILV, abstract 1012.
Papanastassiou, D. A., and G. J. Wasserburg (1975) Rb-Sr- study of a lunar dunite and evidence for early lunar differentiates. LPSC VI, 1467–1490.
Papike, J. J. and J. Wyszynski, (1980) Apollo 17 drive tube 76001: Modal petrology, LPSC XI, 1609-1621.
Papike, J. J., S. B. Simon, and J. C. Laul (1982) The Lunar Regolith: Chemistry, mineralogy and petrology. Rev. Geophys. Space Phys. 20, 761-826.
Perelygin, V. P., S. G. Stetsenko, R. I. Petrova, and D. S. Yadav (1997) Study of fossil tracks due to VH and VVH groups of cosmic ray nuclei in olivine crystals from Luna-16 and Luna-24. Radiation Measurements, 28, 333-336.
Petro, N. E., and H. H. Schmitt (2018) Volcanic fissure and associated deposit on the North Massif of the Taurus Littrow valley. LPSC IL, abstract 2631.
Petrowski, C., J. F. Kerridge, and I. R. Kaplan (1974) Light element geochemistry of the Apollo 17 site. LPSC V, 1939-1948.
Pike, R. J. (1974) Depth/diameter relations of fresh lunar craters: revisions from spacecraft data, Geophys. Res. Lett. 1, 291-294.
Pieters, C. M., L. A. Taylor, S. K. Noble, L. P. Keller, B. Hapke, R. V. Morris, C. C. Allen, D. S. McKay, and S. Wentworth (2010), Space weathering on airless bodies: Resolving a mystery with lunar samples, Met. & Planet. Sci. 35, 1101-1107.
Poppe, A. R., I. Garrick-Bethell, S. Fatemic, C. Grava (2024) The lunar 40Ar/36Ar antiquity indicator in the presence of a lunar paleomagnetosphere. Icarus, 415, 116079.
Raney, R. K. (2007) Hybrid-Polarity SAR Architecture. IEEE Trans Geosci. Remote Sens. 45, 3397.
Raney, R. K., P. D. Spudis, B. Bussey, J. Crusan, L.R. Jensen, W. Marinelli, P. McKeracher, C. Neish, M. Palsetia, R. Schulze, H. B. Sequeira, and H. Winters (2011), The lunar Mini-RF Radars: Hybrid polarimetric architecture and initial results, Proc. IEEE, 99(5), 808–823, https://doi.org/10.1109/JPROC.2010.2084970.
Reames, D. V., (2021) Solar Energetic Particles, 2nd Edition,Springer, New York. 225 p.
Renne, P. R., R. Mundil, G. Balco, K. Min, and K. R. Ludwig (2010) Joint determination of 40K decay constants and 40Ar∗/40K for the Fish Canyon sanidine standard, and improved accuracy for 40Ar/39Ar geochronology, Geochim. Cosmochim. Acta, 74, 5349–5367, https://doi.org/10.1016/j.gca.2010.06.017.
Rhodes, J. M., K. V. Rodgers, C. Shih, B. M. Bansal. L. E. Nyquist, H. Wiesmann, and N. J. Hubbard (1974) The relationships between geology and soil chemistry at the Apollo 17 landing site. LPSC V, 1097-1117.
Robinson, M., and B. Jolliff (2022) The landslide that is not. Proc. 44th COSPAR Scientific Assembly, https://ui.adsabs.harvard.edu/abs/2022cosp…44..276R.
Rose, H. J., F. Cuttitta, S. Berman, F. W. Brown, M. K. M. Carron, R. P. Christian, E. J. Dwornik and L. P. Greenland (1974) Chemical composition of rocks and soils at Taurus-Littrow. LPSC V, 1119-1133
Rutherford, M. J., J. W. Head, A. E. Saal, E. Hauri, and L. Wilson, Model for the origin ascent and eruption of lunar picritic magmas, Am. Min., 102, 2045-2053.
Saito, K and Alexander E. C., Jr. (1979) 40Ar-39Ar studies of lunar soil 74001. LPSC X, (abstract) 1079.
Schaeffler, O. A., H. W. Muelier, and T. L. Grove (1977) Laser Ar-39-Ar-40 study of Apollo 17 basalts. LPSC VIII, 1489-1499.
Schmitt, H. H. (1964) Petrology and Structure of the Eiksundal Eclogite Complex, Hareidland, Sunnmöre, Norway. PhD dissertation, Harvard University, 50-130.
Schmitt, H. H. (1972) Apollo 17 Transcript, ALSJ GET 121:26:28-122:36:58, 141:32:52-146:56:48, 164:21:04-169:10:25: https://apollojournals.org/alsj/a17/a17.html.
Schmitt, H. H. (2006) Return to the Moon. Springer, 335 pp.
Schmitt, H. H. (2013) Eclogite facies metamorphism, Eiksund area Sunnmore, Western Norway NE Sec. Ann. Mtg., Geol. Soc. Am., Paper #36-8.
Schmitt, H. H. (2014a) Geology and stratigraphy of Shorty Crater pyroclastic ash deposits. LPSC LIV, (abstract) 1072.
Schmitt, H. H. (2014b) Apollo 17: New Insights from the Synthesis and Integration of Field Notes, Photo-Documentation, and Analytical Data. LPSC XLV, (abstract) 2732.
Schmitt, H.H. (2015) Potential catalytic role of phyllosilicates in prebiotic organic synthesis, in Osinski, G. R., and Kring, D. A., eds., Large Meteorite Impacts and Planetary Evolution V: Geological Society of America, Special Paper 518, p. 1–16, https://doi.org/10.1130/2015.2518(01).
Schmitt, H. H. (2016a) North Massif regolith at Taurus-Littrow may contain lithic-clastic volcanic debris erupted prior to mare basalt. LEAG Ann. Mtg., abstract 5008.
Schmitt, H. H. (2016b) Symplectites in dunite 72425 and troctolite 76535 indicate mantle overturn beneath lunar near side (2016) LPSC XLVII, abstract 2339.
Schmitt, H. H. (2017) Geology of Shorty Crater pyroclastic ash deposits: 44 years and counting for Apollo 17. LPSC XLVIII, abstract 2017.
Schmitt, H. H. (2019a) Nature of the Taurus-Littrow regolith at the base of the North Massif – Drive tube core 76001/2. LPSC L, abstract 1297.
Schmitt, H. H. (2019b) Masursky Lecture, LPSC LI.
Schmitt, H. H. (2021) Apollo 17 deep drill core 70001/9: large impact ages at Taurus-Littrow, recorded increase in solar luminance, and implications for ANGSA studies. LPSC LX, abstract 2575.
Schmitt, H. H. (2022a) Maturation rate of immature zone in Taurus-Littrow regolith deep drill core estimated at one 0.243 Is/FeO unit per Myr with nearly equal solar wind and U+Th alpha decay radiation. LPSC LIII, abstract 2723.
Schmitt, H. H. (2022b) Taurus-Littrow Data Synthesis: Progress Report. Apollo 17-ANGSA Workshop, abstract 2002.
Schmitt, H. H. (2023a) Apollo 17: Diary of the 12th Man, https://www.americasuncommonsense.com.
Schmitt, H. H. (2023b) Continuously (“Permanently”) Shaded Lunar Regolith Sampled By Apollo 17: Key Tests Of Regolith Temperature Storage For Artemis. LPSC LIV, abstract 217.
Schmitt, H. H. (2024a) Apollo 17: Diary of the 12th Man: Landing, EVA-1, First Discoveries, Vol. 3, Apogee Books, Burlington, Ontario, 314 pp. (also, https://www.americasuncommonsense.com; chps. 8,9,10).
Schmitt, H. H. (2024b) Apollo 17: Diary of the 12th Man: EVA-2, Avalanches. Volcanic Ashes, & Bedrock, Vol. 4, Apogee Books, Burlington, Ontario, 273 pp. (also, https://www.americasuncommonsense.com; chp. 11).
Schmitt, H. H. (2024c) Apollo 17: Diary of the 12th Man – EVA-3. Boulders, Large Impacts, & Ancient Solar Wind, Vol. 5, Apogee Books, Burlington, Ontario, 270 pp. (also, https://www.americasuncommonsense.com; chp. 12).
Schmitt, H. H. and E. A. Cernan (1972a) Apollo 17 Transcript, ALSJ, https://apollojournals.org/alsj/a17/a17.html.
Schmitt, H. H. and E. A. Cernan (1972b) ALSJ, GET 143:28:19 – 143:32:05 and GET 165:37:29 – 165:39:17: https://apollojournals.org/alsj/a17/a17.html.
Schmitt, H. H., N. E. Petro, R. A. Wells, M. S. Robinson, B. P. Weiss, and C. M. Mercer (2017), Revisiting the field geology of Taurus-Littrow, Icarus, 298, 2-33.
Schreve, R. L., 1968, The Blackhawk Debris Flow, Geological Society of America, Special Paper 108, 1-48.
Scott, R. F., 1987, Failure, Geotechnique, 37, 423-466.
Sears, D., A. Sehlke, and H. H. Schmitt (2024) Thermoluminescence and Apollo 17 ANGSA lunar samples: NASA’s fifty-year experiment and prospecting for cold traps., Jour. of Geophys. Res. – Planets, 129(10) https://doi.org/10.1029/2024JE008358.
Sehlke, A., and D.W.G. Sears and the ANGSA Science Team (2022) Five decades of Thermoluminescence studies on lunar samples: First results of NASA’s unique forty-six year experiment and its implications for resource prospecting on the Moon. LPSC VIII, abstract 1267.
Sehlke, A., W. G. Sears, H. H. Schmitt, and the ANGSA Science Team (2026). Thermal gradient and thermal wave propagation depth recovered using thermoluminescence of the Apollo 17 Deep Drill Core. JGR Planets, in press.
Shea, E. K.. B. P. Weiss, W. S. Cassata, D. L. Shuster, S. M. Tikoo, J. Gattacceca, T. L. Grove, M. D. Fuller (2012) A long-lived lunar core dynamo, Science, 335, 453-456. https://doi.org/10.1126/science.1215359.
Shearer, C. K., P. C. Hess, M. A. Wieczorek, M. E. Pritchard, E. M. Parmentier, L. E. Borg, et al. (2006) Thermal and Magmatic Evolution of the Moon. Rev. Min. Geochem., 60, 365–518. https://doi.org/10.2138/rmg.2006.60.4.
Shearer, C. K, S. M. Elardo, N. E. Petro, L. E. Borg and F. M. Mccubbin (2015) Origin of the lunar highlands Mg-suite: An integrated petrology, geochemistry, chronology, and remote sensing perspective. Am. Min. 100, 294-325.
Shearer, C. K. and the ANGSA Team (2022) Apollo Next Generation Sample Analysis, Apollo 17-ANGSA Workshop, Lunar and Planetary Institute.
Shearer, C. K., F. M. McCubben, S. Eckley, S. B. Simon, A. Meshik, F. McDonald, H. H. Schmitt, and the ANGSA Team (2024) Apollo Next Generation Sample Analysis (ANGSA): An Apollo participating scientist program to prepare the lunar sample community for Artemis. Space Sci. Rev. 220, 62. https://doi.org/10.1007/s11214-024-01094-x.
Shoemaker, E. M. (1965) Preliminary analysis of the fine structure of Mare Cognitum. JPL Tech. Rpt. 32-700, 35p.
Shoemaker, E. M., R. M. Batson, H. E. Holt, E. C. Morris, J. J. Rennilson, and E. A. Whitaker (1967) Television observation for Surveyor III, Surveyor III: A Preliminary Report, NASA SP-146, 9-59.
Silver, L. T. (1974) Patterns of U-Th-Pb distributions and isotope relations in Apollo 17 soils, LPSC V, abstract 2446.
Simmons, G., D. Strangway, P. Annan, R. Baker, L. Bannister, R. Brown et al. (1973) Surface Electrical Properties Experiment. Apollo 17 Prelim. Sci. Rep., NASA SP-330, 15-1–15-14.
Simon, S. B., J. J. Papike, and J. C. Laul (1981) The lunar regolith: Comparative studies of the Apollo and Luna sites. LPSC XII, 371-388.
Simon, S. B., J. H. Papike, and C. K. Shearer (1984) Petrology of Apollo 11 regolith breccias. Jour. Geophys. Res., https://doi.org/10.1029/JB089iS01p0C108.
Simon, S. B., C K. Shearer, M. J. Cato, and the ANGSA Science Team (2022) Modal petrology of the 1mm to 150 mm fraction of Apollo 17 drive tube section 73002. Apollo 17-ANGSA Workshop, LPI Contrib. 2704, abstract 2009.
Smith, J. V., A. T. Anderson, R. C. Newton, E. J. Olsen, and P. J. Wyllie (1970) Petrologic history of the Moon inferred from petrography, mineralogy, and petrogenesis of Apollo 11 rocks. LPSC I 897-925.
Speyerer, E. J., R. Z. Povilaitis, M. S. Robinson, P. C. Thomas, and R. V. Wagner (2016) Quantifying crater production and regolith overturn on the Moon with temporal imaging, Nature, 538, 215-218.
Stettler, A., P. Eberhardt, J. Geiss, and N. Grogler, 1974, 39Ar40Ar ages of samples from the Apollo 17 Station 7 boulder and implications for its formation. Earth Planet. Sci. Lett., 23, 453-461.
Stettler, A., P. Eberhardt, J. Geiss, N. Crogler, and S. Guggisberg (1978) Chronology of the Apollo 17 Station 7 boulder and the south Serenitatis impact. LPSC XI, pre-meeting abstract., 1113-1117.
Stone, C. D., L. A. Taylor, D. S. McKay, and R. V. Morris (1982) Ferromagnetic resonance intensity: A rapid method for determining lunar glass bead origins. LPSC XIII, A182-A196.
Stoeser, D. B., R. W. Wolfe, J. A. Wood and J. F. Bower (1974) Petrology and petrogenesis of boulder 1, In Interdisciplinary Studies of Samples from Boulder 1, Station 2, Apollo 17. Volume 1, Consortium Indomitabile. Smithsonian Astrophysical Observatory. Also Lunar Science Institute Cont. no. 210D, 35-109.
Sun, L., P. G. Lucey , A. Flom , R. A. Zeigler , J. Gross, N. Petro, C. Shearer , F. M. McCubbin, and the ANGSA Science Team (2022) Multispectral Imaging Results of Apollo 17 Double Drive Tube 73001/2. Apollo 17 ANGSA Workshop, LPI Contrib. 2704, abstract 2021.
Talwani, M., G. Thompson, B. Dent, H-G. Kahle, and S. Buck (1973) Traverse Gravimeter Experiment, Apollo 17 Preliminary Science Report, 13-1 to 13-13.
Taylor, G. J., K. Keil., and R. D. Warner (1977) Very low-Ti mare basalts. Geophys. Res. Letters 4, 207-210, https://doi.org/10.1029/GL004i006p00207.
Taylor, G. J., R. D. Warner, and K. Keil (1979) Stratigraphy and depositional history of the Apollo 17 drill core. LPSC X, 1159-1184.
Taylor, L. A. (1988) Generation of native Fe in lunar soil. In Engineering, Construction and Operations in Space: Proceedings of Space ’88, S.W. Johnson and J.P. Wetzel eds., American Society of Civil engineers, New York, 67-77.
Taylor, L. A. and Meek, T. T. (2005) Microwave Sintering of Lunar Soil: Properties, Theory, and Practice. Journal of Aerospace Eng., 18, 188-196, https://doi.org/10.1061/(ASCE)0893-1321(2005)18:3(188)
Taylor, L. A., C. Pieters, L. P. Keller, R. V. Morris, D. S. Mckay, A. Patchen, and S. Wentworth (2001a) The effects of space weathering on Apollo 17 mare soils: Petrography and chemical characterization. Met. & Planet. Sci. 36, 285-299.
Taylor, L. A., C. Pieters, L. P Keller, R. V. Morris, D. S. Mckay, A. Patchen, and S. Wentworth (2001b) Lunar mare soils: Space weathering and the major effects of surface correlated nano-phase Fe. J. Geophys. Res., 106 27,985-28,000.
Taylor, L. A., H. H. Schmitt, W. D. Carrier, and M. Nakagawa (2005) The lunar dust problem: From liability to asset. AIAA, Envir. Sci. and Eng., 1-8.
Tera, F. and G. J Wasserburg. (1976) Lunar ball games and other sports. LPSC VII, abstract 858-860.
Thiemens, M. H., and R. N. Clayton (1980) Solar and cosmogenic nitrogen in the Apollo 17 deep drill core. LPSC XI, 1435-1451.
Thiemens , M. H., and R. N. Clayton (1983) Nitrogen contents and isotopic ratios of clasts from the enstatite chondrite Abee. Earth Planet. Sci. Lett., 62, 165-168. https://doi.org/10.1016/0012-821X(83)90080-8.
Tikoo, S. M., B. P. Weiss, D. L. Shuster, C. Suavet, H. Wang, and T. L. Grove (2017) A two-billion-year history for the lunar dynamo. Res. Article, Science Advances. 3:e1700207, 1-9.
Turner, G. and P. H. Cadogan (1975) The history of lunar bombardment inferred from 40Ar-39Ar dating of highland rocks. LPSC VI. 1509–1538.
Valverde, J. M. and A. Castellanos (2006) Compaction of fine powders: from fluidized agglomerates to primary particles, Granular Matter, 9, 19-24.
Van der Bogert, C. H., H. H. Hiesinger, M. I. Banks, T. I. Watters, and M. S. Robinson (2012) Derivation of absolute model ages for lunar lobate scarps, LPSC XVIII, abstract 1847.
Van der Bogert, C., L. Gaddis, H. Hiesinger, M. Ivanov, B. Jolliff, P. Mahanti, and J. H. Pasekert (2016) Revisiting the CSFDS of the Taurus Littrow dark mantle deposit: implications for age determinations of pyroclastic deposits. LPSC XLVII, abstract 1616.
Vaniman, D. T. and J. J. Papike (1977) Very low Ti (VLT) basalts: A new mare rock type from the Apollo 17 drill core. LPSC VIII, 1443-1471.
Vaniman, D. T., T. C. Labotka, J. J. Papike, S. B. Simon and J. C. Laul (1979) The Apollo 17 drill core: Petrologic systematics and the identification of a possible Tyco component. LPSC X, 1285-1227.
Walton, J. R., S. Lakatos, and D. Heymann (1973) Distribution of inert gases in fines from the Cayley-Descartes region. LPSC IV, 2079-2096.
Wang, K., S. B. Jacobsen, F. Sedaghatpour, H. Chen, and R. L. Korotev (2015) Lunar dunite reveals the same iron isotopic composition of the bulk silicate Earth and Moon. LPSC LXVI, abstract 1980.
Warran, P. H. and J. T. Watson (1979) The origin of KREEP, Reviews of Geophys., https://doi.org/10.1029/RG017i001p00073.
Wasson, J. T., W. V. Boynton, G. W. Kallemeyn, L.L. Sundberg, and C. M. Wai (1976) Volatile compounds released during lunar lava fountaining. LPSC VII, 1583-1595.
Watson, K., H. Brown and B. C. Murray (1961) The behavior of volatiles on the lunar surface, Jour. Geophys. Res., 66, 3033-3045 https://doi.org/10.1029/JZ066i009p03033.
Wells, R. A. (2021) Apollo over the Moon in Perspective: 3D Anaglyphs and Other Views from Orbit. Apogee Books, Burlington, Ont.: Figs. 3.13c (fold-out, p. 159); 3.13e (p. 161), 3.13 g,h (p. 163); and Fig. 13.32c of the present Diary (Ch. 13) is unpublished image #09 from the Taurus-Littrow DTM collection.
Wells, R. A., ed., In Schmitt, H. H., (2024), Apollo 17: Diary of the 12th Man – EVA2: Avalanches, Volcanic Ashes, & Bedrock, Vol. 4, Apogee Books, Burlington, Ont.: Fig. 11.36, p. 83.
Wells, R. A., ed., In Schmitt, H. H., (2024), Apollo 17: Diary of the 12th Man – EVA3: Boulders, Large Impacts & Ancient Solar Wind, Vol. 5, Apogee Books, Burlington, Ont.: Fig. 12.44, p. 56.
Welten, K.C., M.W Caffee, K. Nishiizumi, and ANGSA Science Team (2022) Cosmgenic radio-nuclides in lunar core 73002/01: Cosmic-ray exposure history and regolith mixing of the lunar surface. Apollo 17-ANGSA Workshop, LPI Contrib. 2704, abstract 2046.
Whittington, H. B. (1985) The Burgess Shale, Yale Univ. Press, https://search.worldcat.org/fr/title/15630217.
Wieczorek, M. A., G. A. Neuann, F. Nimmo, W. S. Kiefer, G. J. Taylor, et al. (2012) The Crust of the Moon as Seen by GRAIL. Science, 339, 671-675. https://doi.org/10.1126/science.1231530.
Wilhelms, D. E. (1987) The Geologici History of the Moon, USGS Prof. Paper 1348, 302p.
Williams, J.-P, B. T. Greenhagen, D. A. Paige, N. Schorghofer, E. Sefton‐Nash, P. O. Hayne, P. G. Lucey, M. A. Siegler, and K. Aye (2019) Seasonal polar temperatures on the Moon, Res. Art., Jour. Geophys. Res. Planets, 124, 2505-2521, https://doi.org/10.1029/2019JE006028.
Wittenberg, L. J., J. F. Santarius, and G. L. Kulcinski (1986) Lunar source of 3He for commercial fusion power. Fusion Technology, 10, 167-178.
Wolfe, E. W. (1975) Geologic setting of Boulder 1, Station 2, Apollo 17 landing site. The Moon 14, 307–314.
Wolfe, E.W., N. G. Bailey, B. K. Lucchitta, W. R. Muehlberger, D. H. Scott, R. L. Sutton, and H. G. Wilshire (1981) The Geologic Investigation of the Taurus-Littrow Valley: Apollo 17 Landing Site, U.S. Geological Survey Professional Paper 1080, US Government Printing Office, 280p.
Wood, B. J. and S. Banno (1973) Garnet-orthopyroxene and orthopyroxene-clinopyroxene relationships in simple and complex systems. Contrib. Min. Pet., 42, 109-124.
Wood, J. A., J. S. Dickey, Jr., U. B. Marvin, and B. N. Powell (1970) Lunar anorthosites and a geophysical model of the Moon. LPSC I , 965-988.
Yokoyama, Y, J.-L Reyss and F. Guichard (1975) 23Na-26Al studies of lunar regolith, LPSC VI, 1823-1843.
Zellner, N. E. B., J. W. Delano, T. D Swindle, F. Barra, E. Olsen, and D. C. B. Whittet, (2009) Apollo 17 regolith, 71501,262: A record of impact events and mare volcanism in lunar glasses, Meteor. Planet. Sci. 44, 839-851.
Zhang, B., Y Lin, D. E. Moser, J. Hao, S.R. Shieh, R. Sean, A. Bouvier (2019). Imbrium age for zircons in Apollo 17 South Massif impact melt breccia 73155. J. Geophys. Res. – Planets, 124, 3205–3218.
Zuber, M. T., D. E. Smith, M. N. Watkins, S. W. Asmar, et al. (2013) Gravity Field of the Moon from the Gravity Recovery and Interior Laboratory (GRAIL) Mission. Science, 339, 668-671, https://doi.org/10.1126/science.1231507.


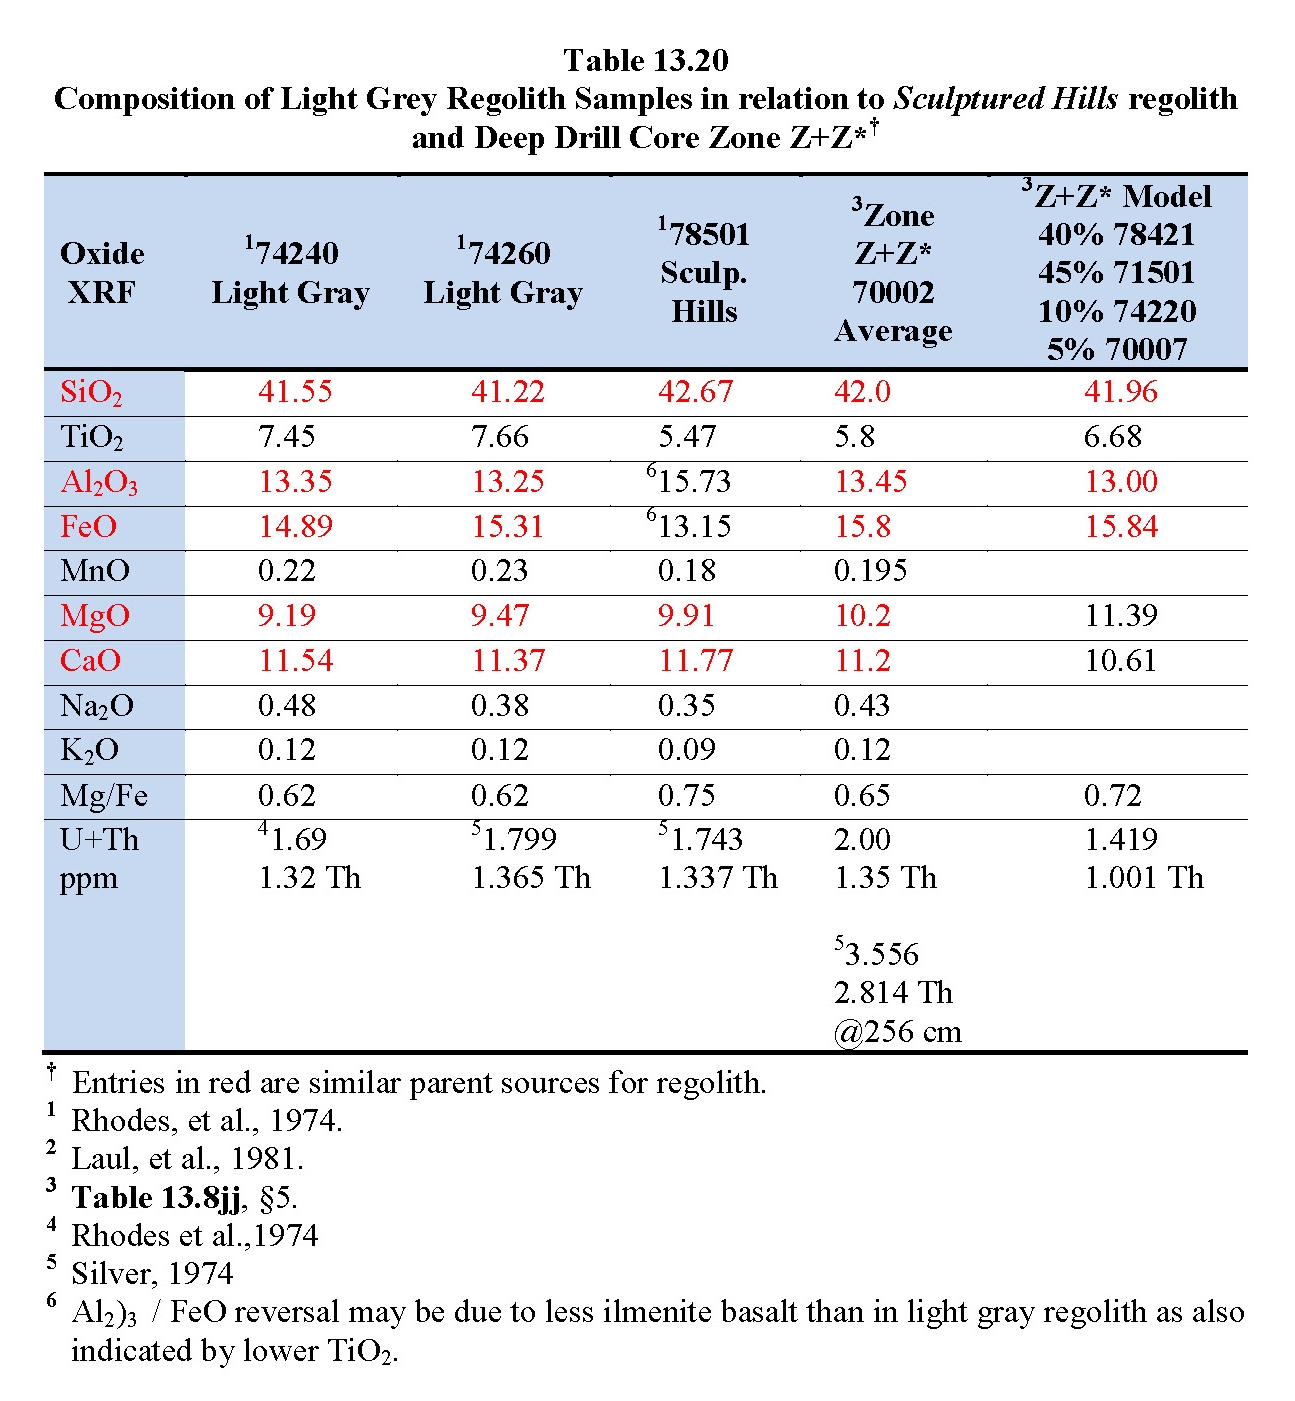
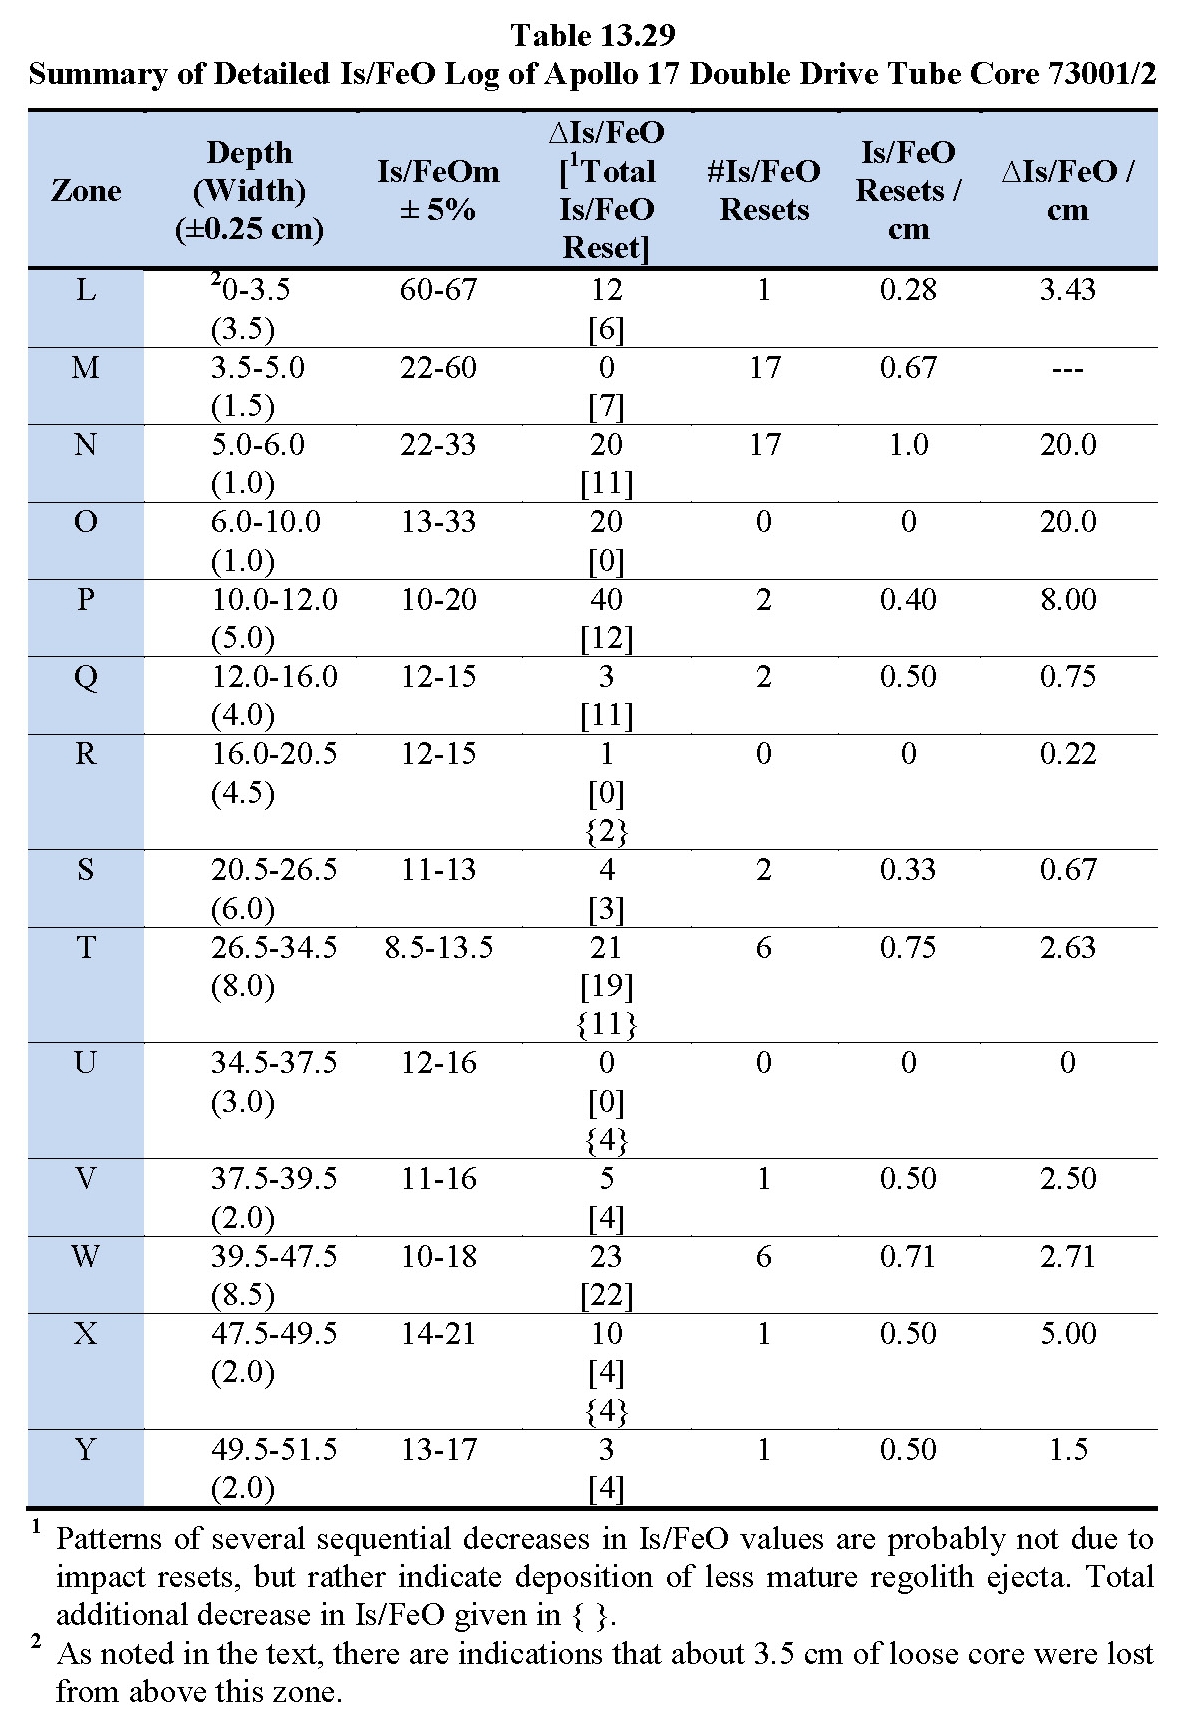
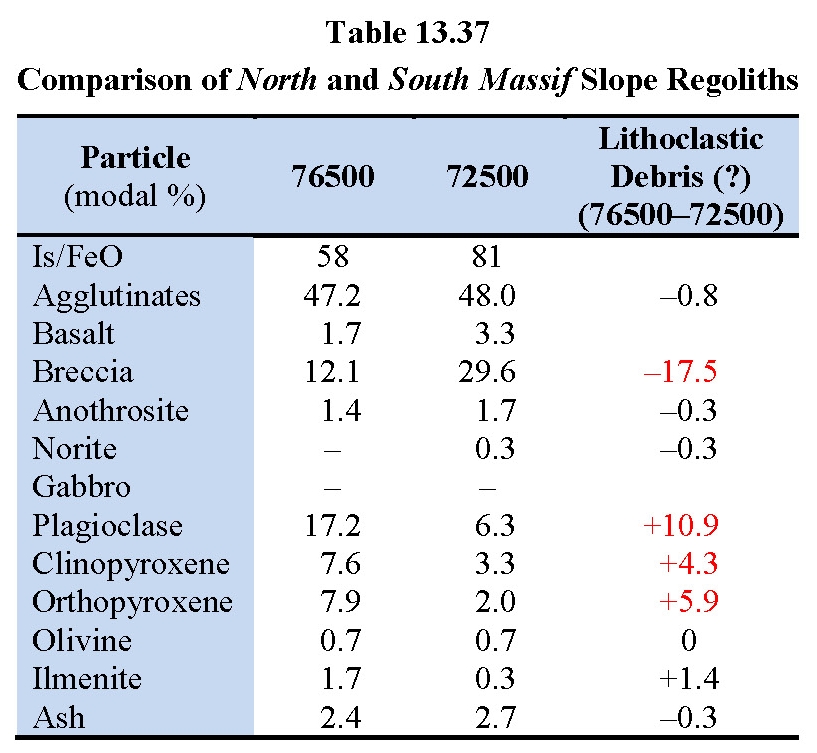
Copyright © by Harrison H. Schmitt, 2026. All rights reserved.